|
Dotp is short for Dot Product. Skyline can calculate following measures of spectral similarity:
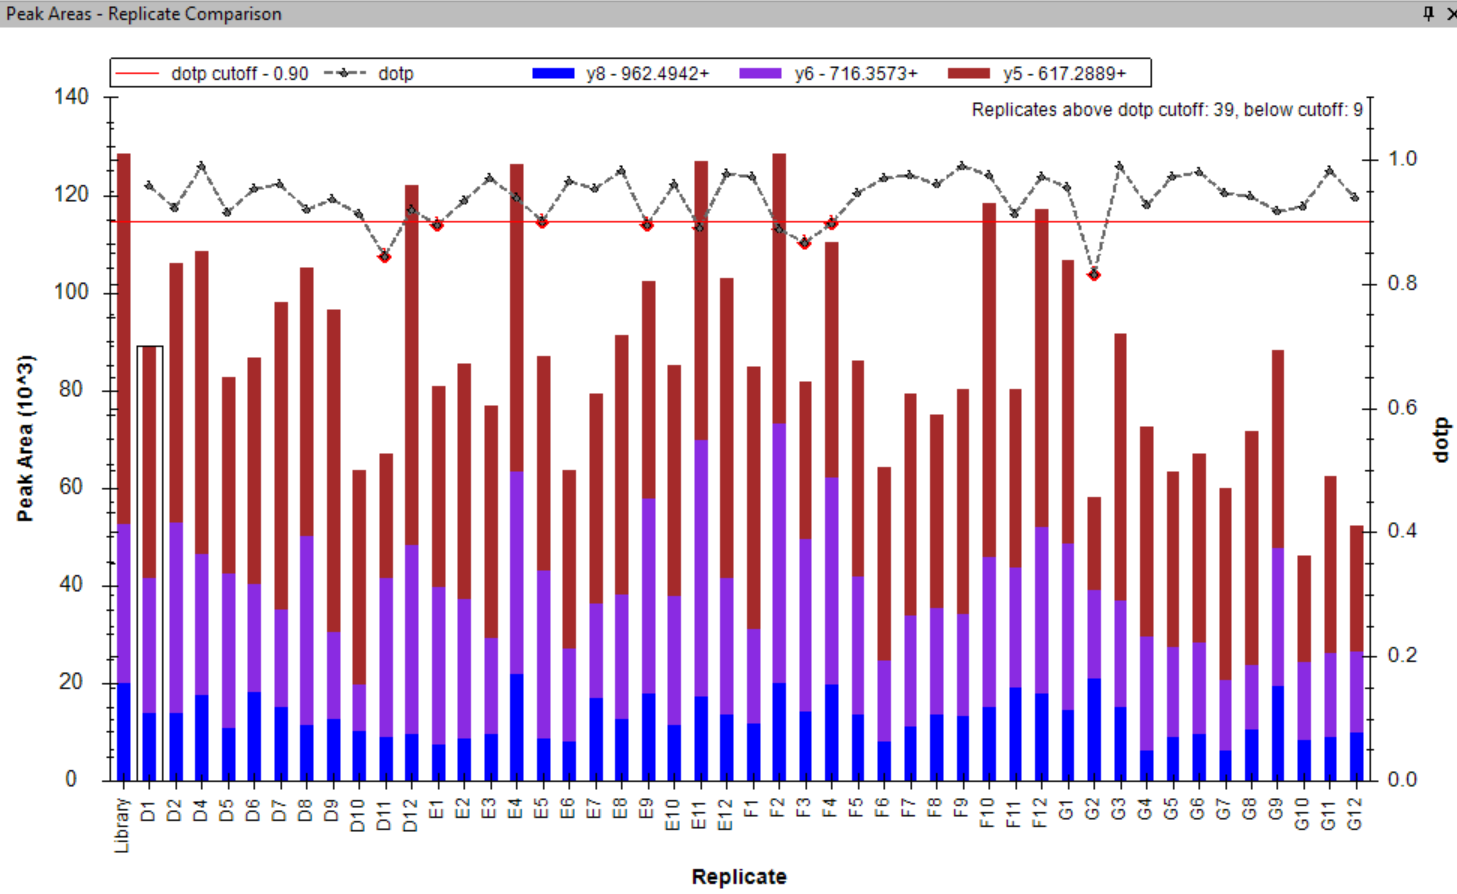
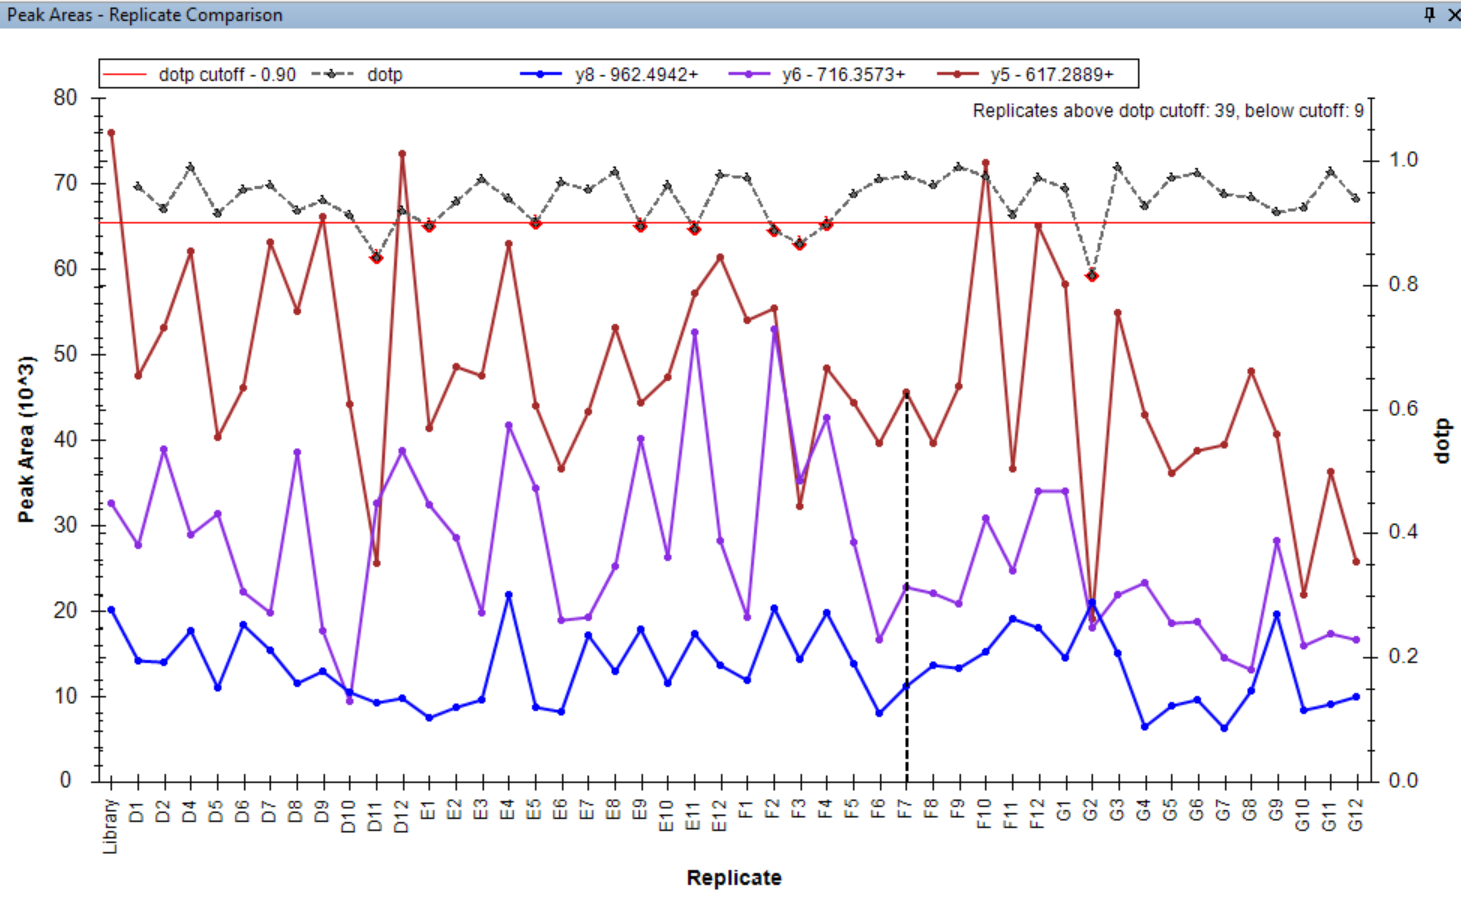
While the actual dot product(covariance) was the initial similarity metric used by Skyline, most recent versions actually use normalized spectral contrast angle. Since dot products are calculated using the peak areas they are graphically represented in the Peak Area Replicate Comparison plot. They are also available in the Document Grid reports. Previous versions of Skyline presented dotp as labels in the peak area bar chart. Starting from the version 21.2.1.424 it can also be represented as an interactive line plot. Unlike the labels, the plot is visible in both bar chart and line chart modes. | |
 |
 |
 |
The line uses the right Y axis for scale. Presentation mode is controlled through the context menu or the properties dialog, so it is possible to revert to the old presentation as labels or turn it off completely. |
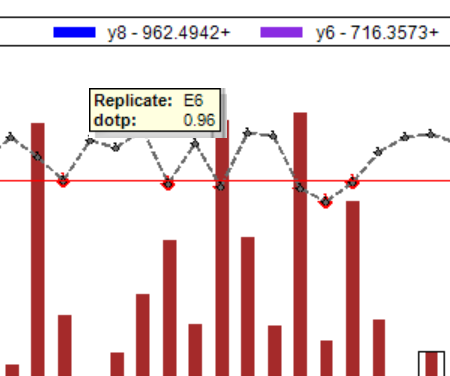 |
Mouse hover over a point in the plot shows a tooltip with replicate name and numeric value of dotp for that replicate. |
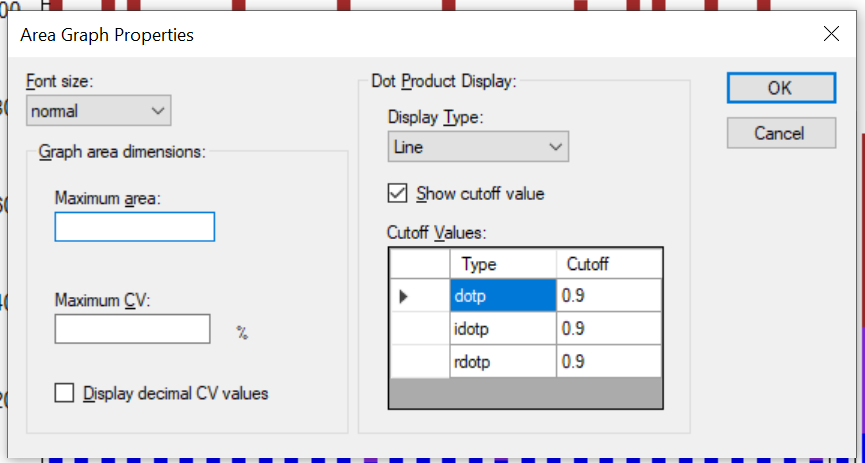 |
User can specify a dotp cutoff value individually for each type of dot product in the properties dialog. If the cutoff line is enabled, the cutoff value is shown in the plot and the points below the line are highlighted red. |
| previousnext |
| expand allcollapse all |