If you are looking for a MS/MS spectrum viewer, you may not be familiar with Skyline, a tool developed primarily to aid targeted proteomics investigation. Skyline does, however, provide features that make it ideal for sharing MS/MS spectra with manuscripts before and after publication. Skyline displays fully annotated spectra for peptides with post translational modifications (PTMs) and neutral losses extremely quickly, and the Skyline software itself is freely available and easy to install. [Install Now]
If you already have a Skyline document that was submitted as part of a manuscript follow the steps below to use Skyline to view these spectra:
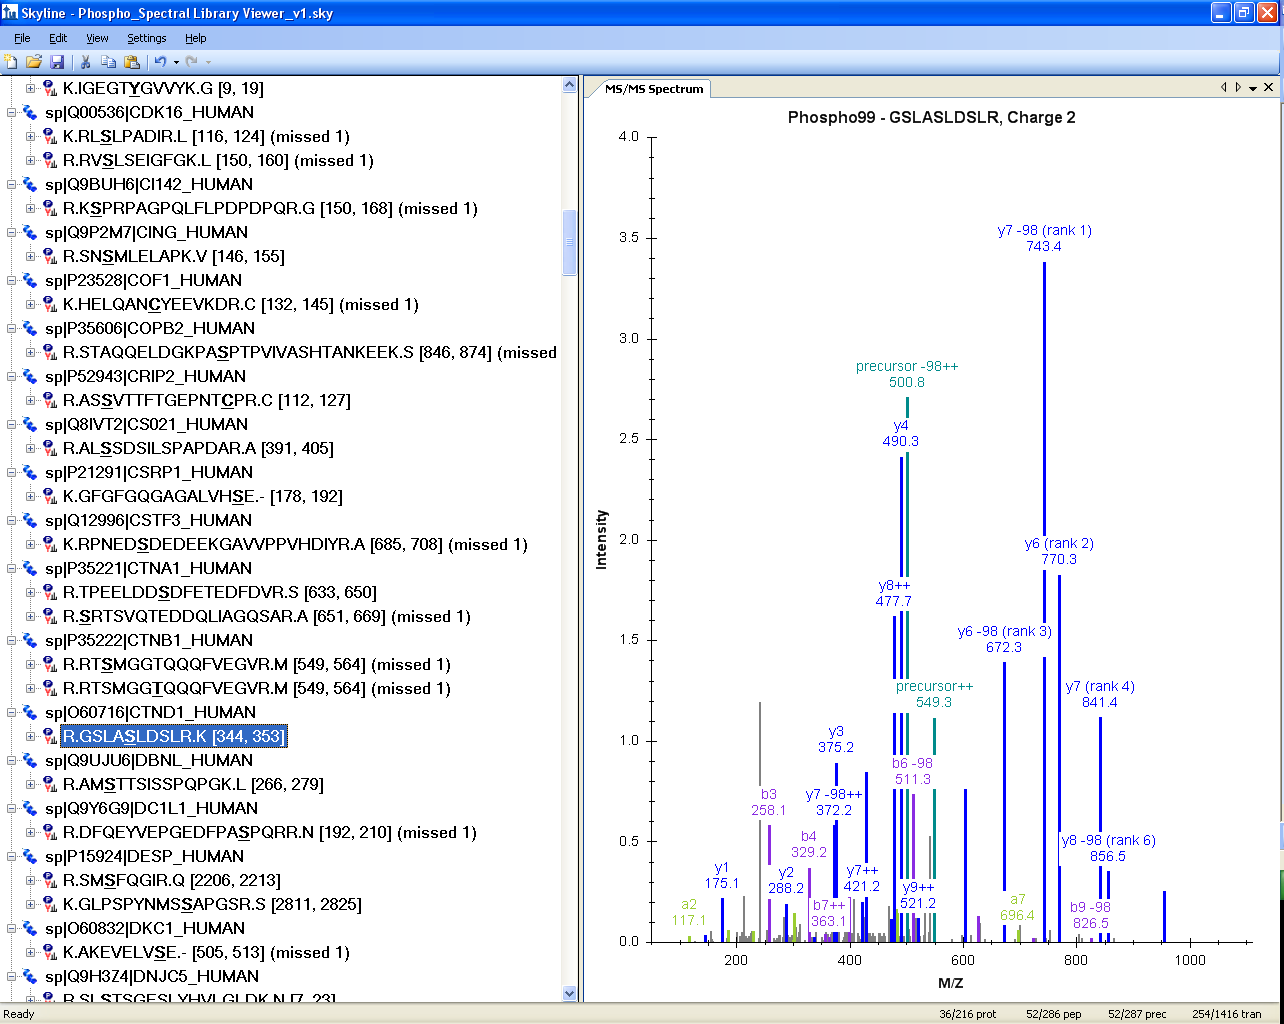
Once the file is open in Skyline, it should look something like this:

If you do not see the MS/MS spectrum graph:
If you want to see different precursor charge states for the peptides in the document:
Select peptides or precursors in the Peptide View on the left to see the corresponding MS/MS spectrum.
For PTMs in the Peptide View, any modified amino acid is bold and underlined.
If you hover over a protein name, the positions of the peptides it contains are highlighted in bold colored text. If a peptide is selected in the Peptide View, it is highlighted in red.

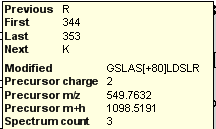
If a peptide of interest contains post translational modifications (as in this case Ser-348 phosphorylation) you can see the modified amino acid bold and underlined in the Peptide view. You can also hover over the peptide and Skyline will present more information in a tip, including the delta-mass of each modification specified in brackets in a field labeled “Modified”.

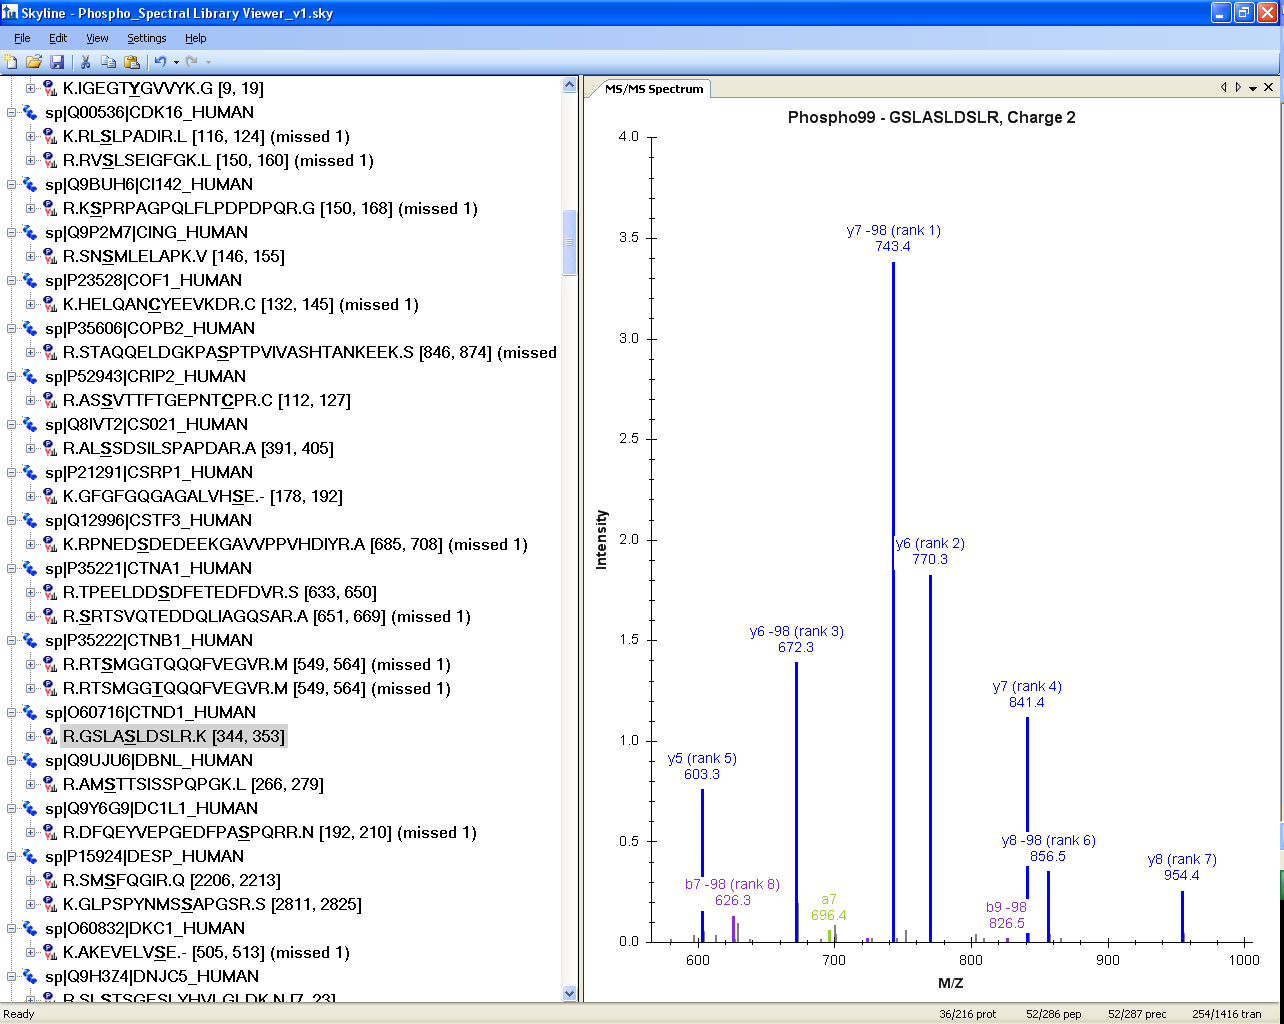
The MS/MS spectrum is interactive and one can zoom into the spectrum, using the mouse scroll wheel or by clicking and dragging a box around a region of interest, to see further fragmentation details.

In the above case of MS/MS for GSLAS348LDSLR [344, 353], zooming in clearly shows that Ser-348 is phoshorylated, and that there is no site ambiguity as the y5 ion and the y6/y6-98 ions clearly determine the position of the phospho group on Ser-348.
If there is phosphorylation site ambiguity, and the PTM site is indistinguishable, Skyline can be used to simulate both peptide isoforms and to easily indicate site ambiguity:
Such as the peptide
R.GEPNVSYICSR.Y [272, 282], phosphorylation simulated at Ser-277
and the isoform
R.GEPNVSYICSR.Y [272, 282], phosphorylation simulated at Ser-281
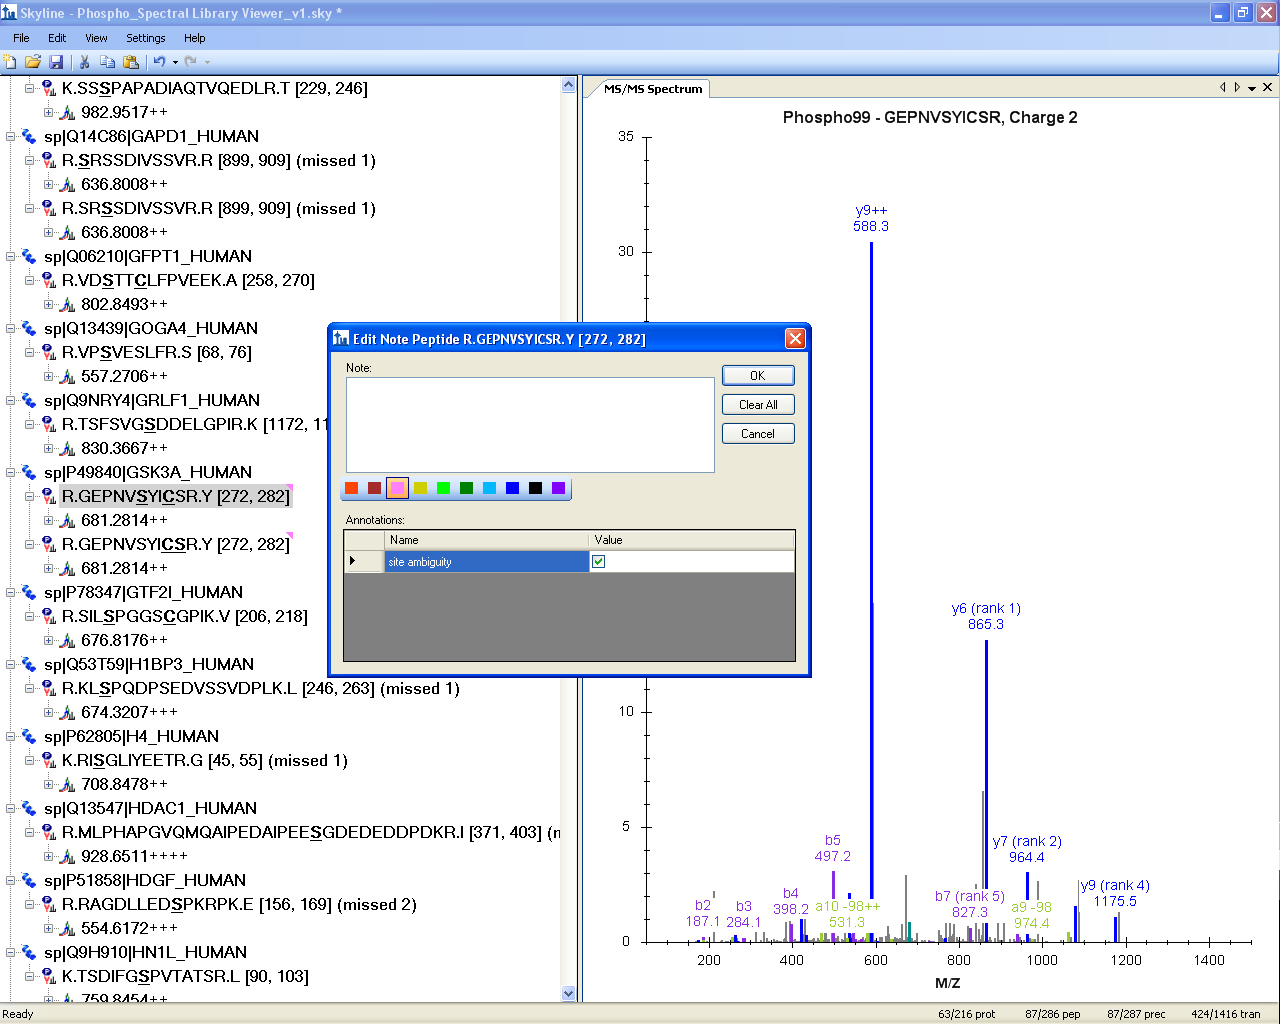
In the Skyline document shown below, both isoforms have a pink triangle in the upper right corner of the peptide label. This triangle indicates an annotation on the peptide.
To view the peptide annotation, right-click on the peptide sequence in the Peptide View and click Edit Node to view a form like the one displayed below. (In version 1.2 and later, these annotations are shown in the peptide details tip mentioned above, and also by themselves if you hover the mouse over the colored triangle.)

Skyline Custom Annotation can be used to indicate the site ambiguity as demonstrated above with the “TRUE/FALSE” check mark within the peptide note. These Annotations can easily be exported into custom Skyline reports (csv files). For more information on annotations and reports, consult the Skyline Custom Reports & Results Grid tutorial.
Publishing a Skyline document for MS/MS spectrum viewing as part of manuscript submission allows the reader to interactively view MS/MS spectra. Skyline can help with assessment of site ambiguity and allow you to indicate, using custom annotation, cases where site ambiguity of PTMs exists.
These Skyline spectral libraries can be further used to design targeted assays and may provide a valuable resource for researchers interested in a certain data set.
For manuscript submission, Skyline spectral libraries can easily be generated from many common peptide identification search engine outputs, for further details see the Skyline Spectral Library Explorer tutorial.