Definitions:
NOTE: Skyline uses points that have been linear interpolated from the raw data onto a uniform interval over the duration of the chromatogram in detecting its peak boundaries and calculating its peak areas. These are also the points Skyline displays in its chromatogram graphs. Skyline uses several types of smoothing (1st derivative, 2nd derivative and Savitzky-Golay) in order to place its automatically calculated peak boundaries. These smoothed curves are available for display in the Skyline chromatogram graphs. Skyline does not, however, use smoothed data in calculating peak areas (or area under the curve - AUC). It always uses the raw interpolated points presented in the unsmoothed graphs.
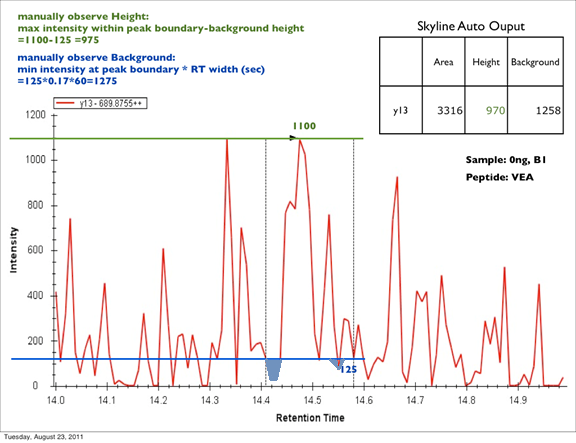
Example of calculation of peak height and background area:

The background area is the rectangle bounded by the background height (blue "125" line) and peak boundaries (gray dotted lines), less the areas of the chromatogram that descend below the background height (light blue areas). You may have noticed that the light blue area at RT=14.55 does not exactly match the shape of the chromatogram: for speed and simplicity the area calculation simply uses the RT of the points to left and right rather than calculating the slope and intercept to get the RT where the chromatogram nominally crosses the background height line. This is a very small discrepancy in most cases.
Skyline graphs this background area information when you select a single transition. You will see the peak area value shaded in red, and the background area shaded in gray. You can place the cursor to the left of the y-axis and use the scroll wheel to zoom in the y-dimension to better inspect the background shading.