Table of Contents |
guest 2025-07-12 |
Install 64-bit Skyline 25.1
Install 64-bit Skyline 25.1 Unplugged
Skyline 25.1 Administrator Install
Install 32-bit Skyline (deprecated)
Install 32-bit Skyline Unplugged
Release Notes
Tutorials
教程 (中国语文)
靶向 方法编辑
靶向方法优化
分析分类研究的数据
处理已有定量实验数据
MS1 全扫描筛选
针对 MS1 筛选的 DDA 搜索
并行反应监测 (PRM)
非数据依赖型采集
SWATH 数据分析
Q Exactive SWATH 数据分析
TripleTOF SWATH 数据分析
小分子目标
小分子方法开发与 CE 优化
小分子定量
绝对定量
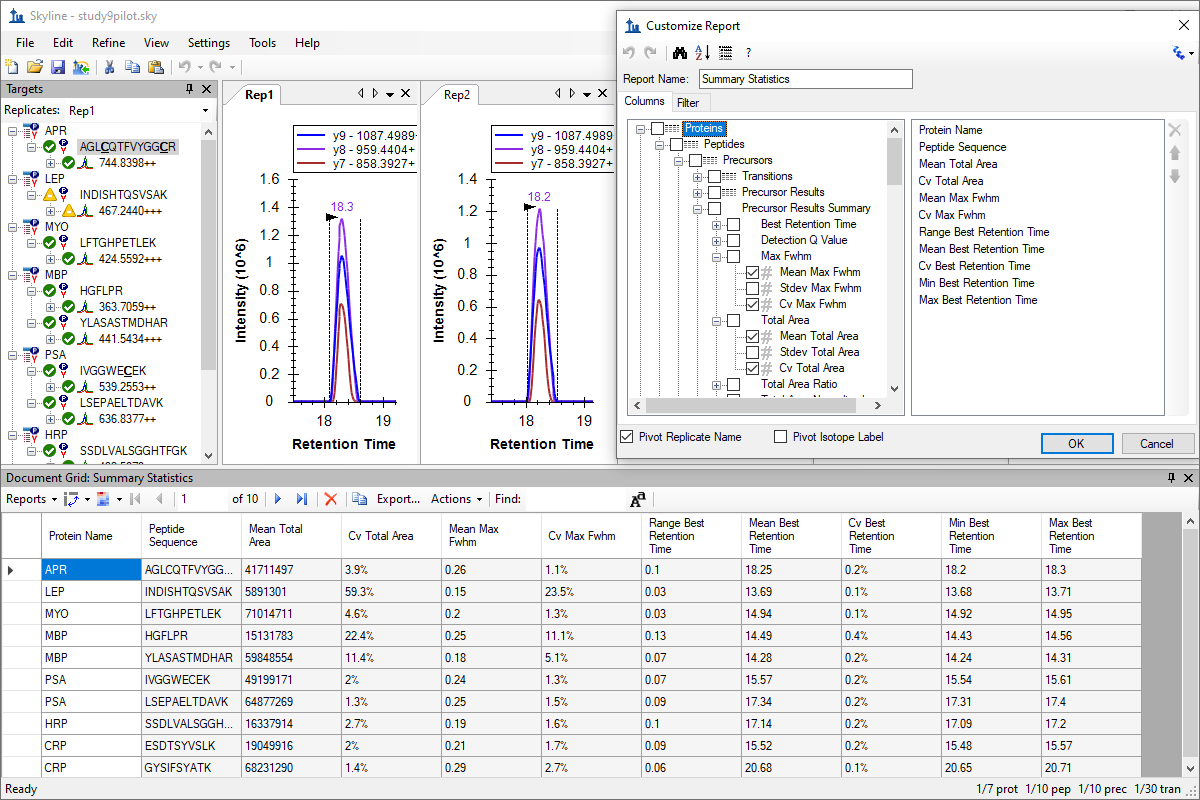
自定义实时报告
iRT 保留时间预测
チュートリアル(日本語版)
ターゲットメソッドの編集
ターゲットメソッドの最適化
によるグループ研究データの処理
既存データ処理および定量実験
MS1フルスキャンフィルタ
MS1 フィルタ用 DDA 検索
併発反応モニタリング(PRM)
DIA、データ非依存性解析
SWATHデータの分析
Q Exactive SWATHデータの分析
TripleTOF SWATHデータの分析
によるターゲットメタボロミクス解析
小分子メソッド開発とCE最適化
小分子の定量化
絶対定量
カスタムレポートとライブレポート
iRT保持時間予測
Targeted Method Editing
Targeted Method Refinement
Processing Grouped Study Data
Existing and Quantitative Experiments
Comparing PRM, DIA, and DDA
PRM With an Orbitrap Mass Spec
MS1 Full-Scan Filtering
DDA Search for MS1 Filtering
Parallel Reaction Monitoring (PRM)
Basic Data Independent Acquisition
Analysis of DIA/SWATH Data
Analysis of Q Exactive DIA/SWATH Data
Analysis of TripleTOF DIA/SWATH Data
Analysis of diaPASEF Data
Library-Free DIA/SWATH
Small Molecule Targets
Small Molecule Method Development and CE Optimization
Small Molecule Multidimensional Spectral Libraries
Small Molecule Quantification
Hi-Res Metabolomics
Absolute Quantification
Custom Reports
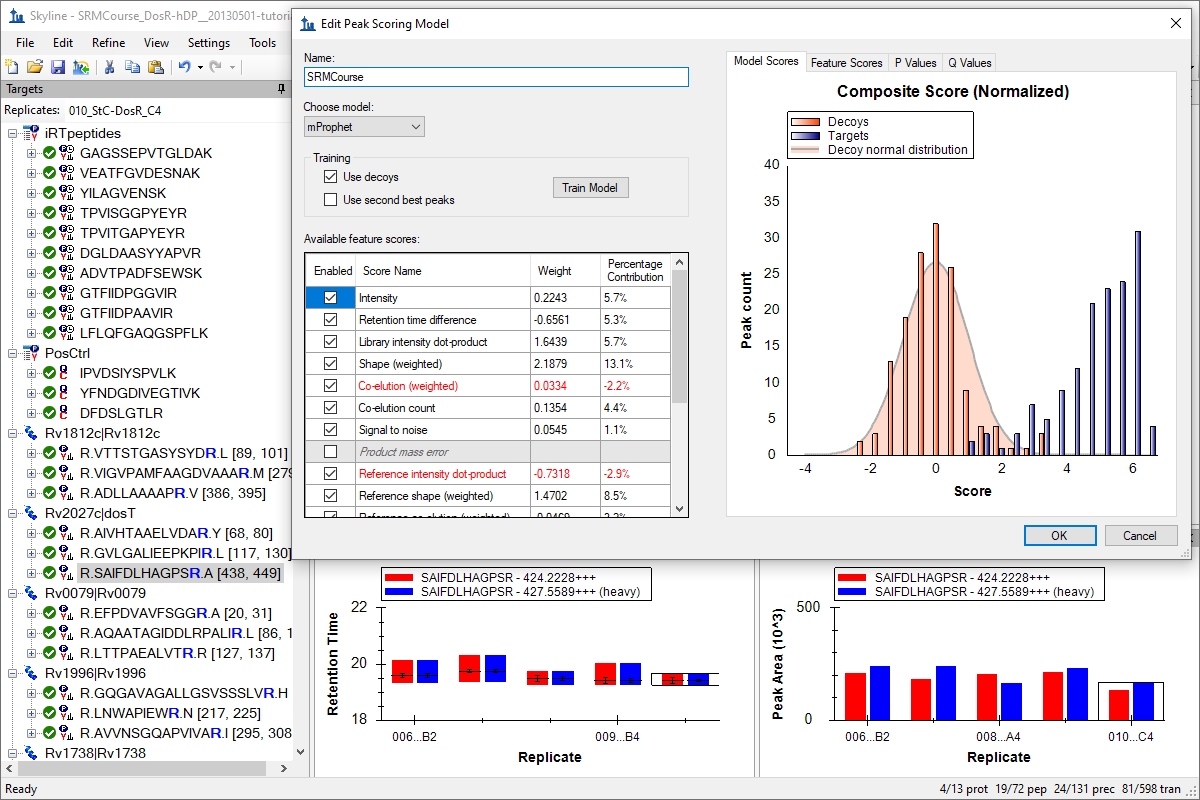
Advanced Peak Picking Models
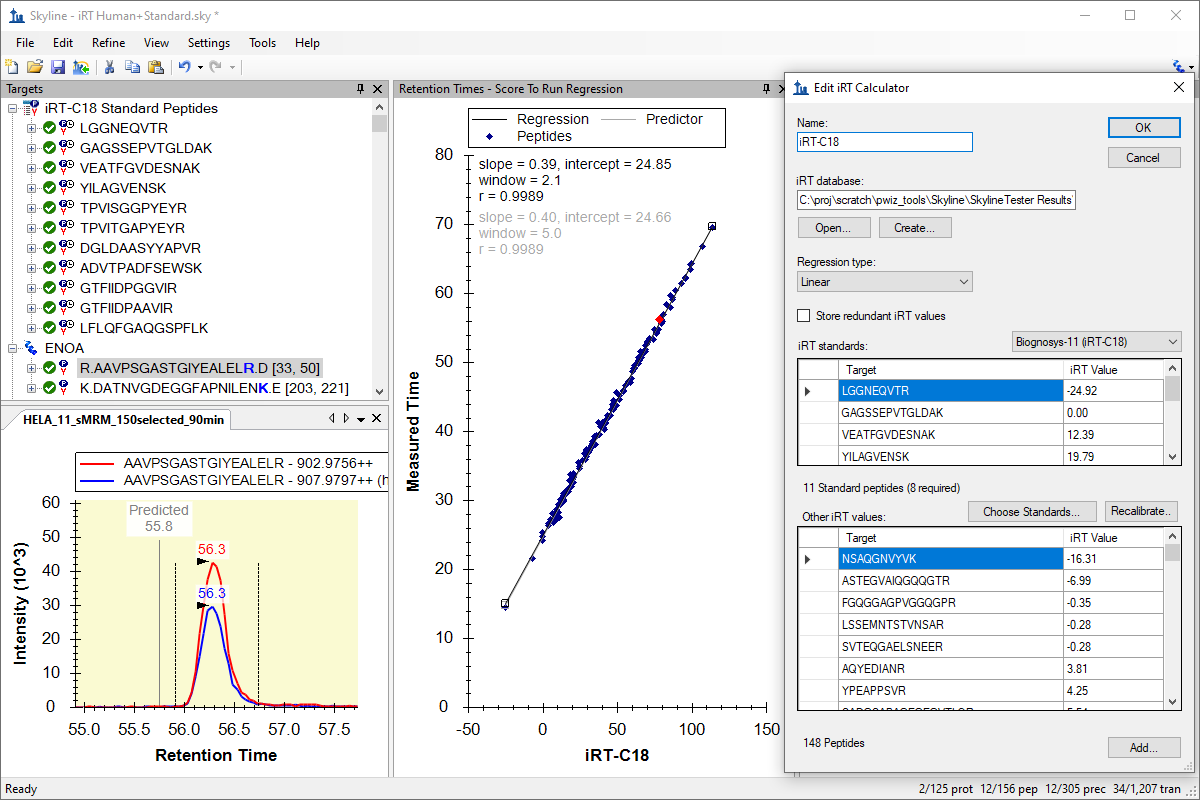
iRT Retention Time Prediction
Collision Energy Optimization
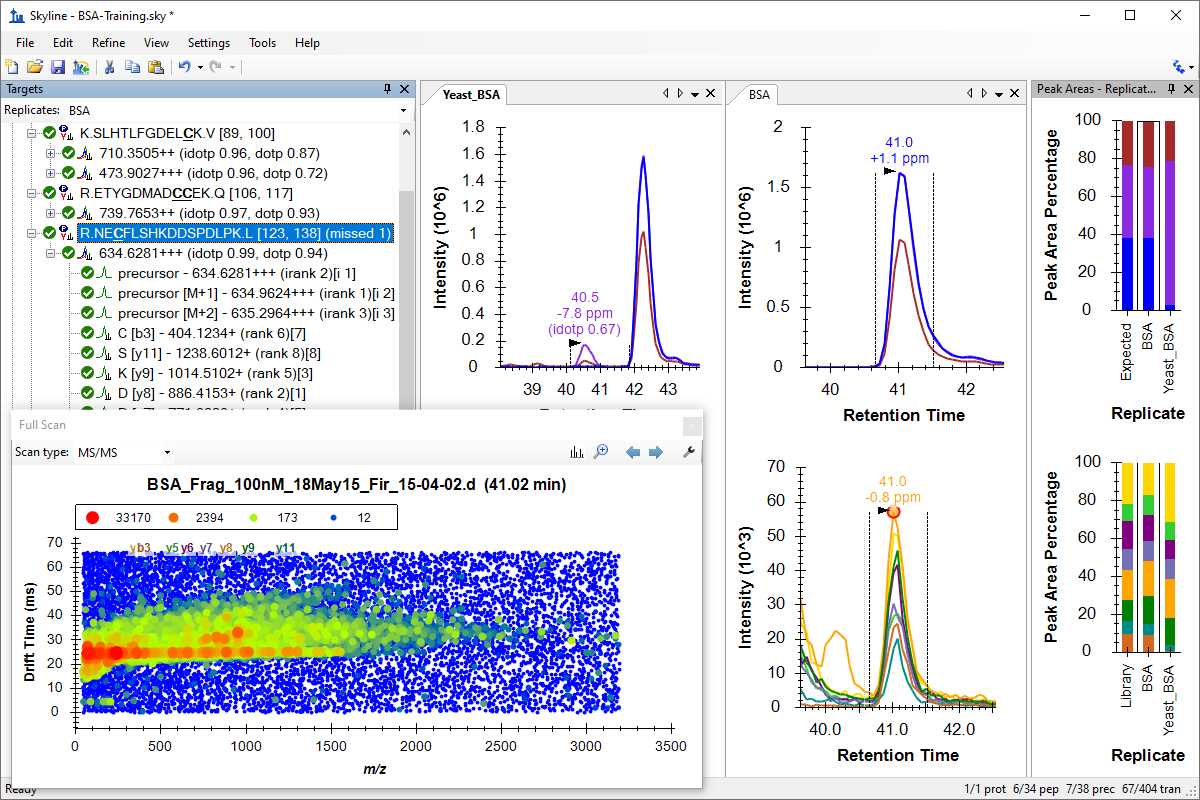
Ion Mobility Spectrum Filtering
Spectral Library Explorer
Audit Logging
ETH Targeted Proteomics Course Tutorials
Videos
Video 1: Method Editing
Video 2: Results Analysis
Video 3: Existing & Quantitative Experiments
Video: Trailer
Webinars
YouTube Channels
Tips
Terminology Cheat Sheet
Installing Skyline
Reverting an Upgrade Installation
Recovering From a Broken Installation
Recovering the .sky File Extension Association
Running Skyline TeamCity Artifact Builds
Small Molecules
Automatic Precursor Isotopes
UI Modes
Adduct Descriptions and Small Molecule Labels
Getting lists of data out of Skyline
Viewing Replicate Pivoted Data as Headers
Pivot Editor
Document Grid Number and Date Formats
Skyline Lists
Result File Rules in Skyline 20.2
Hierarchical Clustering (and PCA Plots) in Skyline-daily
DIA (Data Independent Acquisition)
Generating an Overlapping Window Isolation List using Skyline
Full Spectrum Demultiplexing of Overlapped DIA Windows using MSConvert
Import OpenSWATH Results
Slides Explaining Data Independent Acquisition
DIA Methods for Thermo Q Exactive
Quantification
Normalization Methods
Green, yellow and red symbols next to items in the Targets tree
Batch Calibration
SureQuant and Triggered Acquisition
Surrogate Standards
How Skyline Calculates Peak Areas and Heights
Skyline System Requirements
Parallel Import Performance
Vendor-Specific Instrument Tuning Parameters
Ardia Platform setup and importing a file from Ardia Platform
Support for Bruker TOF Instruments
SCIEX Instrument Settings
Export SRM Methods for a Thermo LTQ
Integration with Other Tools
Build a Carafe Library
How Skyline Builds Spectral Libraries
Build a Koina Library
Build an AlphaPeptDeep Library
ID Annotations Missing with Mascot Search Results
Share Skyline Documents in Manuscripts
Sharing MS/MS Spectra with Manuscripts
Miscellaneous
ExD ion types
Peak Area Dotp Line Plot
Synchronized Integration
Skyline and Java
Skyline Protein Association
Spectrum Filters
EncyclopeDIA Search from Skyline 23.1
Automated labels layout
Carafe Options Help
Peak Imputation in Skyline 25.2
Skyline Batch
Skyline File Types and Extensions
Waters SONAR Calibration
Audit Logging
Crosslinking
New in Skyline 4.1
How to Display Multiple Peptides
Ion Mobility Separation (IMS) Data
Skyline Source Code
How to build Skyline
Documentation
Users Meetings
Publications
ASMS 2012 WOA am MacLean Presentation
ASMS 2020 WOA am MacLean Presentation
Press
Awards
License Agreement
Other
How You Can Help
Get Involved
3rd-Party Software
Related
Funding
Seattle Quant: A Resource for the Skyline Software Ecosystem
Dashboard
Team
Skyline Targeted Mass Spec Environment
 Check out the events page Check out the events page for upcoming training opportunities |
 View the videos from the Skyline User Group Meeting at ASMS View the videos from the Skyline User Group Meeting at ASMSBaltimore, MD - Sunday June 1st, 2025 |
|
Download & Install:Skyline 25.1 - 64 bitSkyline - 32 bit Skyline-daily (beta) External Tools |


Get Started

Join Us
UpcomingSummer The 15th international symposium on proteomics in the life sciences, Cambridge, MA (August 17 - 21, 2025) Summer Skyline Course at the University of Washington, Seattle, WA (July 7 - 11, 2025)
PastSummer Two-day Short Course: 08 Quantitative Proteomics: Case Studies at ASMS Baltimore, MD (May 31 - June 1, 2025) Summer Skyline User Group Meeting at ASMS Baltimore, MD (June 1, 2025) Spring May Institute - Computation and statistics for mass spectrometry and proteomics at Northeastern University in Boston (April 28 - May 11, 2025) Spring 2025 ISAS Dortmund Skyline Training Course (April 7-10, 2025) Fall Practical Course on Targeted Proteomics Barcelona, Spain (November 17-22, 2024) Fall 2024 Skyline Online (October 8-9, 10-11, 15-16, 17-18, 2024) |

Watch Videos
|
 |
|
Recently Published
|
Marsh, Journal of Proteome Research - Skyline Batch: An Intuitive User Interface for Batch Processing with Skyline
Rohde, Bioinformatics - Audit Logs to enforce document integrity in Skyline & Panorama
Adams, Journal of Proteome Research - Skyline for Small Molecules: A Unifying Software Package for Quantitative Metabolomics |

Install 64-bit Skyline 25.1
Thank you for your interest in using Skyline software for your targeted proteomics research or mass spectrometer quality control.
| for 64-bit Windows Install Skyline version 23.1 |
Install 64-bit Skyline 25.1 Unplugged
Welcome to the 64-bit Skyline off-line installation page, the place to download an installer which you can use to install 64-bit Skyline on computers without internet access, such as instrument control computers used for native method export and quality control data assessment. These computers must be running a 64-bit version of Windows.
Please review the license terms and system requirements before installing Skyline. If you accept the terms of the agreement, click I Agree to continue. You must accept the agreement to install Skyline.
To install Skyline without internet access:
- Download the ZIP file from this page.
- Extract its contents.
- Run the setup.exe file in the extracted folder.
- If you are told you need Windows Installer 3.2, you can download it from [here].
- If you are told you need .NET Framework 3.5 SP1, you can download it from [here].
- If you are told you need .NET Framework 4.0, you can download it from [here].
- If you are told you need .NET Framework 4.5.1, you can download it from [here].
- If you are told you need .NET Framework 4.7.2, you can download it from [here].
Remember, without internet access, Skyline will not be able to tell you about new releases and automatically perform updates. You will be responsible for making any necessary updates. You are more likely to fall behind on critical bug fixes and new features. If you have internet access, it is still preferable to use the normal web installation.
Skyline 25.1 Administrator Install
The administrator install of Skyline installs in C:\Program Files. It is used for the rare cases where an administrator needs to install Skyline on a computer that many users have accounts on, and the administrator does not want each user to have to install Skyline themselves.
Known issues:
- Upgrading does not work. If you have an earlier version of the Skyline Administrator install, you must uninstall the previous version. If you do not do this, then the files that get installed in "C:\Program Files\Skyline" will be a nonsensical mixture of files from the two different versions, and nothing will work. You can recognize the Skyline Administrator Install in Control Panel because it looks like "Skyline (64 bit)".
- Only an administrator can install external tools in Skyline
Please review the license terms and system requirements before installing Skyline. If you accept the terms of the agreement, click I Agree to continue. You must accept the agreement to install Skyline.
Install 32-bit Skyline (deprecated)
The 32-bit Skyline has been discontinued since version 20.2, after its overall use had fallen below 1% of all Skyline startups.
Install 64-bit Skyline for higher memory limits. [64-bit]
You can install older versions of 32-bit Skyline unplugged for computers from our archive.
Install 32-bit Skyline Unplugged
The 32-bit Skyline has been discontinued since version 20.2, after its overall use had fallen below 1% of all Skyline startups.
Install 64-bit Skyline for the latest features and higher memory limits. [64-bit]
If you require an older version of 32-bit Skyline, please review the license terms before installing Skyline. If you accept the terms of the agreement, click I Agree to continue. You must accept the agreement to install Skyline.
To install Skyline without internet access:
- Download the ZIP file from this page.
- Extract its contents.
- Run the setup.exe file in the extracted folder.
- If you are told you need Windows Installer 3.2, you can download it from [here].
- If you are told you need .NET Framework 3.5 SP1, you can download it from [here].
- If you are told you need .NET Framework 4.0, you can download it from [here].
- If you are told you need .NET Framework 4.5.1, you can download it from [here].
- If you are told you need .NET Framework 4.7.2, you can download it from [here].
Remember, without internet access, Skyline will not be able to tell you about new releases and automatically perform updates. You will be responsible for making any necessary updates. You are more likely to fall behind on critical bug fixes and new features. If you have internet access, it is still preferable to use the normal web installation.
Release Notes
Skyline v25.1 Released on 5/22/2025
- New! Library building for DIA-NN 2.0.
- New! Added support for the Comet search engine to File > Search.
- New! New look for Pivot Replicate Name reports with a dedicated replicate annotation grid.
- Added a new tutorial "Comparing PRM, DIA, and DDA" base on TUM tutorial and Webinar 25.
- Added a new tutorial "PRM With an Orbitrap Mass Spec" based on PRBB Tutorial 1 and Webinar 17.
- All 25 tutorials have been updated in English, Chinese, Japanese with screenshots and text matching version 25.1.
- Tutorials are now maintained in HTML with new bookmark features and easy printing to PDF format.
- Improved File > Search workflow and UI for DIA with better support for MSFragger without DIA-Umpire deconvolution.
- Added "Advanced Filtering" option to Instrument tab of Instrument Settings to enable specifying global Spectrum Filter that is applied to all extracted chromatograms.
- Added spectrum filter control to Import/Run Peptide Search wizard.
- Added "View > Live Reports" and "View > Libraries" submenus to shorten the menu and put reports closer to the top.
- Added File > Import > Assay Library support for small molecules.
- Added right-click Expand/Collapse menu items to Targets view.
- Added a progress bar to Peak Area Relative Abundance plot.
- Improved dotp support in Koina mirror plots by moving to the properties page and supporting dotp be for annotated peaks only or full spectrum.
- Improved performance of File > Import > Annotations.
- Improved experience of creating an iRT calculator from results in the document.
- Improved log scale in Peak Areas bar graphs so that y-axis range better spans the range of values.
- Improved Import Results Files form restoring UI from last use.
- Improved "Refine > Associate Proteins" to map otherwise unmapped non-tryptic peptides to any proteins which contain peptide sequence as a simple substring.
- Raised peak Truncated threshold from 1% to 25% to reduce the amount Skyline calls peaks "truncated".
- Added Precursor Results "Proportion Truncated" report field as a better metric of overall transition truncation than "Count Truncated".
- Improved File > Import > Results to prompt to save before importing if the .skyd file contains results which are not in the loaded document.
- Improved usability and findability of label click-and-drag to move in Group Comparison Volcano Plot and Relative Abundance Plot.
- Improved Relative Abundance graph formatting.
- Improved performance of File > Search > Feature Detection.
- Updated MSFragger version to 4.1 and Crux version to 4.2.
- Added most advanced MSFragger params to the "Additional Options" dialog.
- Changed Percolator to run on all MSFragger pepXML files together to get experiment-level q-values.
- Added support for multi-peptide lists to Edit > Paste to make this easier to test and make support comparable to --import-pep-list.
- Added prompt to configure Koina before running EncyclopeDIA search.
- Added support for reading ion mobility Collision Cross Section ("CCS") values in .msp files, as keyword "CCS" or "CCS_SqA", e.g. "CCS: 123.45".
- Added support for CID/EAD mode from wiff2 files.
- Added LCPeakIonMetricsMS1 and LCPeakIonMetricsFragment columns to the Precursor Result in the Document Grid. These columns give information about the injection time and total ion current at the apex of and across the LC Peak.
- Added support for Thermo Ardia remote accounts through Open Data Source form.
- Added support for MOBILion data.
- Moved Associate Proteins calculations to background calculation with a progress bar.
- Reduced memory and disk usage structs stored in .skyd files.
- Improved support for metal adducts (for PFAS research) and more complex adducts seen in popular CCS libraries.
- Improved handling of modifications in .msp spectral library files.
- Improved Feature Detection performance by running files in parallel.
- Improved retention time alignment for Feature Detection.
- Improved library export performance for File > Export > Spectral Library and Koina library building.
- Improved unique naming in multiple-molecule (non-peptide) graphs.
- Fixed the Ion Type menu for charged losses common in glycoproteomics.
- Fixed issue where View > Transitions would change to "Total" when Peak Area Relative Abundance plot is shown.
- Fixed File > Export > Method and Transtion/Isolation List for Thermo instruments to include a Compound column.
- Fixed issue where number of peptides could change after doing "Associate Proteins".
- Fixed unexpected error scaling graph labels.
- Fixed File > Import > Peptide Search for DDA to use natural sort on replicate names to match File > Import > Results.
- Fixed File > Import > Peptide Search for DDA to remove fragment transition types and reset MS/MS Acquistion method to "None" if not set to "DDA".
- Fixed "Ion match tolerance" sometimes multiplied or divided by 1000 in Import Peptide Search wizard.
- Fixed unexpected error clicking on a chromatogram point to see its underlying spectrum.
- Improved File > Export > Method for Thermo instruments by collapsing all but old instruments to just “Thermo” and automatically detecting the installed instrument type.
- Fixed Thermo method export for tribrid, Q-Orbitrap, and Astral models.
- Fixed Thermo method and isolation list export to supply Compound names for full-scan instrument types.
- Fixed error handling reading signal chromatograms from Agilent data.
- Updated Shimadzu IOModule to 4.2.0.7552 (fixes support for 8060RX).
- Fixed label clipping in the label layout algorithm for protein abundance and volcano plots.
- Fixed method export for Waters Xevo with mixed polarities and explicit RT windows support.
- Fixed "polarity mismatch" error when searching for nearest precursor m/z match in a mixed polarity document when the m/z is negative and has greater absolute value than any negative precursor m/z.
- Fixed "Max LOQ CV" text box incorrectly disabled when LOD calculation is "Bilinear turning point".
- Fixed out of memory error reading a very large .blib file.
- Fixed performance problem pasting a large number of values into Document Grid in very large document.
- Fixed mirror plots resetting mirror combos with every selection change.
- Fixed Immediate Window to restore disabled cut-copy-paste-delete menu items when losing focus.
- Fixed Immediate Window to set focus to Targets view when Esc is pressed.
- Fixed performance problems on Relative Abundance graph and Peak Areas Replicate comparison in very large documents.
- Fixed library builder for SSL to accept "scan=
" as meaning just . - Fixed unhandled error on Edit Linked Peptides form.
- Fixed handling of empty chromatograms in Waters data.
- Fixed Peak Areas graph rdotp display to show values more often.
- Fixed "Invalid Score Type" sharing minimized library when .blib file came from EncyclopeDIA conversion.
- Fixed "Keep ambiguous matches" not working for .pdResult files.
- Fixed Peptide ID Times > Matching only showing up for first replicate in file.
- Fixed library build with .ssl files to use .raw or .d folders.
- Fixed small molecules with InChi keys to use isotope label information in them when reading transition lists and .msp files.
- Fixed cases where library building from MaxQuant msms.txt files was not properly offering the user ability to choose the embedded spectra, and removed asynchronous library building in Peptide Settings - Libraries tab to be more consistent with the Import Peptide Search wizard.
- Fixed library build with DIA-NN to use File.Name column instead of Run for storing filename to improve source data finding for Panorama Public submissions.
- Fixed rdotp line graph to show when a peptide is selected that has a single light and heavy precursor.
- Fixed performance problem displaying library details for very large EncyclopeDIA .elib files.
- Fixed a problem with reading small molecule transition lists, where precursors with similar m/z but distinct isotope labels were being ignored.
- Fixed recognizing ions with charged losses in Library Match window.
- Fixed slow to display Library Explorer when library has hundreds of thousands of peptides.
- Fixed File > Share - Minimized to export more complete spectral library files.
- Fixed —import-pep-list with —import-search-file to wait until after the spectral library is built to add the peptide list to the document.
- Fixed error using command line to import reports or associate proteins when user settings folder cannot be written to.
- Fixed unescaped ampersands in paths in MS Fragger pepXML output.
- Fixed a case where ambiguity resulted from mass-only molecule with very small differences in iRT library and document.
- Fixed missing optimization steps when Q3 values have been rounded off to 3 decimal places.
- Added support for reading per-precursor and per-molecule notes to transition list import.
- Fixed "bilinear turning point" LOD calculation when LOD is at lowest calibration point.
- Fixed --import-pep-list to turn off auto-manage when any modifications are present.
- Fixed unexpected error in "Apply Peak to All" sometimes.
- Fixed unexpected error loading a spectral library with IMS columns in RefSpectra and none in the RetentionTimes table.
- Fixed Fixed MSFragger search to set default data_type correctly depending on workflow type (PRM data_type=1, DDA data_type=0; and can be overriden in Additional Settings).
- Changed to display "#N/A" for Collision Energy in Document Grid when no collision energy formula provided.
- Fixed incorrect peak areas sometimes when cycle time approaches or exceeds 1000 chromatogram points per minute.
- Fixed small molecule transition list reader to recognize translated versions of "library intensity".
- Fixed "File > Share" to use UTF-8 encoding for extended characters so they are recognized by Panorama.
- Fixed "Auto Zoom > Best Peak" to zoom out to the extracted chromatogram if there is no best peak.
- Fixed error importing zero-length SRM chromatograms when "Explicit Retention Time" has been set.
- Fixed editing a molecule's formula or mass in the Targets tree would not update the m/z values for non-auto-managed precursor transitions.
- Fixed incorrect MS1 chromatograms from some Agilent centroided data.
- Fixed hang hovering over peptide in Targets tree if sequence exceeds thousands of amino acids.
- Fixed "FromClipboard" appearing in HTML copied from Skyline and pasted into GMail.
- Fixed precursor isotopes not deleted when switching to low resolution precursor mass analyzer.
- Fixed precursor isotopes not deleted when switching to low resolution precursor mass analyzer.
- Fixed exporting a scheduled method with only explicit retention times.
- Fixed to gracefully handle network error during chromatogram extraction.
Skyline v24.1 Updated on 2/19/2025
- Finalized Chinese and Japanese translation text.
- Improved Panorama authentication to satisfy future security upgrades to the server.
- Fixed Koina failure after approximately millionth peptide prediction.
- Updated Koina prediction server default URL as requested by the Koina team.
- Updated Start page tutorial URLs to point to fully updated HTML versions.
- Improved support for importing peptide lists with —import-pep-list and File > Import > FASTA.
- Fixed —import-pep-list with —import-search-file to wait until after the spectral library is built to add the peptide list to the document.
- Fixed m/z calculation where the mass of the adduct was not being added to molecules described only as a mass with no chemical formula.
- Fixed failure to save changes in Transition Settings - Filter tab for small molecules to just the fragment adducts field.
- Fixed unhandled error when .blib file has unrecognized score type.
- Fixed unexpected error in "Apply Peak to All" sometimes.
- Fixed Transitions Settings - IonMobility hanging if user tried to "Edit current" when there is no current IMSDB, or crash when user tried to add an IMSDB via "Edit List > Add" instead of just using "Add".
Skyline v24.1 Released on 7/17/2024
- New! File > Search submenu putting all our search pipeline options in a place you can find.
- New! Complete support for FragPipe and DIA-NN integration.
- New! Complete EncyclopeDIA pipeline with narrow and wide window searches and staggered window demultiplexing.
- New! File > Import > Features Detection - MS1 peptide feature finding with Hardklor/Bulseye.
- New! MS/MS spectrum and RT prediction with Koina (Prosit model available).
- New! Peak Areas > Relative Abundance plot.
- Added right-click Auto Arrange Labels option on the Group Comparison
- Volcano and Peak Areas
- Relative Abundance plots for publishable figures.
- Added matching small molecule versions of all standard peptide reports in Document Grid.
- Added gene level parsimony option in protein association dialog.
- Added File > Open from Panorama with anonymous account access to Panorama, e.g. Panorama Public.
- Added "Peptide Spectrum Match Count" to the PeptideResult in the Document Grid.
- Added support for Proteome Discoverer 3.1 in spectral library builder.
- Added modification and special fragment ions for TMTpro.
- Added support for precursor isotopes and reporter ions to transition list import.
- Added support in Spectral Library Explorer for contains search by using preceding asterisk, e.g. *IDE.
- Added tooltips to the Peak Areas - Replicate Comparison plot.
- Added command-line arguments for File > Export > Spectral Library.
- Added command-line arguments for File > Export > mProphet Features.
- Added command-line arguments for peptide digestion settings.
- Added command-line arguments for peptide filter settings.
- Added command-line arguments for File > Export > Annotations.
- Added command-line argument --import-pep-list.
- Added command-line argument --associate-proteins-fasta for associating existing document peptides with a FASTA.
- Added command-line arguments --pep-add-mod*, --pep-clear-mods, and --integrate-all.
- Added command-line argument —pep-add-mod-variable=<true|false> for explicit setting of peptide modifications to “variable” or “fixed”.
- Added command-line arguments to add annotations.
- Added command-line argument --verbose-errors to help troubleshoot unexpected errors.
- Added support for reading chemical formulas with Unicode numeric subscript text.
- Added "Surrogate External Standard" that can be set on Peptides and Molecules in the Document Grid which enable using a different molecule's calibration curve for quantification.
- Added ion mobility columns for library building SSL format.
- Added support for Agilent MassHunter 12 method export.
- Added support for Thermo Astral and Orbitrap GC instruments.
- Added method export support for the Thermo Stellar instrument.
- Added support for SCIEX OS software (exporting acquisition methods and quantitation methods) for QQQ/QTRAP and QTOF platforms.
- Added support to treat WIFF1 and WIFF2 as separate types (e.g. for purposes of import results form)
- Added File > Export > Transition List for Agilent MH 12.1.
- Added Dot Product value to Full-Scan view property grid that compares the spectrum in the plot with the expected distribution.
- Added "Replicate Name" to the things that can be set using Result File Rules.
- Added warning to the immediate window when a CCS<=>IM conversion fails.
- Added warning when adding decoys or training an mProphet model if document uses explicit peak boundaries from spectral libraries.
- Added red text and warning tooltip on Transition Settings
- Full Scan tab if retention time filtering is selected with "PRM" or "SureQuant" acquisition methods.
- Added isotope distribution matching to pick best ion mobility value in ion mobility library "Use Results".
- Added support for MSFragger pepXML/mzML pairs for Bruker timsTOF data with plain integer scan numbers in the spectrumNativeID attribute.
- Update to MassLynxSDK 4.11.0.
- Updated Shimadzu data reader DLLs.
- Updated SCIEX method export DLLs.
- Updated to MSFragger 3.8.
- Updated available modifications to current UniMod, Mascot naming, and ProteinPilot abbreviations.
- Improved peak quality indicators in the Targets view for the colorblind.
- Improved performance of .sky file reading.
- Improved performance of "Aligning Retention Times".
- Improved performance displaying protein tooltips (and Library Match window) when Max Neutral Losses is high.
- Improved CE Optimization method and transition list export for Agilent to stop adding 0.01 to the Q3 m/z values.
- Improved Associate Proteins form to keep unmapped peptides in an "Unmapped Peptides" list, and hide min peptides per protein option when called from the Refine menu.
- Improved sort order for adducts so that molecule precursor ions are ordered by mass, as with peptides.
- Improved "Apply Peak" to work with multiple-selection in the Targets tree.
- Improved Spectral Library Explorer to suggest adding "common" modifications instead of less common modifications when unknown modifications are found in library.
- Improved Spectral Library Explorer for a better experience with larger small molecule libraries.
- Improved error handling when attempting to parse formulas with errors in mass offsets, e.g. "C12H5H3[+3.2/3x3]"
- Improved TMT support by excluding reporter ions when calculating library dot products and detecting peaks.
- Improved tolerance for ion mobility data with bad CCS calibrations.
- Improved error message display interacting with Panorama.
- Improved peptide Unimod modification defaults for "variable" and "fixed" to make only alkylation, isobaric tag labels, and loss-only modifications "fixed" by default.
- Expanded DIA isolation scheme detection to 1000 spectra cycles for gas phase fractionation (GPF) and Astral.
- Reduced the minimum number of values required for a dot product to be calculated from 3 to 2.
- Changed so that the "Do you want to add decoys" message only gets shown for DIA when importing results if the document has at least 20 peptides in it.
- Changed to reset standards in File > New to decrease confusion over documents with unexpected "light" as standard instead of "heavy".
- Changed values such as "Normalized Area", "Calculated Concentration" to have a value even when some peaks are missing or truncated.
- Warning messages are displayed in Document Grid.
- Old behavior is available with "Normalized Area Strict" sub-property in Document Grid.
- Fixed error that sometimes happens choosing "Kernel Density Estimation" on Retention Times run to run regression graph.
- Fixed error that could happen when clicking on an ID line on the chromatogram graph.
- Fixed calculation of bogus isolation window offsets when WIFF2 file returns 0 for lower/upper window bounds.
- Fixed Associate Proteins form to use final document counts for proteins and peptides in the "prot, pep, prec, tran" string (so it includes decoys, iRT, and the unmapped peptide group in the count).
- Fixed MSAmanda to write PeptideEvidence with isDecoy attribute.
- Fixed IdentData mzIdentML parser to be case-insensitive on isDecoy attribute.
- Fixed case where View > Transitions > QC shows blank menu item instead of list of available QC graphs.
- Fixed Import Transition List / Assay Library to allow users to deal with errors after click on OK if errors were previously reviewed.
- Fixed "Chromatogram Information Unavailable" in small molecule document with spectrum filters.
- Fixed centroiding for Waters non-IMS data to be done spectrum by spectrum instead of all at once.
- Fixed repeated neutral loss labels on crosslinked peptide transitions in Library Match view.
- Fixed unexpected error copying and pasting protein groups.
- Fixed unexpected error hovering over Protein in Targets tree if .skyd file cannot be read.
- Fixed incorrect TIC area in documents with QC traces and transition full scan retention time filtering.
- Fixed unexpected error in small molecule transition list reader.
- Fixed edge case in detection of Waters lock mass channel.
- Fixed "times and intensities disagree in point count" error applying a Spectrum Filter to an MS1 Transition.
- Fixed reading compensation voltage values from mzML files.
- Fixed unexpected error extracting chromatograms from raw file when there are pressure traces but no MS1 spectra.
- Fixed command-line output of transition full-scan settings changes.
- Fixed unexpected error attempting to modify base molecule in targets tree with an invalid chemical formula.
- Fixed WIFF SIM/SRM chromatogram extraction to operate on the entire time range instead of within the scheduled limits.
- Works around a bug(?) with Sciex WIFF where it records the wrong scheduled limits but the data is there if you tell it to ignore the limits.
- Fixed Bruker TSF reader crashing when enumerating chromatograms when the file has empty spectra.
- Fixed library build from pepXML to check for spectrum files in the base_name's parent path (if present).
- Fixed small molecule chromatogram extraction to limit time range based on retention time prediction.
- Fixed to update Document Grid when annotations are removed from the document.
- Fixed DIA-NN speclib N-terminus mods to be moved/merged to the N-terminal AA.
- Fixed spurious Skyline Batch error about empty directory when directory contained .d folders.
- Fixed error displaying dot product line on Peak Area Replicate Comparison graph when currently selected peptide has no transitions of the type (precursor or product).
- Changed to display a warning message in the Immediate Window when Skyline discards chromatograms because the Explicit Retention Time is outside the retention time range over which the chromatogram was extracted.
- Fixed BiblioSpec to use the spectrumNativeID attribute in pepXML when reading MSFragger pepXML.
- Fixed unexpected error ("Attempt to add integration information for missing file") when doing a rescore with multiple injections if it fails because of missing iRT standards.
- Fixed transitions getting incorrectly added/removed from siblings when changing children of a precursor with a Spectrum Filter.
- Fixed unexpected error in Edit Spectrum Filter form.
- Fixed unexpected error when selected QC trace is not present in a particular replicate.
- Fixed truncation of report text copied to the clipboard when report columns include "CleavageAa".
- Fixed command-line arguments --tran-product-*-special-ion not being processed if they are the only filter arguments passed.
- Fixed Skyline detection of Waters RAW folders to be case-insensitive.
- Fixed error that could happen if DIA-NN chosen peak was outside of extracted chromatogram range.
- Fixed unexpected error in Retention Times Replicate Comparison graph when aligning retention times and there are missing results.
- Fixed unexpected error in the Detections plot.
- Fixed unexpected error importing peak boundaries with malformed peptide modification.
- Fixed unexpected error when spectrum from an extracted chromatogram cannot be found in the raw file.
- Fixed incorrect isotope dot product for newly imported small molecule precursor transition.
- Fixed MS1 chromatogram extraction when doing PRM CE Optimization.
- Fixed adducts like [M+H-H2O] on molecules described as mass-only.
- Fixed unexpected error in Peak Areas > Replicate Comparison graph when a peptide has missing results for one replicate.
- Fixed unexpected error bringing up Full-Scan spectrum view on some datasets.
- Fixed unexpected error displaying TIC chromatogram when not available in some datasets.
- Fixed parsing spectrum IDs from MSFragger pepXML files with MGF spectrum files.
- Fixed unresponsive long wait when doing "Equalize Medians" in huge documents.
- Fixed unexpected error using "Apply Peak to All" when one replicate has missing chromatograms.
- Fixed unexpected error importing a small molecule transition list.
- Fixed unexpected error after Modify Molecule form to change charge state in a way that makes no sense with the current adduct.
- Fixed unexpected error after Modify Transition form to change the precursor adduct in a way that makes no sense with parent molecule, or vice versa.
- Fixed unexpected error exporting a report definition to a .skyr file that cannot be written to.
- Fixed to output a warning message to the Immediate Window if a single transition's chromatogram is being discarded because of the Explicit Retention Time.
- Fixed unexpected error using "Edit Modifications" form.
- Fixed volcano plot formatting when Match Expression includes both fold change and p-value.
- Fixed loss annotations in MS/MS spectra to work for mass-only losses.
- Fixed unexpected error in Spectral Library Explorer when amino acid 'J' had a modification on it.
- Fixed unexpected error showing Detections graph when document has no results.
- Fixed preventing multiple spectrum filters from being added to heavy precursor.
- Fixed optimization step incorrect for some Agilent collision optimization data.
- Fixed "Matrix must be positive definite" error that sometimes happened with bilinear fit calibration curves.
- Fixed handling explicit adduct charge declarations (e.g. the trailing "+" in "[M+2CH3+Cl]+").
- Fixed Panorama error "Documents with same GUID should have same first audit log entry" when audit log restarted.
- Fixed unexpected error showing full scan graph when transitions differ only be neutral loss.
- Fixed unexpected error doing "Apply Peak to All" when retention times have been aligned.
- Fixed unexpected error searching for missing peak scores when peptide is missing results for one replicate.
- Fixed chromatogram weirdness when renamed molecule used to have the same name as another molecule in the document.
- Fixed disk error that would sometimes happen at end of chromatogram extraction.
- Fixed Edit > Find (Ctrl-F) form to set focus to the text box for immediate typing.
- Fixed several command-line operations that were not being recorded in the Audit Log.
- Including "--import-annotations", "--import-peak-boundaries", "--reintegrate", "--add-decoys", and "--import-file".
- Fixed graphs sometimes blank when displaying more than 100 precursors at the same time.
- Fixed error adding decoys to a document with high resolution MS1 and sulfur containing amino acids.
- Fixed exporting negative RT values in Agilent instrument methods.
- Fixed using too much memory outputting report with "Normalized Area" column when document has Peptide Quantification regression method set to something other than "None".
- Fixed reading CE from WIFF file spectra.
- Fixed search errors from Search control to be more specific.
- Fixed ion mobility values from spectral libraries (with no .imsdb file) not appearing in reports.
- Fixed to gracefully handle network error during chromatogram loading.
- Fixed potential hang extracting chromatograms when some protein groups have proteins with nonstandard accession numbers.
Skyline v23.1 Updated on 4/1/2024
- Updated code signing certificate to one that expires in 2027.
Skyline v23.1 Updated on 1/15/2024
- Finalized Chinese and Japanese translation text.
- Fixed File > Export > Method for Waters TQ instruments.
- Fixed removal of useful reports in small molecule mode "Molecule RT Results" and "Molecule Transition Results".
- Fixed error extracting chromatograms from raw file when there are pressure traces but no MS1 spectra.
- Fixed incorrect TIC area in documents with QC traces and Transition Settings - Full-Scan retention time filtering.
Skyline v23.1 Released on 9/24/2023
- New! EncyclopeDIA search support in File > Import > Peptide Search for DIA data.
- New! Spectrum filters for extracting separate chromatograms for precursors handled differently in the mass spec e.g. different detectors or fragmentation methods.
- New! Parameter (CE) optimization for TOF and Orbitrap instruments.
- Added spectrum properties to Library Match view.
- Added spectrum properties in the Full-Scan graph.
- Added annotations for "Special Ions" (e.g. TMT) in MS/MS graphs.
- Added library ion match tolerance unit setting in the transition settings to support PPM values.
- Added "ChromatogramStartTime" and "ChromatogramEndTime" to Transition Result Chromatogram in Document Grid.
- Added Skewness, Kurtosis, Standard Deviation, and Shape Similarity Score to Transition Results in Document Grid.
- Added new command-line arguments for building ion mobility libraries: --ionmobility-create-library and --ionmobility-create-library-name
- Bruker PaSER support improvements:
- Recognize "PrecursorIonMobility" as a synonym for "1/K0".
- Store ion mobility values from File > Import > Assay library in the .blib file.
- Added library build support for Bruker Paser results and library.
- Added library build support for crosslinked peptide sequences in .ssl files.
- Added library build support for PeptideProphet .proxl.xml files.
- Added library build support for MeroX proxl.xml files and cleavable crosslinks.
- Added support for putting results files in File > Share .sky.zip.
- Added support for showing a library match spectrum with multiple precursors selected.
- Added tooltips on Libraries and Modifications lists in Peptide Settings dialog.
- Added more choices when defining Group Comparisons.
- Added support for Agilent DAD spectra and UIB chromatograms.
- Added log output of the count of BiblioSpec PSMs that do not pass the score filter and improved error message when score filter is the cause of no PSMs being added.
- Added support for File > Export > Method for Thermo Fusion Lumos and Eclipse.
- Added support for File > Export > Method for SCIEX 7600.
- Added pressure trace support for Thermo files.
- Added an error in library builder when SSL peptide sequence has non-uppercase letters or unsupported modification formats.
- Enabled setting the Standard Type of a peptide using "--import-annotations" command line argument
- Added "Skyline 22.2" to the list of available formats in the "File > Share" dialog.
- Added support for Proxl XML files from pLink.
- Added a button to the toolbar in the View > Spectral Libraries form to show extended properties of the spectrum shown in the graph.
- Added a button to the toolbar at top of Report Editor to toggle whether properties are sorted alphabetically.
- Changed the find box on the Document Grid to start out case insensitive.
- Changed right-click > Replicates > Best in the Targets view from being remembered between runs because it can be confusing.
- Improved display display performance of Edit Modifications form.
- Improved support for EncyclopeDIA .elib spectral library files.
- Improved handling of small molecule transition lists where document settings can help with precursor isotopes.
- Improved handling of .skyp files downloaded from Panorama to show progress and request log-in information.
- Improved error handling when downloading MSGF+ fails.
- Improved importing .MSP library files for GCMS use.
- Improved default size of Audit Log, PCA Plot and HeatMap when they are first shown.
- Improved support for interactive tools:
- Added tool service method "ImportPeakBoundaries".
- Improved performance of tool service method "DeleteElements".
- Improved error reporting when communicating with Panorama.
- Improved error reporting when unzipping an external tool.
- Improved temp file cleanup and testing when running peptide search tools.
- Improved error handling when parsing FASTA in Associate Proteins form.
- Improved score information on Library Details form in View > Spectral Libraries.
- Improved detection of lockmass function in Waters .raw files.
- Updated to Bruker TDF-SDK v2.21.
- Added Bruker TSF format support.
- Update WIFF2 SDK to support all instruments.
- Updated handling of Waters DDA data.
- Updated Mascot Parser to 2.8.1 for parsing Mascot DAT files to build spectral libraries.
- Increased limit on number of spectra that could be in a spectral library from 16 million to more than 100 million.
- Fixed View > Transitions > QC showing blank menu item instead of the list of available QC graphs.
- Fixed an unexpected error importing a small molecule transition list lacking anything like a "name" column.
- Fixed library details for EncyclopeDIA .elib files.
- Fixed MSFragger DDA search handle DDA PASEF data correctly.
- Fixed errors caused by assuming lockmass function is not IMS: Invalid Scan Number exceptions.
- Fixed "Order By" menu item disappearing when grouping peak area graph on a replicate annotation which no longer exists.
- Fixed to allow changing score threshold when building library from Waters MSe final_fragment.csv files.
- Fixed bug where half of all transitions in certain .elib files would be marked as non-quantitative.
- Fixed blank panes in peak area peptide comparison when "Transitions > Split Graph" and "Scope > Protein" and selected protein has fewer label types than document.
- Fixed library builder to read MaxQuant msms.txt files with UTF-8 byte order mark.
- Fixed error when crosslinked peptides has heavy atoms.
- Fixed PDF URLs in Start Page to tutorials updated for 22.2.
- Fixed a number of proteomics features still showing up in small molecule UI mode.
- Fixed CCS values to be recalculated as needed in chromatogram extractions for consistency in reports.
- Fixed the Ion Mobility Library Editor to show friendly molecule names in (e.g. "Sulfamethizole" rather than "#$#Sulfamethizole$C9H10N4O2S2$")
- Fixed Ion Mobility Library Editor to avoid absurd high energy offset values from "Find Results"
- Fixed an unexpected error in peptide transition list import.
- Fixed several cases where Skyline could produce a saved file that it could not open.
- Fixed error when crosslinker attaches to invalid amino acid position.
- Fixed calculation of m/z of cleavable crosslink fragments.
- Fixed library build to read ion mobility vendor files in combined spectra form (addresses library build taking forever to try to read MSAmanda searches direct from ddaPASEF .d).
- Fixed to preserve all decimal places of predicted retention times.
- Fixed error doing "Save As" on document with very large .skyd file after removing a replicate.
- Fixed error if SRM chromatogram has zero points in it.
- Fixed hard crash when reading corrupt SQLite file in Bruker data.
- Fixed issue where protein descriptions assigned by "Associate Proteins" would disappear when the document was saved and reloaded.
- Fixed library builder reading newer MSFragger output from timsTOF.
- Fixed MSFragger searches with C-terminal mods giving error "'c' is not an amino acid".
- Fixed a logic flaw where Agilent GC-TOF EI data was mistaken for non-GC all ions data.
- Fixed error clicking on transition with missing chromatogram when viewing single transition chromatogram.
- Fixed converting Shimadzu DDA precursor m/z values from integers; 1e9 instead of 1e5.
- Fixed audit logging for Import Peptide Search to stop logging a global cut-off score when the threshold is specified per file.
- Fixed display of dockable window drop target when dropping near right edge of Skyline window.
- Fixed location of dockable window drop targets when multiple screens have different screen resolution.
- Fixed issue where changes to column values such as "Protein Note" made in the Fold Change grid seemed to disappear immediately.
- Fixed cases where fold change value is NaN if measured peak area is zero.
- Fixed unexpected error right-clicking in Library Match window.
- Fixed unexpected error for protein group metadata during saving.
- Fixed applying Result File Rules when importing results using the command line.
- Fixed Chinese translation of "irank".
- Fixed downloading MSGF+ Java virtual machine.
- Fixed ion type menus in View > Spectral Libraries, Spectrum Match view, and Full-Scan view.
- Fixed an unexpected error that could happen in Import Transition List if .skyd file is modified.
- Fixed the way that the background level under the peak is shaded when TransformChrom is something other than Interpolated.
- Fixed issue where document could not be loaded if a crosslinked peptide was added from the spectral library viewer but the crosslink modification did not have a checkmark next to it in peptide modifications settings.
- Fixed behavior of missing peaks for spectral libraries with peak boundaries (e.g. DIA-NN, EncyclopeDIA, OpenSWATH).
- Fixed error handling in grids appearing in Settings forms.
- Fixed unexpected error on MIDAS library load failure.
- Fixed MIDAS library support in View > Spectral Libraries.
- Fixed unexpected error in spectrum Full-Scan view.
- Fixed handling chemical formulas with zero-count declared atoms.
- Fixed issues with DIA-NN speclib parsing in library builder.
- Fixed Spectral Library Explorer source files view to more consistently report statistics.
- Fixed handling of user editing a molecule in ways that make no sense with child precursor adducts.
- Fixed issue with mirror spectrum between multiple libraries in Library Match view.
- Fixed issue where "--report-add" commandline argument would cause all reports from "External Tools" group to be copied to the "Main" group.
- Fixed chromatogram extraction with ion mobility filtering to use high energy IM offset values for all MS/MS acquisition modes rather than only "All Ions".
- Fixed issue where Library Match graph disappears if spectrum being displayed has no intensities that are greater than zero.
- Fixed unexpected error using Prosit when precursor charge was greater than 6.
- Fixed assay library importing to handle unsorted transition lists.
- Fixed toolbar buttons and right-click menu in View > Spetral Libraries broken adding property page.
- Fixed very large (e.g. 6 million lines) Assay Library import.
- Fixed out-of-memory error.
- Fixed performance bottleneck introduced in checking for lines with irregulate column counts before starting to import.
- Fixed requiring large recalculation when "Check For Errors" was already clicked.
- Fixed "The document specific spectral library does not have valid retention times" when importing peptide search existing EncyclopeDIA 2.0 library.
- Fixed a problem with Agilent IMS data where fringe CCS and/or DT values cannot roundtrip through the CCS/DT conversion.
- Fixed a case where saving document after removing modification with neutral losses from settings results in a document which cannot be opened.
- Fixed a case where ion mobility library entries for crosslinked peptides would be duplicated each time you pressed the "Use Results" button .
- Fixed peptide losses with multiple charge states not all appearing in the transition options.
- Fixed peptide charged losses changing to small molecule adducts line [M+H].
- Fixed Result File Rule Set Editor to allow using newly added annotations without having to first OK the Document Settings dialog.
- Fixed Document Grid (and other data grids) so that custom formats are applied when doing "Copy All" or "Export".
- Fixed unexpected error changing annotation value in document grid when the document had been changed.
- Fixed issue where removing an explicit modification from a document with decoys could result in a document that could no longer be opened.
- Fixed exporting Waters methods containing compounds with multiple modifications and more than 5 transitions.
- Fixed behavior where graphs would appear blank if the Legend took up all of the space in the graph.
- Fixed several issues with Bruker data:
- Fixed timsTOF instrument type not being recorded in instrumentConfiguration.
- Fixed negative CE in negative polarity Bruker data not being reported.
Skyline v22.2 Updated on 12/19/2022
- Finalized Japanese translation text.
- Fixed downloading MSGF+ Java virtual machine.
Skyline v22.2 Updated on 11/9/2022
- Finalized Chinese translation text.
- Fixed an unexpected error with mirror spectrum in the Library Match view.
- Fixed issues with library building for DIA-NN .speclib files where not all runs were included.
- Fixed synchronized integration with missing or removed peaks not working.
- Fixed performance problem with manually integrated peaks with many transitions.
- Fixed checking for Bruker timsTOF ion mobility issues before showing method scheduling graph.
- Fixed an unexpected error getting metadata for protein groups.
- Fixed NaN's that appear in fold change values in PRM Orbitrap tutorial using Tukey's Median Polish.
- Fixed dotp highlighting (red dots) in Peak Areas - Replicate Comparison plots to appear in front of peak area bars.
- Fixed admin installer for SCIEX OS method export.
Skyline v22.2 Released on 9/12/2022
- New! Protein grouping - through File > Import > Peptide Search and Refine > Associate Proteins.
- New! Library build interface that shows filter cut-offs in a grid, one per file with score type and appropriate scale, i.e. 0.01 for q values.
- Improved DDA MS/MS peak integration to not use background subtraction, proven to work better for producing high dotp values.
- Improved peak picking with DDA acquisition method to use "dotp" score when it is above 0.75, likely from a high-quality MS/MS acquired within or near the MS1 peak.
- Added support for ignoring SIM spectra (commonly used by Thermo as a diagnostic) in MS1 chromatogram extraction.
- Added support for z+1 and z+2 ions for EAD/ETD MS/MS fragmentation.
- Peak Areas plot r/i/dotp line graph support made the default, with customizable cut-off highlighting.
- Added Candidate Peaks view - for new visibility into how Skyline scores and chooses among peaks.
- Added small molecule support to File > Import > Peak Boundaries.
- Recognizes a "molecule" or "molecule name" column - analogous to the existing "peptide" column for proteomics documents
- Added a new standard report "Small Molecule Peak Boundaries" for exporting peak boundaries for small molecule documents.
- Added "--import-peak-boundaries" command-line argument.
- Added File > Export > Isolation List support for Bruker timsTOF.
- Added support for redundant iRT databases.
- Added an option to minimize libraries included with a Skyline document uploaded to Panorama.
- Added a context menu option to show collision energy in Full-Scan graph.
- Added method export support for SCIEX 7500.
- Added “natural sort” algorithm to the file explorer and document grid.
- Support for Ion mobility values added for peptide-oriented transition list and assay library imports.
- Improved default peak scoring model training to allow features that have some unknown score values to be used.
- Improved error reporting when importing small molecule transition lists.
- Improved keyboard support for undo (Ctrl-Z) and redo (Ctrl-Y) and fill-down (Ctrl-D) within a floating Document Grid.
- Improved UI of new Edit > Insert > Transition List form with bigger text instruction in the middle of the form.
- Improved error handling for exporting SCIEX method.
- Improved memory consumption in Document Grid when a large amount of Peptide Normalized Area values are being calculated.
- Improved spectrum annotation to allow show/hide of neutral losses.
- Added "[M+]" and "[M-]" to the cascading dropdown control for composing ion formulas in the "Modify..." right-click menu item in the Targets tree for small molecules. These were already available for fragment ions but they are also useful for precursors.
- Added support for heavy copper (Cu' in Skyline formula syntax, Cu65 in adduct syntax)
- Made peptide transition list import "Associate Proteins" option enabled by default when a background proteome is available.
- Fixed the Administrator Installer to avoid causing Windows to show a warning before running it.
- Fixed "Array dimensions exceeded support range" error that can happen when extracting chromatograms from a file with no MS1 spectra.
- Fixed error opening a new Skyline document while there was an uncommitted change in a text box in the Document Grid.
- Fixed unexpected error updating an external tool.
- Fixed reading mzXML from mzML parentFile.
- Fixed mzXML parser to treat invalid scanType attributes (e.g. "CID") as full scan MS1/MSn with a warning.
- Fixed library builder pepXML reader to skip non-AA characters in the unmodified peptide sequence.
- Fixed sticky Y axis in the Full-Scan view.
- Fixed mode-specific (proteomics vs. molecule) reports to show/hide based on the mode and added molecule-specific reports for quantification.
- Fixed some inconsistent handling of attempts to add an empty transition list.
- Fixed a problem with reading transition lists defined by m/z only, and with implied isotope labels.
- Sped up generating the list of peptides with missing values from the edit peak scoring form.
- Fixed chromatogram display when optimization data is asymmetric as when CE values go to zero and below.
- Fixed FASTA parser unexpected error when faced with unusual header lines.
- Fixed NullReferenceException that can happen when extracting chromatograms and predicted retention times are outside of range of spectra.
- Fixed problem where, when doing "File > Share > Minimal", peptides in the document which had modifications would not end up in the minimized iRT database.
- Fixed the display of peak boundaries on the chromatogram graph when all transitions shown are non-quantitative as in DDA.
- Fixed inappropriate use of MS/MS in peak picking scores for DDA acquisition method.
- Fixed unexpected error in Library Match view.
- Fixed unexpected error that can happen showing the PCA plot if the dataset has only one numeric column.
- Fixed unexpected error doing "Apply Peak" when one result file in a replicate was missing results.
- Fixed unexpected error using too long of a path when doing "Save As".
- Fixed Divide by Zero error minimizing a document that has replicates but no chromatograms.
- Fixed error in full scan spectrum viewer that could happen if you rapidly click multiple times on the chromatogram graph.
- Fixed TIC for WIFF files.
- Fixed SkylineDailyRunner.exe to work with Windows user names that contain ampersand (&) or caret (^).
- Fixed synchronized integration behavior when acting on a chromatogram not selected for synchronization.
- Fixed error trying to use small molecule spectral library which did not contain chemical formulas.
- Fixed localization of "Ratio to Global Standards" etc. label on the Y-axis of peak area graph.
- Fixed issues building spectral libraries from Proteome Discoverer files.
- Fixed error that could happen if a particular precursor did not have any results.
- Fixed issue determining score type for .mzid files.
- Fixed error that can happen in small molecule documents if you remove an isotope label type that is still being used by some of the precursors in the document.
- Fixed a problem with Fixed Width ion mobility window value not saving properly when changed in Settings>Transition Settings>Ion Mobility.
- Fixed error displaying multiple peptide chromatogram graph if any of the chosen peaks has a start retention time equal to zero.
- Fixed to not calculate Protein Abundance on the decoy peptide list since it is sometimes very slow.
- Fixed problem with downloading tools that have invalid URL characters in their identifiers.
- Fixed unhandled error when inserting crosslinked peptide sequence which specified "0" as amino acid position.
- Fixed unhandled error inserting crosslinked peptide whose precursor m/z was very close to Instrument Max Mz setting.
- Fixed problem where opening a document with a background proteome and a peptide uniqueness constraint sometimes results in all peptides being removed from document.
- Fixed ion mobility libraries for crosslinked peptides.
- Fixed problem where Skyline would allow transitions which contained multiple crosslink fragment ions which were not actually attached to each other.
- Fixed log scale y-axis label not showing median normalization when appropriate.
- Fixed audit logging in Import Peptide Search wizard when an existing library is used.
- Fixed case where Full-Scan settings impacted peak picking in SRM data.
- Fixed incorrect display of median and TIC normalized values in Peak Area graph.
- Fixed incorrect calculation of median and TIC normalized areas and group comparisons in some replicates.
- Fixed problem where Protein Abundance could not be displayed in a report unless the report also included columns from Peptides.
- Added new document grid columns "Median Peak Area" and "Normalization Divisor" in order to make it easier to see how Skyline calculates normalized areas.
- Fixed calculating of Median Peak Area in the presence of reference standard peptides so that it uses only internal standard label type peak areas.
- Fixed spectrum from incorrect file from EncyclopeDIA library displayed in Library Match window.
- Fixed unhandled error when trying to paste into the Document Grid when it is empty.
- Fixed mass error sometimes reported as zero when "Triggered chromatogram acquisition" was checked.
- Fixed DIA-Umpire on spectra that aren't sorted by m/z (e.g. from scanSumming timsTOF data)
- Fixed a problem with FAIMS on MS2 data in Thermo SureQuant, resulting in jagged chromatograms.
- Fixed support for building spectral libraries from ProxlXML files from Byonic (converted from mzIdentML).
- Fixed unexpected error when exporting Bruker timsTOF methods with ion mobilities outside template range.
Skyline v21.2 Updated on 7/20/2022
- Fixed scheduling graphs showing concurrent precursors when labeled concurrent transitions.
- Fixed an unexpected error parsing unrecognized FASTA header lines.
- Fixed communication with UniProt for protein metadata.
- Fixed small molecule transition list import to issue a warning in some cases where it caused unexpected errors.
Skyline v21.2 Updated on 6/22/2022
- Fixed downloading MS Fragger due to a recent change to the release website.
- Fixed error about missing "OFX.Core.Contracts.dll" when importing SCIEX 6500 QQQ wiff file.
- Fixed problem where if the Targets tree was not supposed to be showing ratios, it would display raw peak areas followed by the word "ratio".
Skyline v21.2 Updated on 3/1/2022
- Finalized Chinese and Japanese translation text
- Fixed chromatogram display when optimization data is asymmetric as when CE values go to zero and below.
- Fixed peptide settings to update normalization methods based on changes to heavy modifications.
- Fixed ratios displayed in the Targets view.
- Fixed Edit > Insert > Transition List character limit on pasted clipboard text.
- Fixed library reading getting handled as unexpected errors rather than reporting them directly with a message.
- Fixed a problem reading a transition list where, for example, C2H6N[M+H] and C2H6N[M2C13-H] were incorrectly treated as an m/z ambiguity.
- Fixed a problem reading small molecule transition lists with isotope labels declared in precursor and fragment formulas with integer-only charge declarations.
- Fixed a problem with reading transition lists defined by m/z only, and with implied isotope labels.
- Fixed a problem handling transition lists with missing product m/z information.
- Fixed a problem importing transition lists with an inconsistent number of fields per line.
- Fixed Sciex method export issue and improved error reporting.
- Fixed error that can happen moving the mouse across volcano plot after volcano plot has been docked and undocked several times.
Skyline v21.2 Released on 1/4/2022
- New! Added support for DDA searches with MS Fragger and MSGF+, now options in the Import Peptide Search wizard.
- See the DDA Search tutorial for more information on integrated DDA searches in Skyline.
- New! Synchronized Integration (right-click in a chromatogram graph)
- New! Improved SureQuant support with "SureQuant" MS/MS acquisition method and method export for Exploris.
- Also added new PRM acquisition method (an improvement over the old "Targeted" method – now deprecated).
- Prompt to create decoys for DIA data and when decoys are present auto-train a default model to add q values and z scores.
- Improved memory use for large-scale DIA to use less than half the memory in most cases.
- Improved DIA-Umpire performance in Skyline.
- Added support for transition list import with column selection form for small molecules.
- Improved transition list column selection form to support Associate Proteins.
- Replaced Edit > Insert > Transition List with for pasting text followed by the transition list column selection form to be consistent with direct pasting and File > Import Transition List.
- Line graph representation of dotp/idotp/rdotp in the Peak Areas > Replicate Comparison plot - using right-click menu.
- Changed rdotp calculation to be consistent with dotp and idotp - using spectrum contrast angle.
- This will tend to reduce rdotp values slightly if comparing rdotp values after this change with those before it.
- Added RT annotation display digits on the chromatogram graph right-click > Properties form.
- Improve library building error message for unrecognized modifications in PLGS outputs to include the ones we will recognize.
- Improved layout of Import Peptide Search wizard forms when ion mobility values are present, e.g. diaPASEF
- Improved Export > Spectral Library to use best score instead of first and include z-score.
- Improved library building support for MSFragger.
- Improved performance importing large .MSP spectral library files.
- Added ability to switch between centroided and profile spectra in Full-Scan view.
- Added mass error annotation display to Full-Scan and Spectrum Match views.
- Added rdotp annotation in Peak Areas > Replicate Comparison view when showing ratios.
- Added new filter categories to the Spectral Library Explorer, especially helpful for small molecules.
- Added support for reading from vendor formats when library build searches for spectra for pepXML ids.
- Switched to using peptide level q values in pdResult files and special handling for 1% and 5% FDR cutoffs to be more consistent with Spectronaut library builds.
- Added support for previously unseen "VIP_HESI" ion source in Bruker TIMS data.
- Added support for the latest chromatogram library export from Panorama, including new support for ion mobility and small molecules.
- Improved menu options for MS/MS annotations in the Full-Scan view.
- Skyline no longer requires .NET 3.5.
- Only write top-ranked transitions when exporting any CoV optimization method
- Added a warning when exporting a prmPASEF method for timsTOF with wrong CE setting.
- Export polarity column for Thermo Fusion when Tune v3 is checked.
- Enabled writing CoV values for Thermo Fusion.
- Improved support for Waters SONAR data.
- Updated SCIEX interop DLLs for method export.
- Update Shimadzu DLLs for method export.
- Added support for Agilent/Mobilion SLIM data.
- Added LC/QC chromatograms for Agilent data.
- Added tooltips on feature names in mProphet model form.
- Fixed peak scoring for documents using DDA acquisition method in Transition Settings - Full-Scan tab for MS/MS filtering.
- Fixed Skyline to report AA positions in proteins starting at 1 instead of zero.
- Added the columns "First Position" and "Last Position" to the document grid which show the 1-based amino acid position of the peptide in the protein.
- Changed the numbers that are displayed in the Targets tree so that they are 1-based instead of 0-based.
- Columns "Begin Pos" and "End Pos" are now marked "Obsolete", which means that they only show up in the Report Editor if you push the "show all columns" button.
- Fixed problem where peaks with integration boundaries that were chosen by the user did not get their areas recalculated when you do a reimport.
- Fixed handling all-ions DIA for Bruker timsTOF bbCID.
- Fixed a problem reading Bruker files with multiple TIMS calibrations.
- Fixed library building from DIA-NN speclib to support version 3, and added support for reading scores and ion mobilities.
- Fixed peptide-specific settings showing up in the Transition Settings - Library tab when in small molecule mode.
- Fixed MSAmanda running on DDA WIFF files.
- Fixed handling unexpected errors during auto-training of an mProphet model.
- Fixed case where "Ratio To" menu item in Targets view did not agree with "Normalize To" in Peak Areas view.
- Fixed problem removing a Prosit library for library matching in Molecule UI.
- Fixed unexpected error in heat map graph during a selection change.
- Fixed Agilent method export for scheduled methods
- Fixed an issue where a mass-only transition list import of a labeled precursor would come up with the unlabeled mass for the precursor transition.
- Fixed "Missing transition precursors when you do Refine > Permute Isotope Labels".
- Fixed "Item with the same key already added" when two small molecules have no Name, same precursor m/z and different set of transitions.
- Fixed an unexpected error when attempting to parse an ill-formed adduct description.
- Fixed InvalidOperationException choosing "Transform > None" when the displayed chromatogram has optimization steps.
- Fixed loading libraries from read-only drive location.
- Fixed problem where blank document created from the Start Page sometimes never loads.
- Fixed unexpected error in Import Peptide Search when importing multiple results files with the same name.
- Fixed preserving scores when using File > Export > Spectral Library.
- Fixed command-line documentation to use
tags instead of non-breaking hyphen for easier copy-paste. - Fixed transition list logic to decide proteomic vs. small molecule based on UI mode when no other indicators work.
- Fixed right-click > Copy in any graph to show a useful error message if the clipboard is locked by another application.
- Fixed error that happens if you set Instrument Min Time, but leave Instrument Max Time blank.
- Fixed a problem where if "Triggered Acquisition" was chosen on Transition Instrument Settings, the reported peak areas would all be 60 times smaller than they should be (but did not impact light:heavy ratios).
- Fixed Spectral Library Explorer handling of peptide with modified 'X'.
- Fixed a problem where "Protein Abundance" column would display as "column not found" if the report also had any peptide-level columns.
- Fixed tolerance of Shimadzu .lcd files not containing TIC information.
- Fixed how Skyline detects the difference between peptide and small molecule transition lists to be first based on finding a peptide sequence with a matching precursor m/z.
- Fixed writing CE and DP to large Skyline documents for upload to Panorama.
- Fixed coloring of peak annotations in MS/MS spectra for small molecules.
- Fixed filtering of targets when building spectral libraries from existing BLIB files.
- Fixed an infrequent potential race condition in the DIA-Umpire implementation.
- Fixed transition list column picker saving column assignments only when they are valid.
- Fixed a recently introduced problem where we were not identifying transition list columns as numeric if the values were in quotes.
- Fixed MaxQuant spectral library build to check up to 4 levels above msms.txt for spectrum files and improved the error message when files are not found.
- Fixed a problem processing Waters Cyclic IMS data, wherein the lockmass functions do not have IMS data.
- Fixed order by m/z method export bug when multiple precursors have the same m/z.
- Fixed cases where "View" was used in the UI instead of "Reports".
- Fixed calculation of R-squared for calibration curves that use "Linear in Log Space" fit.
- Fixed an unexpected error that can occur when "Transition Settings > Ion Mobility > Use spectral library values when present" is enabled.
- Fixed View > Library Match y-axis was not updating correctly in response to changes in selection in the Targets view.
- Fixed .skyd file corruption problem which could happen if there were more than 60 million candidate peaks.
Skyline v21.1 Updated on 10/6/2021
- Finalized Chinese and Japanese translation text
- Fixes to Import Peptide Search wizard for DIA tutorial and DIA/SWATH tutorial updates.
- Fixes for DIA-Umpire integration (various).
- Fixed an unexpected error with Ion Mobility settings.
- Fixed an unexpected error with the Full-Scan graph showing when displayed peptide is deleted.
- Fixed an unexpected error in the heatmap graph.
- Fixed a problem introduced in 21.1 where transition list columns were not identified as numeric if the values were in quotes. (impacting LipidCreator)
- Fixed Import Peptide Search FASTA page to hide panel for importing targets from a separate FASTA when not doing a DDA/DIA search.
- Fixed a missing DLL issue with Percolator in MS Amanda DDA search.
- Fixed storing calculated CE and DP values in .sky files with large target lists for Panorama.
Skyline v21.1 Released on 5/27/2021
- New! DIA-Umpire integration with library-free DIA data processing. (thanks to the Nesvizhskii lab) - [tutorial]
- New! Skyline Batch for large-scale batch processing of data analysis with Skyline [documentation]
- New! Class Discovery tools (hierarchical clustering and PCA plot) - [documentation]
- Extended crosslinked peptide target support to allow any number of peptides and any number of links, especially important to monitoring disulfide bonds on antibody drug conjugates.
- New UI for direct pasting or File > Import > Tranition List, allowing users to assign meaning to columns.
- Improved Import > Transition List or Assay Library format detection to do a better job of detecting the list and decimal separators regardless of system number format settings.
- Detection plot improvements.
- New spectrum annotation button on the Full-Scan graph to allow full peptide fragment annotation on extraction spectra.
- Added update progress display to RT > Regression and Scheduling plots.
- Added calculated concentration y-axis on the peak area graph, found under right-click > Normalize To.
- Added iRT support for command-line import peptide search.
- Added View > Targets menu item to clarify how to get Targets back after closing, especially for small molecules.
- Improved File > Share to avoid saving on unmodified documents and save directly to the .sky.zip file to avoid overwriting the file on disk for modified documents.
- Enabled the --ui argument for SkylineCmd.exe to show the UI and allow changes that get stored in its user settings file.
- Adding small molecules from View > Spectral Libraries where the library contains molecule list information will preserve the molecule list name.
- Added optional display of ion mobility information in chromatogram graphs.
- File > Export > Spectral Libraries now preserves protein and molecule list name information in the resulting .blib file.
- Extended spectral library support:
- Support for the latest DIA-NN speclib format.
- Support for reading MSP-formatted spectral libraries as exported by Thermo's mzVault Viewer.
- Support library building with .mzid.gz files and use it for MS Amanda DDA search in Skyline.
- Support library building for invK0 attribute in pepXML written by PEAKS export.
- Improved error message when a supported spectral library type (.msp, .sptxt, .hlf) is added as the file to use in building a library.
- Added support for "RTINSECONDS" retention time encoding in an MSP spectral library file comment.
- Improved error handling when trying to read a damaged BiblioSpec file.
- Improved memory consumption during full-scan data import.
- Added "Simple Ratios" checkbox to Peptide/Molecule Settings > Quantification settings.
- Added new report fields:
- Added TransitionResult.CycleTimeAcrossPeak report field.
- Added Protein.ProteinSequenceCoverage report field with the percent of protein sequence amino acids contained in any of the peptides.
- Added "Library Ion Mobility" report fields.
- Added "TransitionResultIsQuantitative" and "TransitionResultIsMs1" report fields for MSstats.
- Updated instrument vendor integration:
- Updated Agilent method export format.
- Updated the SCIEX WIFF2 DLLs.
- Updated Waters MassLynx DLLs to 4.8 which returns profile IMS data with flanking zero points.
- Ion mobility improvements found testing Thermo FAIMS support:
- Negative CoV values now allowed.
- On export of transition lists, CoV value now pulled from ion mobility library as needed.
- Ion mobility libraries now support molecules described only as name+mass (was assuming a chemical formula would be available)
- Viewing raw scan data now shows the scan's ion mobility value when available.
- Populating an ion mobility library via "Use Results" works properly when two molecules shared the same name but different details
- Other ion mobility UI fixes:
- Fixed "Transition Settings > Ion Mobility > Use Spectral Library Ion Mobilities" checkbox to avoid state where it would not uncheck.
- Full Scan graph now redraws on data reimport when showing ion mobility filter information, to ensure correct position of the purple IM filter band.
- Fixed an issue with the Full-Scan view showing only one chromatogram type (MS1 or MS/MS) when both are available.
- Fixed Edit Annotation form to display an error for a value list with not values specified.
- Fixed opening or creating an ion mobility library file before the "Name" field is completed, an error pops up.
- Fixed Import Peptide Search for PRM requiring MS1 filtering settings.
- Fixed problem in number of methods created when exporting an isolation list or method for Thermo Fusion machines.
- Fixed "Ratio to Heavy" to show up even if Heavy is not an internal standard type.
- Fixed support for non-Unimod mods and terminal mods in DDA search with MS Amanda.
- Fixed DDA search with MSAmanda to ignore FileNotFound/DirectoryNotFound when deleting temp files.
- Fixed import peak boundaries into multi-sample wiff files.
- Fixed pepXML spectral library building to accept search results from "peaks_db" as well as "peaksdb".
- Fixed DDA search with MS Amanda fragment tolerance always using precursor tolerance units.
- Fixed NullReferenceException pushing "Add" button from Result File Rules Edit List form.
- Fixed issue with Refine >Associate Proteins with a nameless FASTA sequence.
- Fixed unexpected error typing ')' into the empty element at the bottom of the Targets view.
- Fixed MSFragger spectral library builder to prefer spectra from _uncalibrated.mgf to avoid de-charged fragment ion peaks.
- Improved error message loading .skyd file when it is found to be corrupted.
- Improved audit log hash calculation to avoid the possibility of duplication.
- Fixed bugs with Turkish language settings mostly related to case insesitive pattern matching.
- Fixed library build treating Mascot fixed terminal mods as not overridden by variable terminal mods.
- Fixed an unexpected error when importing results with an ion mobility library when a precursor ion appears more than once in a document.
- Fixed Waters "Unknown Generic Error" due to calling GetDriftTime() on functions existing in Waters .RAW but not listed in _extern.inf.
- Fixed precursor ion spectrum support for WIFF files (use <product> element instead of <precursor>).
- Fixed unexpected error when user specifies a DDA search in the import wizard but then uses the "Back" button to start over.
- Improved error handling when importing small molecule transition lists with inconsistent molecule descriptions.
- Fixed unexpected error exporting method for Bruker timsTOF.
- Fixed bug where Protein Abundance was always #N/A if normalization method is Ratio to Heavy.
- Fixed a bug in the small molecule UI where inappropriate text was having "Peptide" replaced with "Molecule".
- Fixed issues in handling loss-only modifications like water and ammonia:
- Highlighting in the Targets view for loss-only modifications.
- Not possible to specify loss-only modifications with Edit > Modify Peptide.
- Importing Assay Libraries with loss-only modifications on peptides requiring explicit modifcations caused an error.
- Fixed to force choosing a filename with the same extension when a library file is missing.
- Fixed perf and error problems with "Remove Peak" on the Document Grid.
- Fixed irtdb docxml bug.
- Fixed DIA isolation scheme in Import Peptide Search to use the one currently set.
- Fixed Import Peptide Search case with no results files used to create a template document for Skyline Batch.
- Fixed to include PeptideSettings - Filter tab settings in Library Explorer - Add All button.
- Fixed NullReferenceException displaying tooltip on Fold Change Volcano plot if document has small molecules.
- Fixed library build from MaxQuant search results not applying terminal label-type mods.
- Fixed custom formats on columns in the Document Grid would be forgotten as soon as the data was refreshed.
- Fixed Mascot variable mod override logic in library build.
- Fixed TIC Normalization on the Peak Area Replicate Comparison graph.
- Fixed message for opening .sky file inside a ZIP file to work when the file is in a subdirectory.
- Fixed bug preventing DDA search with multiple files of the same name.
- Fixed "An item with the same key has already been added" exception changing Transition Settings in a document that has a molecule with multiple precursors that are the same as each other.
- Fixed problem where DDA search incorrectly adds isotope modifications to the document as structural modifications.
- Fixed problem where rdotp would not appear in the Targets tree if any of the heavy transitions had zero area.
- Fixed problem where "Accuracy" is miscalculated if the Sample Dilution Factor is not 1.
- Fixed unexpected error if using "Modify" menu item on a molecule and changing its chemical formula to result in some precursor transitions no longer existing in the mass distribution.
- Fixed problem where non-quantitative transitions would not show up in Peak Area - Replicates view.
- Fixed highlighting in red "Include all matching scans" if the Acquisition Method is "Targeted" when that is the right option.
- Improved agreement between command-line error logging and non-zero exit codes.
- Users running Chinese and Japanese language Skyline command-line should update SkylineRunner.exe
- Fixed Tools > Options - Miscellaneous - Clear All Saved Settings for teaching and testing.
- Fixed a Minimize Results error if it was opened while the document was still loading.
- Fixed a sizing layout issue in the FASTA page of the File > Import > Peptide Search wizard.
- Fixed unexpected errors in the RT scheduling graph.
- Fixed Library Match title to contain library name again - broken when Prosit was added.
- Fixed --report-invariant command-line argument to always use a comma field separator.
- Fixed Import Peptide Search to add RT predictor in if adding existing library with iRT values.
- Fixed Import Peptide Search to always show Match Modifications page.
- Fixed notification of iRT calculator modification when using BLIB file.
Skyline v20.2 Updated on 12/8/2020
- Finalized Chinese and Japanese translation text
- Fixed canceling the ion mobility library editor form when there are errors
- Fixed some issues with background loading of ion mobility libraries (.imsdb files)
- Fixed NullReferenceException pushing "Add" button from Result File Rules Edit List form
- Fixed DDA search fragment tolerance always using precursor tolerance units to allow searching hybrid data
- Fixed an unexpected error in aduct parsing
Skyline v20.2 Released on 10/13/2020
- Integrated DDA Search (with MS Amanda) in Import Peptide Search wizard with tutorial
- Support for crosslinked peptides (chemical crosslinking and disulfide bonds)
- Single-line modified peptide sequence format support for crosslinked peptide targets (supported in Edit > Insert > Peptides)
- PEPTIDEA-PEPTIDEB-[+mass@a,b]
- e.g. PETKPESER-EKVLTSSAR-[+138.06808@4,2]
- Support for loop-links, e.g. AKIQDKEGIPPDQQR-[+138.06808@2-6]
- Spectral library building support for Proxl XML (http://proxl-ms.org/) of crosslink peptide seaches
- Single-line modified peptide sequence format support for crosslinked peptide targets (supported in Edit > Insert > Peptides)
- Result File Rules - automated annotation population from result file properties including File Name and File Path
- View > Detection > Replicate Comparison and Histogram plots for applied mProphet models
- Qualitative ion ratio support
- iRT improvements
- "Automatic" option for iRT standard during library building
- Non-linear iRT - adding Lowess and Logarithmic regressions
- Improved iRT handling - especially with CiRT - for File > Import > Assay Library
- Edit iRT Calculator improvements:
- Add new IrtStandard using the current calculator's standard peptides
- Store best transitions and relative ion abundance with calculator
- Made Explicit Retention Time Window limit the range in which peaks are considered.
- Support Thermo SureQuant using Transition Settings > Instrument > Triggered acquisition checkbox
- File > Export > Method support for Bruker timsTOF prm-PASEF methods
- IMS filtering settings moved to Transition Settings - Ion Mobility.
- Added "Protein Results" -> "Protein Abundance" column to reports to expose the protein value used by the Group Comparison framework.
- A new Refine > Advanced - Group Comparison tab making it easy to perform the group comparison refinement demonstrated in Webinar 8 (through Refine > Accept Peptides and a bunch of copy-paste operations)
- Remove based on CV cutoff removes empty peptides
- Refinement based on CV and GC can still remove proteins based on remaining peptide count
- Added Prosit support for Propionamide (C)
- Added a "Product Neutral Loss" column to small molecule transition list reader, which makes it convenient to describe fragments in terms of a chemical formula to be subtracted from the precursor's chemical formula.
- Reduced the number of columns shown by default in the small molecule Insert Transition List grid
- Import Peptide Search Wizard added from and to transition filters and min and max instrument m/z values
- Spectral library building for the DiaNN specLib format.
- Added support for Golm Metabolome Database GCMS spectral library in .MSP format available at http://gmd.mpimp-golm.mpg.de/
- Support even more MSP spectral library format variants for small molecules
- Support for specifying the analyte concentrations for each target by replicate in calibration curves with PeptideResult.ExplicitAnalyteConcentration
- Added apply peak to group
- Added list editing buttons to the Document Settings - Reports tab
- Restored the ability to specify Explicit Collision Energy at the precursor level.
- Decoys checked against targets and warning presented with ability to regenerate if they don't match closely enough.
- Added View > Chromatograms > Close All and keyboard short cuts for Close (Ctrl-F4) and Close All (Ctrl-Shift-F4)
- Removed limit on number of peptides and transitions during File > Import > FASTA - counting on the user to cancel the operation when it is doing more than expected.
- Improved support for MS1-only TIC and BPC
- New resizing progress form to show all status text
- New report values in PrecursorResultsSummary for Detection Q Value (min, max, median)
- Refresh of all links and images for tutorials in the Start Page - Tutorials form
- Some performance improvements for very large DIA documents.
- Command-line not import a raw file from the same path unless a replicate name is specified with --import-replicate-name
- Command-line support for --decoys-discard
- Command-line support for --refine-cv-remove-above-cutoff with decimal percent if value <1
- Improved handling of invalid entries in spectral libraries - warn and filter instead of failing to load
- Many smaller bug fixes such as:
- Fixed failure to annotate fragment ions in heavy labeled Prosit predicted spectra.
- Fixed failure to match m/z values between heavy labeled library spectra and Prosit mirror plot spectra.
- Fixed handling of small molecule .MSP library files without Precursor_type values.
- Fixed reading LipidBlast .MSP files from MoNA
- Fixed support for MaxQuant's NotNTerm and NotCTerm fixed mods
- Fixed bug where MaxQuant spectral library build failing to parse file if it is missing both optional columns "Labeling State" and "Evidence ID".
- Fixed library build mzML -> MSFragger -> PeptideProphet pipeline (broken by previous fix to TIMS/MGF -> MSFragger -> PeptideProphet; now both pipelines work)
- Fixed library build file extension detection to be case insensitive.
- Fixed library build for tilde quotes ("File:~SomeRunName~") in Mascot DAT parser.
- Fixed library build for ProxlXml parser to not require linker_mass for unlinked peptides.
- Fixed a problem reading Agilent GCMS SIM SIC chromatograms
- Increase the threshold scan range at which we consider an MS1 scan to be a "SIM Scan" from 200 to 500
- Fixed SkylineCmd.exe error reporting when Skyline[-daily].exe are missing and ability to run from downloaded ZIP file without needing to unblock more than SkylineCmd.exe itself.
- Fixed possible deadlock using SkylineCmd/Runner to import data
- Fixed calculation of TIC when not MS1-only TIC is available - temporarily reverting to old slower Skyline code to calculate through spectrum summing - faster fix coming
- Fixed export of negative CoV values for FAIMS methods
- Fixed IMS display and units in reports to be consistent across PrecursorResults and Chromatogram values
- Fixed a null reference when dealing with libraries that have inconsistent ion mobility coverage
- Fixed errors requiring a restart switching iRT standards in the Edit iRT Calculator form
- Fixed preserving the original standards in an iRT library when standards are changed with the dropdown list
- Fixed warning about overwriting changes in an iRT library when none have been made
- Fixed exception using triggered acquisition if some precursors are missing chromatograms.
- Fixed unhandled error when importing peak boundaries for document with no result files
- Fixed issues handling SCIEX Midas data
- Fixed mProphet model training display to avoid empty space on the left and compressed histograms on the right.
- Fixed "Bandwidth too small" exception doing a Loess regression if there are not enough peptides in the document.
- Fixed LOQ determination so that it starts looking from the highest concentration point stops looking once it finds a level that fails the criteria.
- Fixed Shimadzu method numbering
- Fixed Ctrl-A to work as select all in the Document Grid even when it is docked.
- Fixed loading Shimadzu SRM files with just 1 chromatogram.
- Fixed exception bringing up RT Linear Regression window if there are crosslinked peptides in the document.
- Implemented a workaround for 32 transition limit on Waters method functions.
- Fixed handling a couple of novel adduct descriptions seen in the wild, e.g. "(M+H)+" and "(M+H)+[-H2O]", which would normally be written as "[M+H]+" and "[M-H2O+H]+" respectively.
- Fixed NullReferenceException trying to use Triggered Acquisition in small molecule document.
- Fixed retention time alignment makes mouse act out of phase on aligned replicate chromatogram graphs.
- Fixed File > Import Assay Library recognizing sequences surrounded by underscores and preceding N-terminal modifications produced by Spectronaut.
- Fixed pepXML reader looking for pepXML elements inside <analysis_summary>.
- Upgraded MethodCreator.dll for Agilent method export.
- The fragmentor voltage will be set using the voltage from the template method.
- For proteomics applications, the recommended fragmentor voltage for G6420, G6460, G6470 instrument models is 130.
- Fixed Panorama server checking for in-house Panorama servers.
- Fixed tooltips on Molecule Settings form for small molecules.
- Fixed blank IMS spectrum Full-Scan plot when shown in 2D with filtering on.
Skyline v20.1 Updated on 03/16/2020
- Finalized Chinese and Japanese translation text
- Fixed preserving manually set peak boundaries after reimport
- Fixed Library Match view visibility to require a library or Prosit enabled
- Fixed undo and audit logging of right-click > Quantitative property setting
- Fixed command-line import deadlocking race condition
- Fixed modification redefinition error in Import Peptide Search
- Fixed major performance issue with lockmass correction in Waters data imports
- Fixed command-line logic for when files get ignored during import if they have already been imported
- Fixed Bruker data import failure issues
- Fixed issue where Transition Settings changes could be overwritten during Import Peptide Search
- Fixed audit logging of changes to DIA isolation schemese
- Fixed a null reference when dealing with libraries that have inconsistent ion mobility coverage
- Fixed exception in the iRT calibration form
- Fixed exception doing "close all chromatograms".
- Fixed Import Peptide Search to turn off MS1 filtering if no precursor ions
- Fixed command-line run length to decimal value instead of an integer
Skyline v20.1 Released on 01/28/2020
- Prosit spectrum and iRT prediction support directly integrated into the UI
- Building libraries for targeted peptides in a document through Peptide Settings - Library - Build button.
- Prosit spectrum prediction viewing in the Spectrum Match plot with new right-click menus, including mirror plotting
- Settings in Tools > Options > Prosit
- Support for spectral library building from MS Fragger pepXML search results
- Support for diaPASEF!
- We have run this with 2 separate 3-organism datasets through the LFQBench statistical assessment and that works.
- Improved ddaPASEF and initial prmPASEF support.
- Performance gains in importing Agilent and Waters IMS data as much as 2x or more.
- Parallel file import with proteomewide DIA in the UI or by default on the command-line has performance similar to what was previously only available from the command-line using --import-process-count. Choose "Many" on your next import or just ignore threading the next time you import from the command-line.
- Optimized spectrum memory handling for instrument vendors with .NET data reader libraries, benefitting Agilent, SCIEX, and Thermo
- A new "Consistency" tab in the Refine > Advanced form, supporting CV and q value cut-offs
- New checkbox for Refine > Advanced - Results tab Max precursor peak only
- Support for Multiple Attribute Model (MAM) grouping with Peptide.AttributeGroupID and PeptideResults.AttributeAreaProportion
- Added File.SampleID and .SerialNumber (of the instrument) as fields in Document Grid custom reports
- Transitions Settings - Full-Scan - MS/MS filtering has been extended to apply to all non-MS1 spectra (e.g. MS3) as long as the MS1-level precursor matches the target precursor m/z The redundant library filtering phase of spectral library building is around 20x
- Improved iRT calibration UI making it easy to create new sets of standards based on existing sets that can be used in spectral library building and the Import Peptide Search wizard
- More iRT improvements including more intelligent use of 80+ CiRT peptides when CiRT is chosen during library building
- New right-click > Quantitative menu item for changing the Quantitative property on transitions in the Targets view TIC and BPC now come from raw data files and do not need to be extracted from MS1 spectra which has performance benefits for MS1 filtering
- New global "QC" transitions have been added such as the pressure trace
- Calibration curve fixes to make ImCal (Isotopolog Calibration Curves) work
- New "Calculated" annotations have been added which support storing Skyline calculated values in annotations for future use with AutoQC
- Optional display of spectral library spectrum scores in Spectrum Match, View > Spectral Libraries and in Document Grid
- Added Spectral library building support from "Assay Library" TSV
- New View > User Interface menu item in case the user misses the toolbar button
- New View > Peptides submenu to display modifications in the Targets view text for cases like glycan mods on biologics
- Support for charged losses on peptide modifications like for glycan mods to monitor precursor - lost, minus charge
- New option to order by m/z in exported methods/lists for optimized quadrupole switching Restore the ability to insert a transition list of either type when not in mixed UI mode
- Support KEGG IDs as molecular identifiers in small molecule targets.
- Improved support for D used in chemical formulae in place of the Skyline default H'
- Added support for Thermo Exploris and Eclipse instruments
- Support for opening .skyp files downloaded directly from Panorama
- New command-line arguments:
- --version - prints the Skyline[-daily] version information to the console
- --save-settings - saves and settings changes made during the session (e.g. opening a document may add elements to lists)
- --tran-predict-ce="<name>" - change the Transition Settings - Prediction - Collision energy setting
- --tran-predict-dp="<name>" - change the Transition Settings - Prediction - Declusering potential setting
- --tran-predict-cov="<name>" - change the Transition Settings - Prediction - Compensation voltage setting
- --tran-predict-opt="<name>" - change the Transition Settings - Prediction - Optimization library setting
- --import-filename-pattern - selects imported files from directory by a pattern
- --import-samplename-pattern - selects imported samples from a multi-file WIFF by a pattern
- --ims-library-res command-line argument for adjusting the library IMS extraction resolving power for testing varying settings on 3-organism mixes
- --share-zip - fixed from being broken in 19.1
- --exp-order-by-mz - orders transitions in exported methods/lists by m/z for optimized quadrupole switching
- Strong versioning in Skyline-daily.exe and SkylineCmd.exe
- When you hover the mouse over these EXE files in Windows File Explorer the version number is reported in a tip (no longer just 1.0.0.0)
- The command-line --version argument now always reports a full version, even for a "developer build" including the Git hash for the source control revision on GitHub, and now the version of ProteoWizard, ensuring the pwiz_data_cli.dll can be loaded.
- The Skyline Help > About form now also includes this full version with Git hash
- Many smaller bug fixes such as:
- Spectral libraries from MaxQuant results using spectra from raw data now uses the right spectra
- Fixed BiblioSpec parser for MaxQuant 1.6.7 mod format
- Fixed for issue with iProphet and 2H element for MaxQuant
- Made charge state suffix parsing more flexible to handle the following cases:
- A series of + or - symbols however long (used to stop at ++++ for positive and -- for negative)
- Use CultureInfo.TextInfo.ListSeparator (semi-colon in Europe) "; +5" instead of CultureInfo.NumberFormat.NumberGroupSeparator (period, space or apostrophe in Europe) ". +5", " +5", or "' +5"
- Allow invariant form always ", +5" even when current culture indicates "; +5"
- Allow the absence of the space in charge states with numbers, i.e. ",+5" or ";+5"
- Fixed right-click > Order By > Annotation in replicate summary plots
- Fixed error "Spectrum must have a source file" when doing Import Assay Library tutorial
- Fixed problem where "batch_name" was not getting written out for replicates.
- Fixed problem where changing the uniqueness constraint in the Peptide Settings dialog does not result in a new Undo record being created.
- Fixed error when doing "Export Annotations" if StandardType has been specified for peptides.
- Fixed error when List has "value list" column type.
- Exclude peptides from .elib files that do not appear in the "PeptideQuants" table.
- Fixed missing peak logic when importing with EncyclopeDIA or OpenSWATH results
- Added support for reading the expect score from Comet pepXML and for using ms2 files for finding spectra of pepXML files.
- Fixed Tools > Tool Store error message when skyline.ms server is down for maintenance.
- Fixed controls hidden on Import > Peptide Search form when initiated from the Start page.
- Fixed problem where Skyline was not acknowledging the isolation windows on MSX scans.
- Fixed calculation of LOD. It was incorrectly using only using the multiple of the SD of the blank values. It was forgetting to add the mean of the observed values as well.
- Fixed Precursor Concentration getting blanked out whenever the Peptide Settings changed.
- Fixed to support a change to the Uniprot interface for querying protein details.
- Fixed exception when doing "Pick Children" on a small molecule that has two identical precursors.
- Fixed "Refine > Advanced" max peptide peak rank when there are peptides that only have internal standard precursors and increase maximum peptide peak rank from 10 to 20.
- Fixed exception that can happen if deselect EmptyNode at bottom of Targets tree while Peak Area Replicate Comparison is shown.
- Fixed CCS calculation for Bruker data to use 2*N instead of just N.
- Fixes to improve support for a 1.3 GB Assay Library including a fix to an OutOfMemoryException
- Fixed progress display of upload to Panorama
- Fixed Area CV calculation for heavy labeled ratio normalization.
- Fixed modified peptide sequence text exported from Skyline in .blib spectral libraries to match library builds
- Fixed unexpected error using Refine > Advanced in small molecule documents with results
- Fixed renaming a molecule causes miscalculating mass of transition with heavy label adduct
- Fixed File > Export > Spectral Library losing information from small molecule documents
- Fixed case sensitivity in library file name extensions
Skyline v19.1 Released on 07/14/2019
This is the 19th official release and the first of 2019. So, for this 10th anniversary realese, we are changing to a year-based version number like many other mature products.
- New! Small molecule and proteomics UI modes [introduction]
- And a form that asks for your preferred mode once
- iRT and Optimization library support for small molecules
- New! Lists - define lists of values in multiple columns and associate them with elements in your documents through annotations. [documentation]
- See Document Settings – Lists
- Batch calibration – [documentation]
- Import > Peptide Search with an existing library (including EncyclopeDIA .elib files)
- A new MS/MS filtering Acquisition method named "DDA" which sets all fragment ions to non-quantitative and does not truncate MS1 chromatograms the way "Targeted" (or PRM) does.
- Edit > Refine became a top-level Refine menu between Edit and View and got reorganized for ease-of-use.
- The Document Grid "Views" menu has been changed to "Reports" to better align with File > Export > Report and Document Settings - Reports
- Added Actions menu to the Document Grid to enable bulk peak removal based on filtering
- New command-line help for SkylineRunner/SkylineCmd available with --help argument and Help > Documentation > Command Line in Skyline
- Command-line support for Refine > Advanced options
- Command-line support for setting precursor charge states, fragment charge states and fragment types
- Moved some explicit parameter values like CE from precursor to transition level
- Audit log improvements to support working with Panorama and tampering detection
- Building a library from MaxQuant msms.txt now attempts to find the original spectrum source files and use the spectra in them to avoid using charge state deconvoluted spectra, but allows the user to override this default if the spectrum source files cannot be found
- A new <Edit current...> choice in the dropdown lists in Edit > Modify Peptide to make updating specified modification definitions easier
- Improved handling of common background proteome building problem where user tries to open or create the FASTA file causing it to be overwritten by an empty PROTDB file
- Changed File > Share default to "Complete" instead of "Minimal"
- Add "PeptideResult.ModifiedAreaProportion" which is the normalized area of the PeptideResult, divided by the sum of the other NormalizedAreas for all of the other PeptideResults in the same replicate and protein that have the same unmodified sequenceAdded new Transition.LossFormulas field
- Allow grouping by built-in properties such as "concentration" in addition to annotations in peak area graph
- Many smaller bug fixes such as:
- Fixed to support C-terminal modifications in MaxQuant msms.txt
- Fixed library building for PeptideShaker results
- Fixed to add the .wiff2 extension to File > Import > Results form
- Fixed to support File > Export > Method for Thermo Altis
- Fixed to allow package installation for R external tools (like MSstats) in China
- Fixed for calibration curve text exported to report CSV files on Chinese and Japanese systems
- Fixed library building from paths with extended characters
- Fixed for spectral library building of Peaks mzIdentML/MGF export
- Fixed library building support for ProXL cross-linked peptides with PTMs
- Added support for radioactive 14C labeling as C"
- Added support for deuterium as D and H' and tritium as T and H"
- All elements in the periodic table now allowed in chemical formulae
- Fixed for q value cut-off advanced option in group comparison definition form
- Fixed to apply chromatogram transformation to non-quantitative chromatograms to match quantitative chromatograms
- Fixed for invalid precursor transitions after changing Full-Scan settings
- Performance improvement for importing large small molecule transition lists
- Fixed to Support new variant of retention time specification in NIST .msp library format
- Fixed audit log saving to use write and rename to avoid log truncation
- Fixed audit log enabling to create undo records and be more persistent
- Fixed to handling of invalid adduct specification
- Fixed to small molecule persistence with multiple keys
- Fixed undo/redo of setting standard type
- Fixed problem where modifications with negative mass cannot be found in iRT database (reported by Anatoly, thanks to Nick)
- Updated UIMFLibrary DLLs to version 3.6.6
- Fixed library build support for reading MaxQuant fixed peptide-N/C-terminal modifications
- Fixed parsing of pS/pT/pY variant of phospho mods from MaxQuant
- Fixed issue parsing PLGS final_fragment.csv modifications with paren’s in the mod name
- Fixed problem with implicit modifications not being included in "Modified Sequence" column in Document Grid
- Fixed importing report layouts from a .skyr file
- Fixed reading Shimadzu QTOF files that also open with the QQQ reader DLL
- Change SCIEX centroiding to multiply Y (area) values by 100 to make the numbers more similar to profile extraction (requested by SCIEX)
- Fixed Area CV histograms to ignore precursors with no chromatograms rather than Calculating... forever
- Fixed to continue importing chromatograms when iRT regression fails as long as chromatogram extraction is not dependent on it
Skyline v4.2 Updated on 04/08/2019
Skyline v4.2 Updated on 01/08/2019
Skyline v4.2 Released on 11/01/2018
- AUDIT LOGGING - yes, really [documentation]
- New Figures of Merit section in Peptide Settings – Quantification tab
- New LOD and LOQ fields in reports
- New display in Calibration Curve plot
- New calibration features
- Regression fit = Linear in Log Space
- Single-replicate calibration with isotope labeled standards for system suitability
- Added Sample Dilution Factor field to Replicates in Document Grid for dilution of a sample to bring it within the linear dynamic range
- Support for importing OpenSWATH results through File > Import > Peptide Search - DIA wizard [details]
- Support for using integration boundaries and peak scores from OpenSWATH and EncyclopeDIA
- Drift time predictor training from Use Results fixed for small molecules
- Instrument support improvements:
- Agilint - support for negative ion mode QqQ data
- Bruker - timsTOF support for PASEF, All Ions, and PRM
- SCIEX - support for new SCIEX WIFF2 file format & clearer method export, CE and DP settings
- Shimadzu - support for 9030 Q-TOF and 8045 QqQ
- Thermo - support for Thermo FAIMS, GC-MS, Tune v3+ compatibility, and faster raw file reader DLL
- Waters - advances in SONAR and CCS calibration and importing data from UNIFI server
- Settings > Integrate All no longer affects Precursors.TotalArea nor other quantitative metrics. At last, it is just visual.
- File > Import or Export > Annotations for importing or exporting annotations values directly from or to a CSV file
- New command-line support
- --import-document = File > Import > Document
- --import-annotations = File > Import > Annotations
- --share-zip = File > Share
- --import-all-files = File > Import > Results of all files in the directory specified, but not subdirectories
- --import-all[-files] and --import-replicate-name together to import multiple files into a new replicate
- --reintegrate-exclude-feature = unchecking feature in mProphet model
- New library build support
- Mascot error tolerant searches and PASEF searches
- MassIVE mzTab
- MetaMorpheus mzIdentML
- Crux Percolator pepXML
- PEAKS pepXML/mzXML export when scans are out of order
- Proteome Discoverer ExpectationValue support and pdResult files with multiple workflows
- MaxQuant deuterium labeling modifications and results lacking Labeling State column
- Added new iRT standard mix RTBEADS
- Added ability to separate CVs in Peak Areas > CV Histogram by precursor or fragment ions in mixed MS1 and MS/MS documents
- Added Plot Type > Residuals to Retention Times > Alignment view
- Faster volcano plot updates and format filtering peptides by protein attributes
- Mouse centered zooming added to some graphs that did not yet have it
- Edit > Delete of transitions removes matching transitions in matching reference precursors
- Edit > Refine > Advanced new option to remove peptides without a matching spectrum
- Added find support for report link columns with text display
- Increased maximum fragment charge state to 20 for whole protein MS/MS
- Increased custom molecule maximum mass from 100 KDa to 160 KDa
- Added a new copy button in the lower-left corner of message boxes to make it clearer that form contents can be copied as text
- Many smaller bug fixes such as:
- Fixed problem reading Thermo raw files that have scans with multiple precursors.
- Fixed "use results" on "Edit Drift Time Predictor" form to pay attention to whether "Use high energy offset" is checked. If it's not checked, then always use 0 for the high energy offset.
- Fixed problem where matching chromatograms to transitions does not pay attention to m/z match tolerance and double counts transitions.
- Fixed ion mobility lookup in spectral libraries to support high precision modifications.
- Fixed bug where documents containing the adduct "[2M+H]" cannot be opened.
- Fixed "Remove Peak" behavior when chromatograms showing more than one file.
- Fixed performance and background updates for Retention Times - Regression view
- Fixed to editing small molecules with MS1 precursors that resulted in document corruption
- Fixed to allow unchecking "Intensity" in an mProphet scoring model
- Fixed to improve performance in a document with 500 replicates
- Fixed to improve graphs restoring their visible state in the absence of a .view file
- Fixed performance for large iRT libraries
- Fixed a bug where libraries were disregarding modifications when returning retention times
- Fixed matching spectra in SCIEX Midas data to precursors with modifications, especially heavy labeled
- Fixed problem where a mixed polarity .raw file can result in an error about the number of times not being equal
- Fixed obscure Thermo scanfilter parsing issue with a negative SID
- Fixed case where ModifiedSequence would display the wrong mass if there were two modifications on the same amino acid
- Fixed unexpected error trying to use Centroided extraction from Waters data acquired in centroid mode
- Fixed small molecule PrecursorIonFormula vs. PrecursorNeutralFormula in small molecules with isotope labeling
- Fixed issue with neutral loss transitions not matching spectral libraries during a settings change
- Fixed to keep fragment ion transitions from matching chromatograms extracted from MS1
- Fixed error message for file access denied from "Win32 Error 5" to something more helpful
- Fixed issue with importing transition lists containing O" or 17O
- Fixed for Waters data import to allow both centroiding and lockmass correction
- Fixed small molecule transition list reader when Transition Settings precursor and fragment mass types are different
- Fixed small molecule transition list import where the product columns are left empty to imp[y that the precursor is the ion of interest for this row
- Fixed excessive memory use building a background proteome
- Fixed issue with chromatogram extraction from mixed polarity raw data files
- Fixed protein annotation using Uniprot to keep up with changes in their interface
- Fixed command-line to import all samples from a multi-sample WIFF file
Skyline v4.1 Release Updated on 6/19/2018
Skyline v4.1 Release Updated on 2/18/2018
Skyline v4.1 Released on 1/11/2018
- Improved small molecule support [detail slides]
- Support for NIST and self-built (from SSL format) small molecule spectral libraries with fragment annotation
- Neutral molecules with multiple precursor adducts
- Improved support for pasting small molecule transition lists with column headers
- Bruker TIMS support that parallels IMS support for other vendors
- A new Document Grid pivot editor and saved report layouts [detail slides]
- Improved Import Peptide Search wizard for DIA with DDA for the mProphet workflow
- File > Import > Assay Library makes importing Assay Library files easier than File > Import > Transition List
- More performance improvements (memory use and speed) for large-scale DIA data processing
- Interactive volcano plots for group comparisons with custom formatting [detail slides]
- Interactive peak area CV histogram plots [detail slides]
- High precision modification delta-mass support past a single decimal place
- Points across the peak and manual integration adjustment visualizations in chromatogram plots [detail slide]
- New line plot modes for summary (Replicate and Peptide Comparison) plots
- Synchronized zooming available in summary (Replicate and Peptide Comparison) plots
- New Import Results common prefix and suffix removal UI with real-time replicate name display
- New delete button (red X) on the Document Grid
- allows deletion from the Targets View (proteins, peptides, precursors and transitions)
- filter and delete.
- Possible to rename replicates from Document Grid (including copy-paste) with "Replicate Name" field
- New "Exclude From Calibration" column on PeptideResult
- New Quantitative column on Transitions [detail slides]
- New non-blocking background population of Document Grid with full support for chromatogram values (times, intensities, mass errors) in Live Reports, both interpolated and raw values
- New Edit > Integration menu with shortcuts for Remove Peak and Apply Peak to All
- Display an informative warning when iRT calibration fails during import
- Improvements for library building from peptide search formats which do not support probability cutoffs to make sure they get ordered correctly
- Many other fixes...
Skyline v3.7 Release Updated on 9/10/2017
Skyline v3.7 Released on 6/12/2017
New features include:
- Extensive performance improvements in speed and memory use for proteomewide, label-free DIA and DDA data processing
- If you have the hardware, Skyline should be able to use up to 100% CPU and 100% of your memory. Though we continue working on making it do more with less.
- Performance improvements in very large DIA (6,000,000 transitions x 20 files)
- Convergence detection in mProphet modeling and 10 iteration maximum (down from 30)
- New --import-process-count=[num] and --import-theads=[num] arguments for SkylineRunner. The former can yield up to 10x import performance improvement on a 24-core NUMA server and 2-4x on a standard i7.
- Reduced .sky file size by 70% for large (over 1000 transitions) files
- Multi-peptide peak area graph
- Customizable color schemes
- Import isolation scheme feature from DIA data files
- Improved iRT calibration from DDA data directly into spectral libraries
- Storing raw chromatograms in SKYD files. This is a big one which also gives us:
- View > Transform > Interpolated (F12) shows the chromatograms as Skyline used to show them
- View > Transform > None (Shift+F12) shows the raw uninterpolated chromatogram
- Skyline can now always show in Full-Scan graph every spectrum from which chromatograms were extracted. Previously interpolation could cause spectra to be skipped
- A new report value TransitionResults.PointsAcrossPeak
- File > Share can now create document archives in 3.6 format for sharing to Skyline 3.6
- File > Export > Spectral library for exporting targeted results as a spectral library for your next experiment
- Support for semi-cleavage enzymes in Peptide Settings - Digestion tab
- Support for Associate Proteins checkbox in View > Spectral Libraries with background proteome for nonspecific cleavage
- Run-to-run retention time correlation graph
- New file details (score type, score cut-off, unique peptides and spectra) in Spectral Library Explorer source file details form.
- Support BLIB files with StartTime and EndTime in the RetentionTimes table
- Allowing external tools to provide their own peak detection and picking
- Times are used for peak integration boundaries without further peak detection
- Faster imports and smaller resulting files
- File > Import > Peak Boundaries 2-10x faster
- Add Total Ion Current Area under Results.File in reports/Document Grid
- Add "Equalize Medians" as normalization method in Peptide Settings / Quantification for large exploratory experiments where most targets are not changing
- Improved paste performance in the Document Grid
- Column tips and reference help in the Live Report view editor
- New SkylineDailyCmd.exe in same folder as Skyline-daily.exe with same command-line interface as SkylineRunner.exe, but runs Skyline in a single process, useful for ZIP-file or Administrator installations where these EXEs are placed in easily located paths
- Proteome Discoverer 2.2 support in spectral library builder
- Improved support for SCIEX Midas workflow
- Improved support for Agilent IMS workflow
- Improved handling of importing modified peptide sequences with SCIEX 3-letter modification abbreviations
- Export transition list feature for mixed polarity small molecule documents to allow exporting different polarities separately
- Various other fixes such as:
- Use of .NET API to encrypt passwords for Panorama and Chorus stored by Skyline in its user.config file.
- Fix to z ion mass calculation, which was off by one hydrogen atom
- Fix to View > Mass Errors > Replicates graph to match colors with other replicate graphs when MS1 and MS/MS XICs are present
- Fix y axis scaling in chromatograms which had problems when IDs or Predicted annotations were present and scale was less than 100
- Fix tracking of changes to iRT standards to better match changes to documents
- Fix to avoid removing iRT standards when Edit > Refine > Advanced minimum transition count is higher than they contain
- Fix to keep from duplicating spectrum source files - especially problematic for iRT training - in spectral libraries when a DDA file is searched twice
- Slightly more tolerant peak grouping which allows undetected peaks to be added to the group based on chromatogram correlation over the integration boundaries.
- Fix precursor matching with SRM data in fringe case where the precursor m/z is worse, but transition matching is better
- Fix error message reporting missing required columns in File > Import > Peak Boundaries
- Fix to "Unable to sort because the IComparer.Compare() method returns inconsistent results"
Skyline v3.6 Release Updated on 2/21/2017
Skyline v3.6 Released on 11/7/2016
New features include:
- Improved results import:
- Parallel multi-file results import (in user and command-line interfaces)
- New results import interface for improved unattended imports
- Greatly improved import performance for Skyline documents on network drives
- Calibrated quantification improvements:
- Surrogate standards for normalizing to explicit non-homologous molecules
- Remove point right-click option in calibration curve graph
- Explicit Global Standard Area added to replicates for explicit global normalization control with values like TIC
- Group comparison additions and fixes to improve consistency with MSstats
- New Detection Q Value and Detection Z Score report columns for mProphet scored peak picking
- New Peak Rank By Level report value and Targets view showing separate peak rankings for MS1 and MS/MS transitions
- Peptide uniqueness constraint added to Peptide Settings - Digestion tab (by protein, gene or organism)
- New Edit > Refine > Associate Proteins for adding protein associations for targeted peptides after they have been added to the targets list
- Ability to choose which modifictions to use when showing a library in the Spectral Library Explorer
- New and improved plots:
- Mass error plots (replicate and peptide comparisions and 1D and 2D histograms
- Multi-peptide retention time plot
- Point set selection in retention time regression plot
- Improved small molecule support:
- Improved support for negative ion mode
- Improved chromatogram matching for molecules with identical precursor m/z but different scheduled retention times
- Parsing of chemical formula with adduct syntax in Edit > Insert > Transitions
- Support for small molecule transition list import with Edit > Paste, File > Import > Transition List, external tools and with command-line
- Improved Transition Settings for Full-Scan
- Centroided extraction with mass error tolerance made default, based on improvement seen with Thermo, Sciex and Bruker instruments
- New high-selectivity extraction option (1/2 extraction width) for extraction from profile spectra, based on improvement seen with Termo and Sciex raw data files
- Easier import of existing data with improved isolation schemes based on raw data
- Fixed support for importing from instruments using different high- and low-resolution between MS1 and MS/MS
- Ability to include ambiguously matched spectra in spectral libraries build by Skyline
- Improved support for iRT:
- Support for more iRT standard mixes
- Automatic adding of iRT standard targets to document
- More flexible iRT regression support (allowing 80% of standards at 0.995 correlation)
- CiRT support
- SkylineRunner command-line interface improvements:
- Command-line support for importing transition lists and assay libraries
- Command-line support for exporting isolation lists
- Command-line support for adding decoy peptides
- Improvements made to support AutoQC
- mProphet model generation output to console log
- Initial support for Sciex MIDAS data
- Initial support fixes for Waters SONAR data
- Fix for File > Save As bug that disabled Edit > Refine > Re-import
- Many other smaller bug fixes
Skyline v3.5 Release Updated on 1/24/2016
Skyline v3.5 Released on 12/1/2015
New features include:
- Calibrated quantification (a.k.a. absolute quantification) [see tip]
- Impressive performance improvements for large full-scan data sets (DIA and DDA)
- Many longer operations made much faster and showing progress form allowing cancel
- Chromatogram extraction from centroided scans using mass accuracy in PPM (Peptide Settings - Full-Scan tab, using Centroided mass analyzer)
- Improved small molecule support:
- Support for negative polarity ions
- Support for multiple ions per precursor, including isotope labeling
- SkylineRunner command-line improvements supporting processing pipelines from raw data to Panorama uploads
- Improved assay library and transition list import with better modification guessing
- Full support for Panorama AutoQC system suitability run processing
- Support for building spectral libraries from DIA-Umpire search results
- Ability to include report templates in document with Document Settings
- Fill Down function available on Document Grid right-click menu
- Delete-key clears cells in Document Grid
- Apply to All for faster manual correction of multi-replicate peak picking
- Compensation voltage optimization for Sciex instruments with SelexION
- Default Sciex SWATH isolation schemes and abilitly to export Sciex isolation lists
- Automated drift-time training for Agilent and Waters IMS Q-TOF instruments
- Lockmass correction for Waters Q-TOF data
- Export directly to instrument methods for Shimadzu QqQ instruments
- Many display improvements:
- Peak area and background shading of selected transition
- New residuals plot in Retention Times > Regression graph
- Keep ID annotations from being hidden by chromatograms
- Improved dotp display in Peak Areas plot
- Option for strict scientific notation for intensity y-axis on plots
- Graph text scaling based on right-click > Properties for all graph text
Skyline v3.1 Release updated on 4/13/2015
Skyline v3.1 Released on 3/16/2015
New features include:
- Integrated Group Comparison support (see images below). Get started with:
- View > Group Comparisons > Add
- Settings > Document Settings - Group Comparisons tab
- Tutorial coming soon...
- Support for custom ions / small molecule targeted MS
- Use Edit > Insert > Transitions - Small molecules to start a Skyline small molecule document
- Watch Skyline Tutorial Webinar #4 - Preview of Small Molecule Support
- Cloud chromatogram extraction from full-scan data with Chorus
- Consult the Chorus Cloud Chromatogram Extraction tip to get started.
- New wizards for importing peptide searches with PRM and DIA data sets
- Direct filtering of Document Grid views
- Support for iRT scores in chromatogram libraries from Panorama
- Faster start-up and file open and save progress
- Fully enforced light-heavy ion matching and Find form support for "Mismatched transitions"
- Improved optimization library support
Skyline v2.6 Release updated on 2/8/2015
Skyline v2.6 Release updated on 10/27/2014
Skyline v2.6 Released on 9/22/2014
New features include:
- Full-Scan spectrum view for chromatograms extracted from full-scan data, with heat-map graph for IMS data
- New Skyline start page for faster access to common start scenarios and tutorials
- Ion mobility drift time filtering for Agilent and Waters TOF instruments
- Optimization library support for storing optimized CE values
- Custom fragment ion support for defining non-peptide-backbone fragments (like iTRAQ, TMT, etc.)
- Support for isotope labeling experiments (like SILAC) without standards
- Support for Shimadzu triple-quadrupole instruments
- Improved chromatogram peak picking
- Import of tabular "assay library" format
- Support for protein details information (accession number, gene name and preferred name) queried from internet sites
- DIA isolation scheme viewer
- Option to exclude transitions within the DIA isolation window for the precursor
Skyline v2.5 Release updated on 7/10/2014
Skyline v2.5 Release updated on 5/5/2014
With:
- Chinese and Japanese translations
Skyline v2.5 Released on 2/8/2014
New features include:
- Live Reports - interact directly with Skyline documents through a grid interface with
- Customizable column display
- Sort and filter
- Direct paste to annotation values
- Text search
- Much faster report generation than the original Custom Reports
- Improved peak scoring and picking
- Improved default peak picking
- Integrated mProphet scores and semi-supervised learning model training
- Edit > Refine > Reintegrate form for applying non-default peak scoring and picking models
- Peak q value assignment
- Model training and evaluation interface
- Global standard type assignment
- Right-click > Set Standard Type to assign Normalization and QC standard types
- New icons to display iRT, Normalization and QC standard types in Targets view
- New ratio values for peptides, precursors and transitions to global standard types in Peak Areas graph and reports
- All global standard peptides measured in every method of multiple method documents
- Fully integrated Tool Storeuser interface
- Tools > Tool Store form for reviewing and installing External Tools without leaving Skyline or manually downloading files
- Update notifications for new tool releases
- Tools > Updates form for automatic updates to installed tools
- Multi-peptide chromatogram graphs - use protein selection or multiple selection (shift- or ctrl-click) to see annotated chromatogram peaks for many peptides at once
- Improved support for Scheduled Extraction of chromatograms from full-scan mass spectra
- Improved File > Import > Peptide Search wizard
- Thermo raw file import support on systems with European number format settings
Skyline v2.1 Released on 9/8/2013
New features include:
- Support for building chromatogram libraries on Panorama and using them in Skyline
- File > Import > Peptide Search wizard for DDA data quick start
- Mass accuracy metrics for high resolution full-scan data
- TIC and base peak chromatograms from MS1 survey scans
- Installed support for Bruker TOF data, with improved performance
- Demultiplexing of overlapped DIA/SWATH methods
- Improved External Tool integration (see the list of available tools)
- Direct pasting into the Results Grid (especially useful for replicate annotations for external tools)
- Fix to be able to distinguish peptides with the same precursor m/z in MS1 filtered data
- Improved memory performance for large full-scan imports
- Enhanced results data import progress interface with peak graph
- Split chromatogram graphs for simultaneous viewing of light and heavy transitions, and precursor and product ions
- Alignment by iRT scores in graphs
- Improved integration with PanoramaWeb
- Save and restore of Targets View expansion and selection state
- Several spectral library builder fixes, including support for larger libraries and new search pipelines:
- PEAKS pepXML/mzXML
- MSGF+ pepXML/mzXML
- File > Import > Peak Boundaries for importing peak selection from other tools
- File > Export > Chromatograms for exporting chromatogram points
Skyline v1.4 Release Updated on 3/18/2013
With:
- Support for building spectral libraries from Proteome Discoverer MSF
- Support for building spectral libraries from MaxQuant Andromeda msms.txt
Skyline v1.4 Release Updated on 12/17/2012
With:
- Support for building spectral libraries from PRIDE XML
Skyline v1.4 Released on 11/12/2012
New features include:
- Bruker TOF support [details]
- Export triggered MRM (a.k.a. iSRM) transition list support (Agilent and Thermo instruments)
- Peak picking based on retention time alignment of MS/MS IDs for MS1 filtering
- Improved retention time alignment features for MS1 filtering
- Support for publishing Skyline documents to Panorama targeted proteomics repository web sites (server software currently in beta, available early 2013)
- Support for MS1 filtering from SIM scans
- Customizable Tools menu (EXE, Batch and Web site) with macro and custom reports as inputs and command-line customization for installers
- Replicate custom annotations, e.g. Concentration, Case/Control, SubjectId, etc.
(see the updated Existing and Quantitative Experiments tutorial pp. 30-35) - Replicate comparison graphs grouped by replicate annotations
- Renaming of FASTA sequences (direct edit and Edit > Refine > Rename Proteins)
Skyline v1.3 Release Updated on 8/12/2012
Skyline v1.3 Released on 6/20/2012
New features include:
- Advanced support for data independent acquisition (DIA) across vendors:
- AB SCIEX SWATH™
- Agilent DIA
- Thermo DIA & Multiplexed DIA
- Waters MSe™
- Isolation list export for Thermo Q Exactive and Agilent TOF instruments
- 64-bit version with higher memory limits
- Retention time alignment for MS1 filtering
- MS/MS retention times in built libraries for more peptide ID pipelines
- Auto-refinement for selecting best responding peptides
- Improved handling for high charge peptides
- Auto-detection of modifications in the Spectral Library Explorer
- Decoy peptide and transition generation for FDR based peak picking
Skyline v1.2 Release Updated on 3/27/2012
Skyline v1.2 Released on 2/15/2012
New features include:
- Integrated display of MS/MS peptide ID spectra in MS1 chromatograms
- Peak picking in MS1 chromatograms based on MS/MS peptide ID retention times
- New isotope dot-product score on MS1 full-scan filtered peaks, and expected relative isotope abundance in peak area plot and reports
- More accurate retention time prediction with integrated iRT Calculator support
- Command-line interface for running Skyline operations in automated scripts on instrument control computers
- Faster MS/MS library loading
- Improved memory performance for full-scan chromatogram extraction
- Improved full-scan method export for Thermo LTQs, including support for Accurate Inclusion Mass Spectrometry (AIMS)
- Full-scan method export for AB SCIEX Q-TOFs, including support for AIMS
- Data import support for Thermo Q-Exactive
- Data import support for Waters Synapt G2-S
- Spectral library build support for iProphet and Protein Prospector pepXML
- New enhanced Find with Find All
- Unexpected error form with button to report the issue
- Manage results, minimize for reducing chromatogram data size in final documents
Skyline v1.1 Release Updated on 8/8/2011
Skyline v1.1 Released on 6/11/2011
New features include:
- Import results from WIFF files much improved (50-fold faster for large scheduled runs - thanks to AB SCIEX)
- Full-scan MS/MS ion chromatogram extraction
- Full-scan MS1 multiple isotope ion chromatogram extraction
- Full-scan method export for Thermo LTQ
- Import document with multiple documents and support for merging results
- Integrated support for Unimod modification definitions
- Modification auto-detect support for pasted/inserted annotated peptide sequences
- Native method export for AB SCIEX QTRAP
- Native method export for Agilent 6400 Series
- Spectral library build support for Scaffold, Waters MS^e and OMSSA
- Improved Edit / Find in the Peptide View
- Larger text sizes in the peptide tree view
- Multi-select annotation editing
- Multiple color annotation indicators
- Improved scheduling for multi-replicate documents
- Variable modification and neutral loss detection in transition list paste/insert/import
- Peptide filter expression support for matching modifications
- New bulk refinement operations
- Replicate acquired time in reports and replicate plot ordering
- New summary plots
Skyline v0.7 Release Updated on 3/30/2011
Skyline v0.7 Release Updated on 2/7/2011
Skyline v0.7 Release Updated on 10/30/2010
Skyline v0.7 Release Updated on 10/5/2010
Skyline v0.7 Released on 9/15/2010
New features include:
- Variable modifications
- Neutral loss product ion transitions
- Native Waters file import support installed
- Spectral Library Explorer
- Multiple heavy label types
- Multi-select copy-paste (text, HTML formatted, and Skyline document to Skyline document)
- Peptide view enhancements (multiple selection, peptide modification highlighting, etc.)
- Spectral libraries built from Protein Pilot results
- Analysis support for fractionation replicates
- Synchronized zooming of multiple chromatogram graphs
- Copy data from graphs to re-plot with your favorite graphing package
- Data import performance improvements for Agilent, AB Sciex and Thermo
- Improved international system settings support
Skyline v0.6 Release Updated on 7/7/2010
Skyline v0.6 Release Updated on 5/21/2010
Now with native WIFF file import support installed.
Skyline v0.6 Release Updated on 4/21/2010
Skyline v0.6 Release Updated on 4/2/2010
Skyline v0.6 Released on 3/17/2010
New features include:
- Improved automatic peak integration
- Collision energy optimization
- Peak area charts
- Peptide summary charts
- Manuscript ready charts
- Results grid with per replicate annotations
- Custom annotations
- Auto-refinement dialog box
- SpectraST library support
- Unique peptides view with a Background Proteome
- Improved support for document sharing
- Summary result statistics in reports
- Waters instrument native method export
Skyline v0.5 Release Updated on 11/8/2009
Skyline v0.5 Released on 9/24/2009
Skyline v0.5 Preview Updated on 8/14/2009
Skyline v0.5 Preview Updated on 7/7/2009
Skyline v0.5 Preview Released on 5/30/2009
The core focus of v0.5 is analysis of result data, building on the successful method creation features of v0.2. Our ASMS 2009 poster gives a broad overview of how we are using these features to extend the scope of our targeted proteomics research at the MacCoss Lab.
New features include:
- Scheduled and unscheduled transition list support for instruments from:
- Agilent
- Applied Biosystems
- Thermo Fisher
- Waters
- Import of results data for instruments from:
- Agilent (native)
- Applied Biosystems (native)
- Thermo Fisher (native)
- Waters (native with MassLynx 4.1 installed)
- All of the above converted to mzML or mzXML
- Share methods and results across labs with different instruments, using Skyline's high-performance, compact data caching
- Build your own spectral libraries from Mascot and X! Tandem search results
- Multiple sample replicates, and multiple replicate import
- Chromatogram plotting with dynamic layout for multi-replicate viewing
- Peak detection and advanced peak picking
- Peak quality indicators
- Isotope labeling ratios
- Advanced peak integration editing
- Dynamic report designer
- Retention time analysis views:
- Linear regression
- Replicate comparison
- Scheduling
Skyline v0.2 Released on 2/17/2009
Skyline is a Windows client application for building Selected Reaction Monitoring (SRM) methods. It aims to employ cutting-edge technologies for creating and iteratively refining SRM methods for large-scale proteomics studies. The latest version of Skyline contains support for:
- Full featured SRM method editing
- Transition list export for Thermo Finnigan TSQ and ABI Q-Trap
- Retention time prediction
- Isotope labeling
- Spectral libraries (NIST, GPM, BiblioSpec)
- Building spectral libraries from your results in TPP pepXML/mzXML
Skyline edits its own universal method format document (saved in XML), and can export transition lists for a variety of instruments. For large, un-refined methods these may be multiple lists per document.
Tutorials
Try one of these tutorials, and get hands-on experience using Skyline with real data.
Introductory

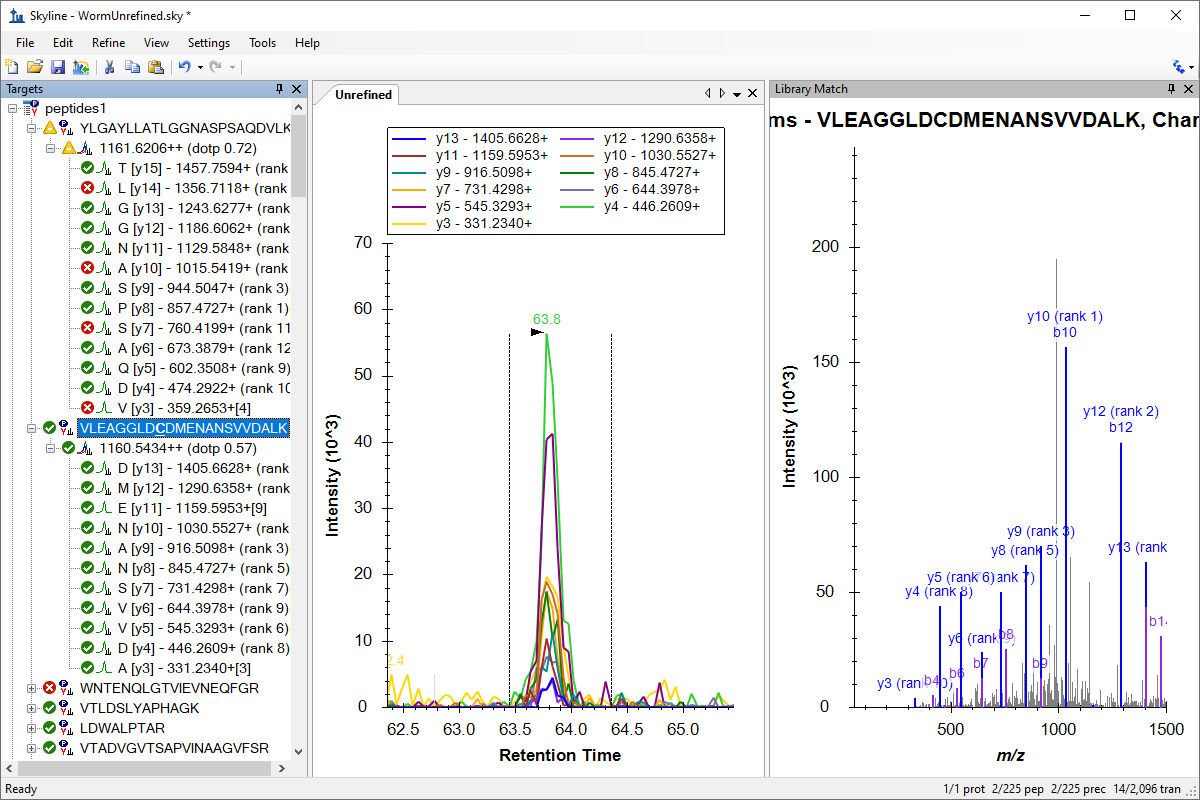


Introduction to Full-Scan Acquisition Data


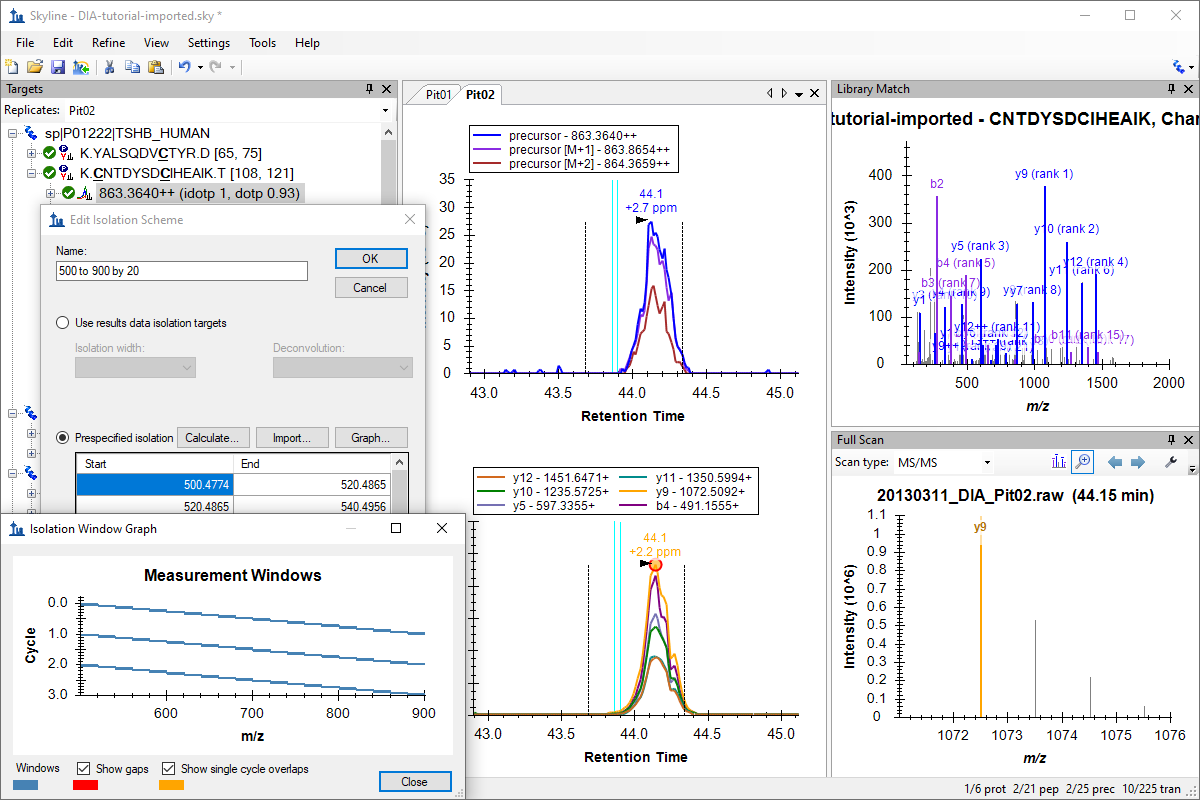
Full-Scan Acquisition Data


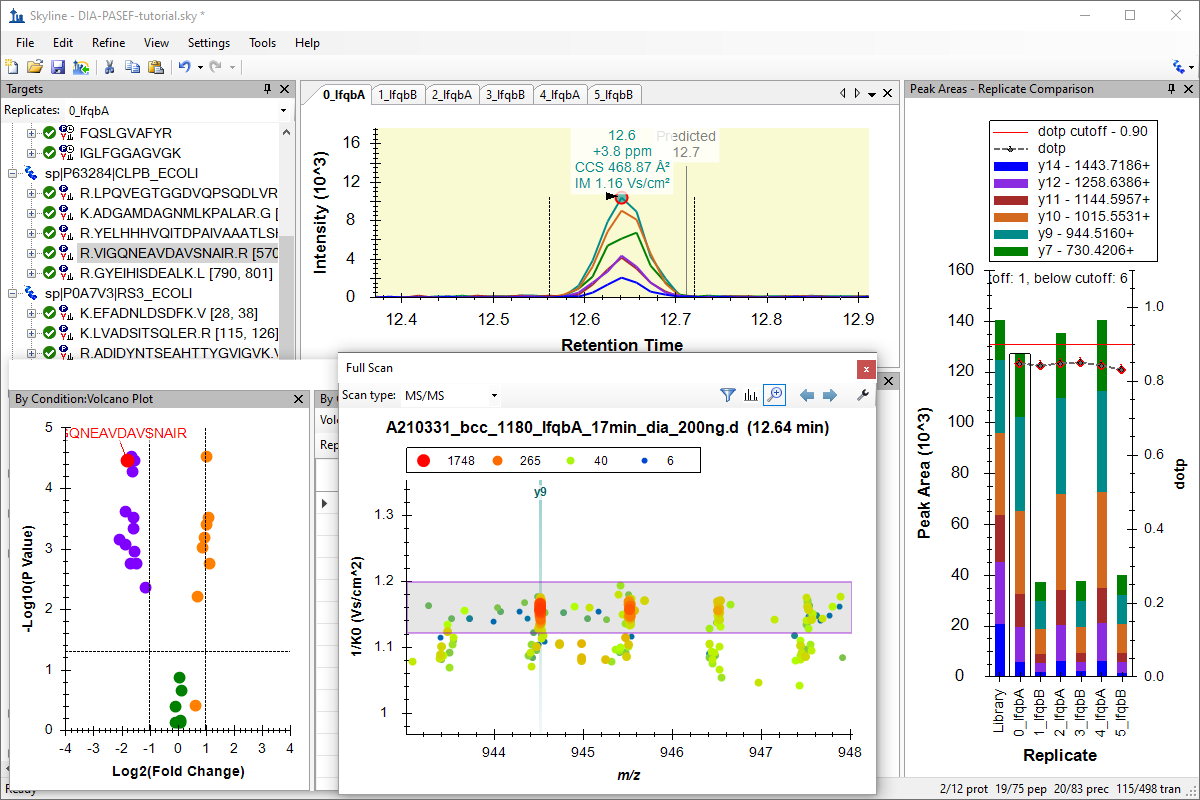

Small Molecules


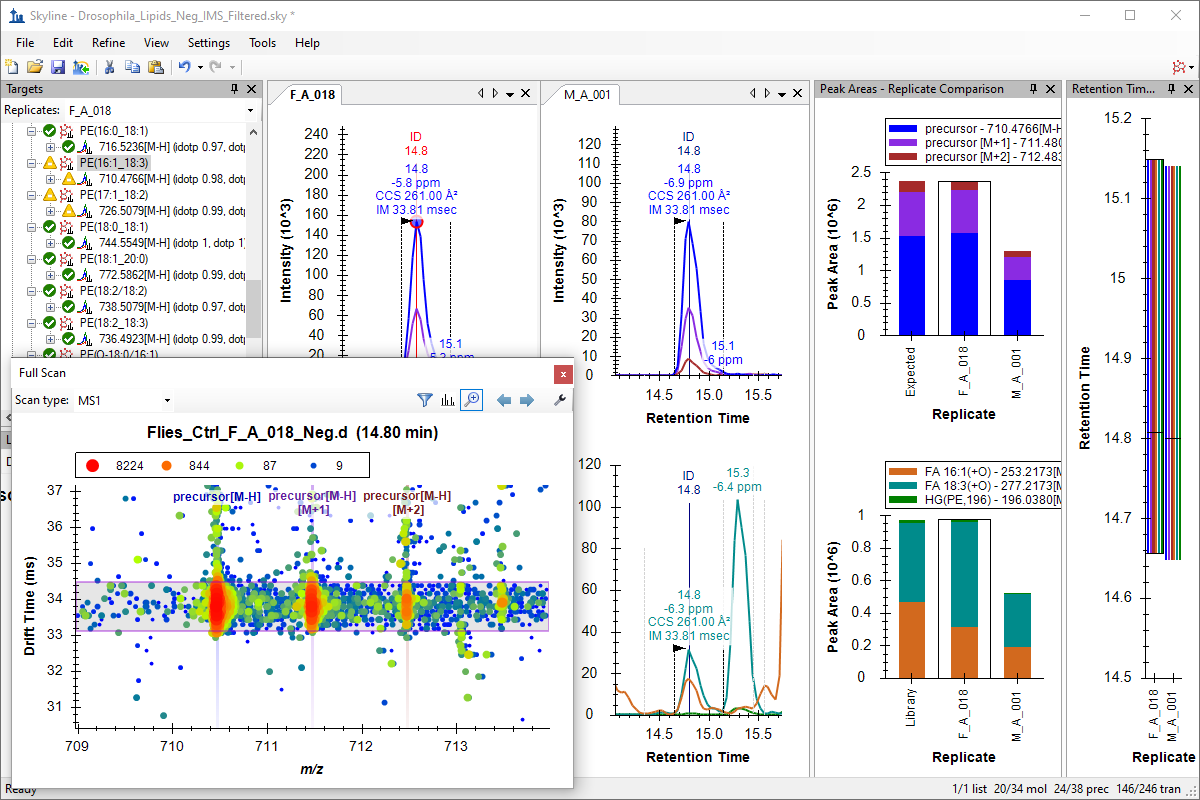
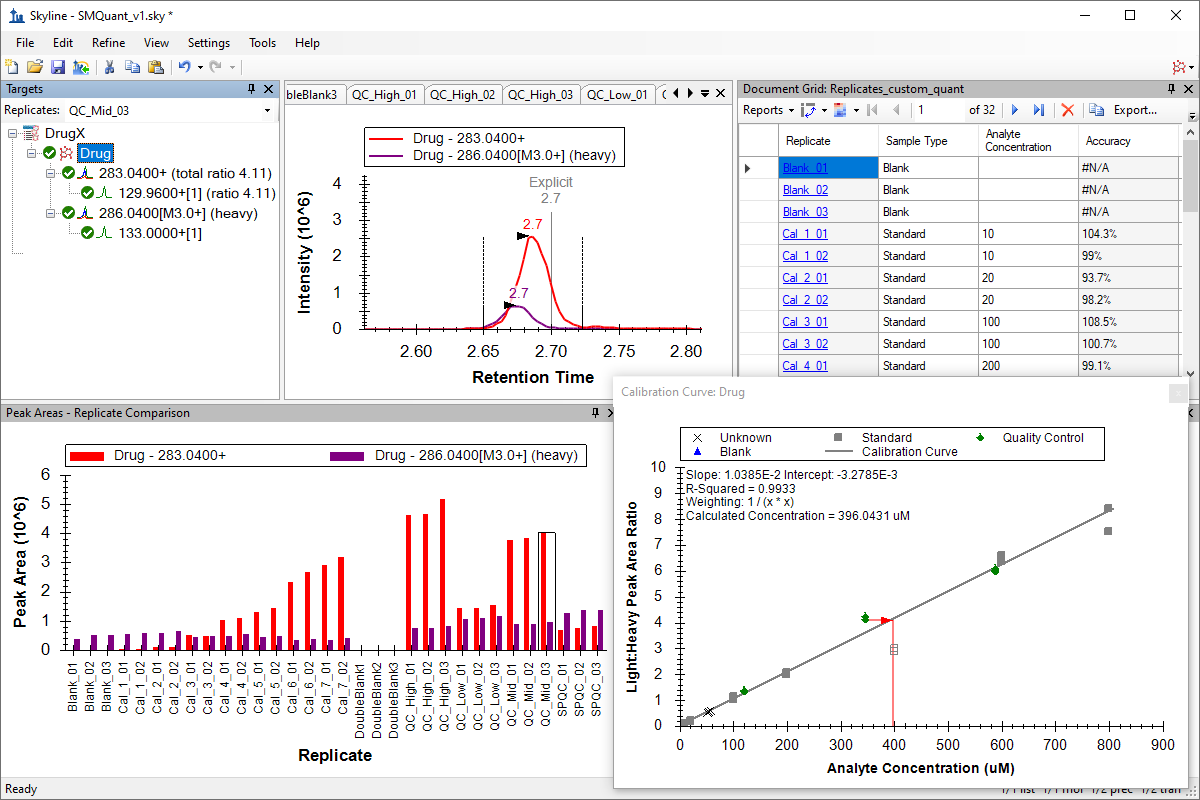

Advanced Topics
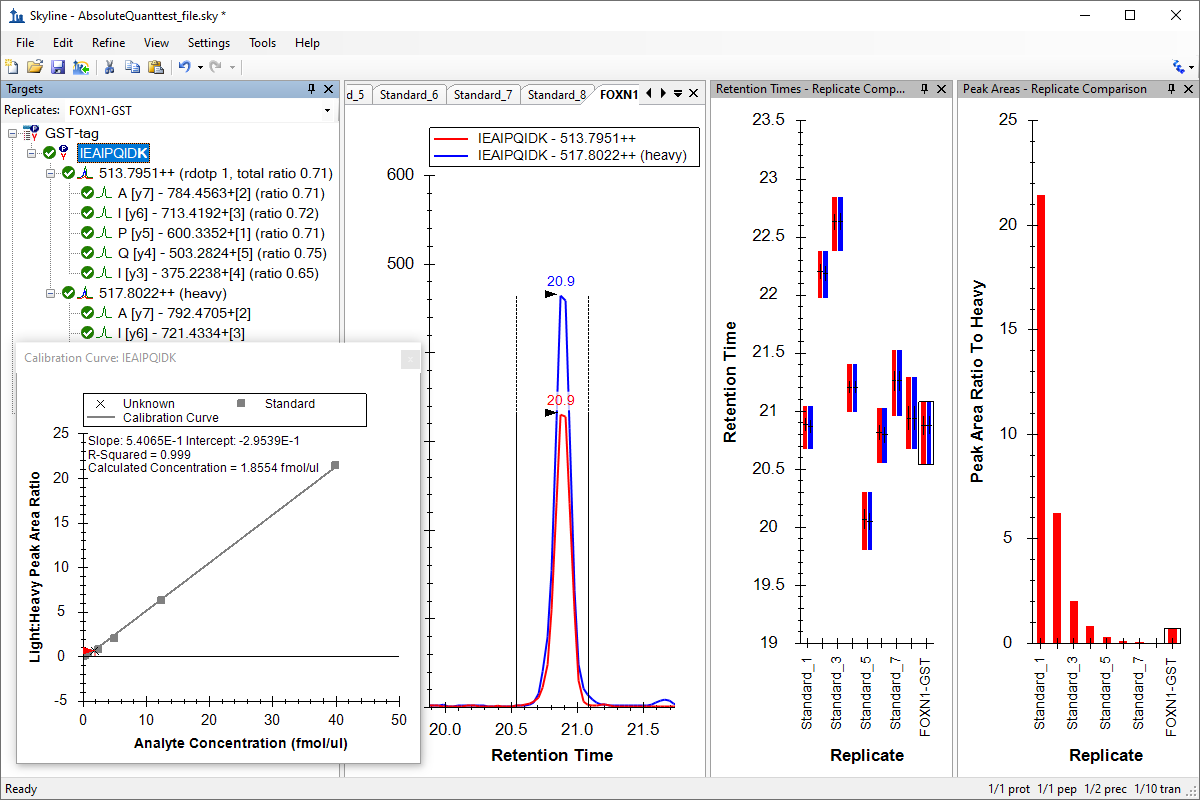


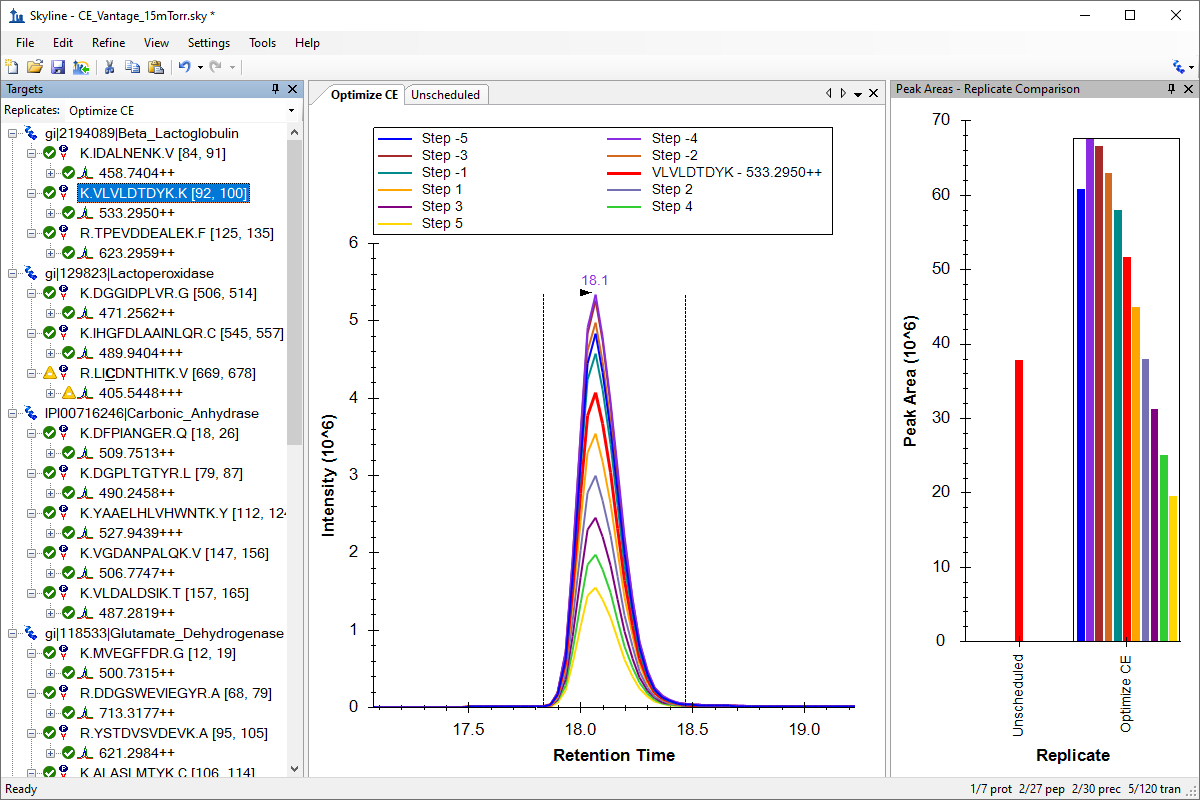

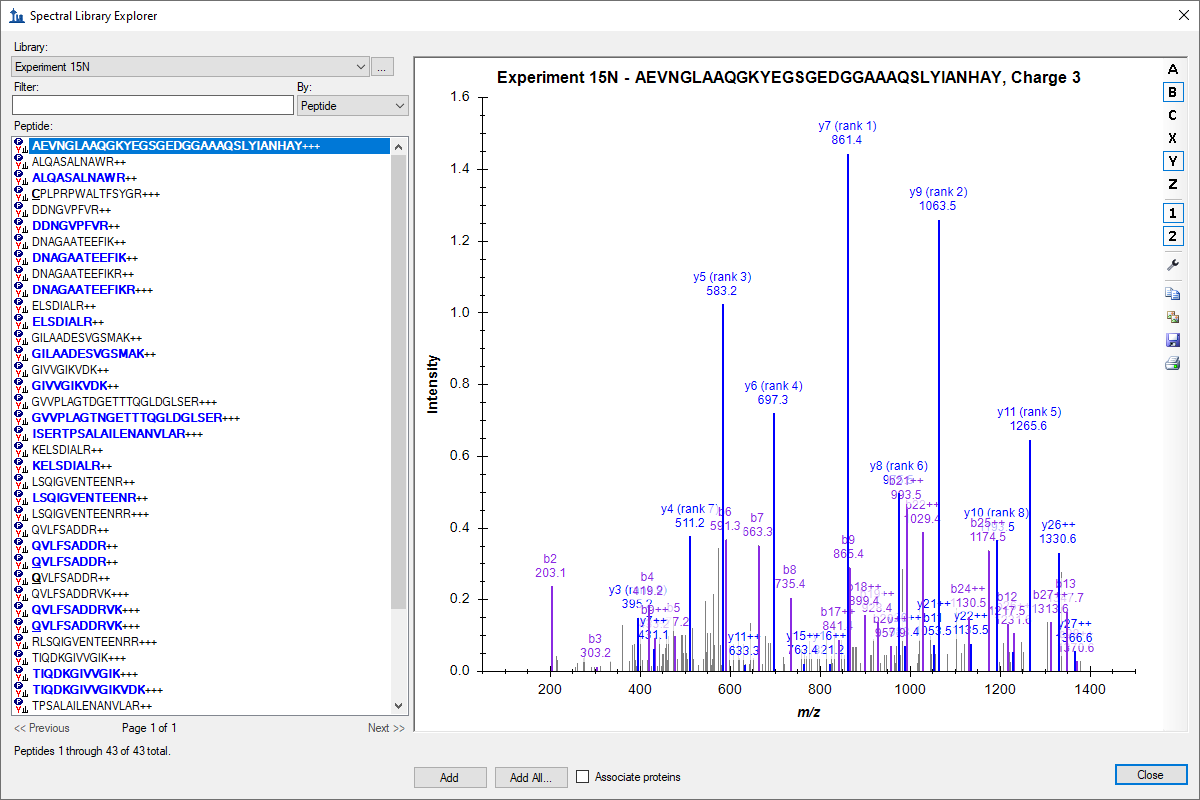
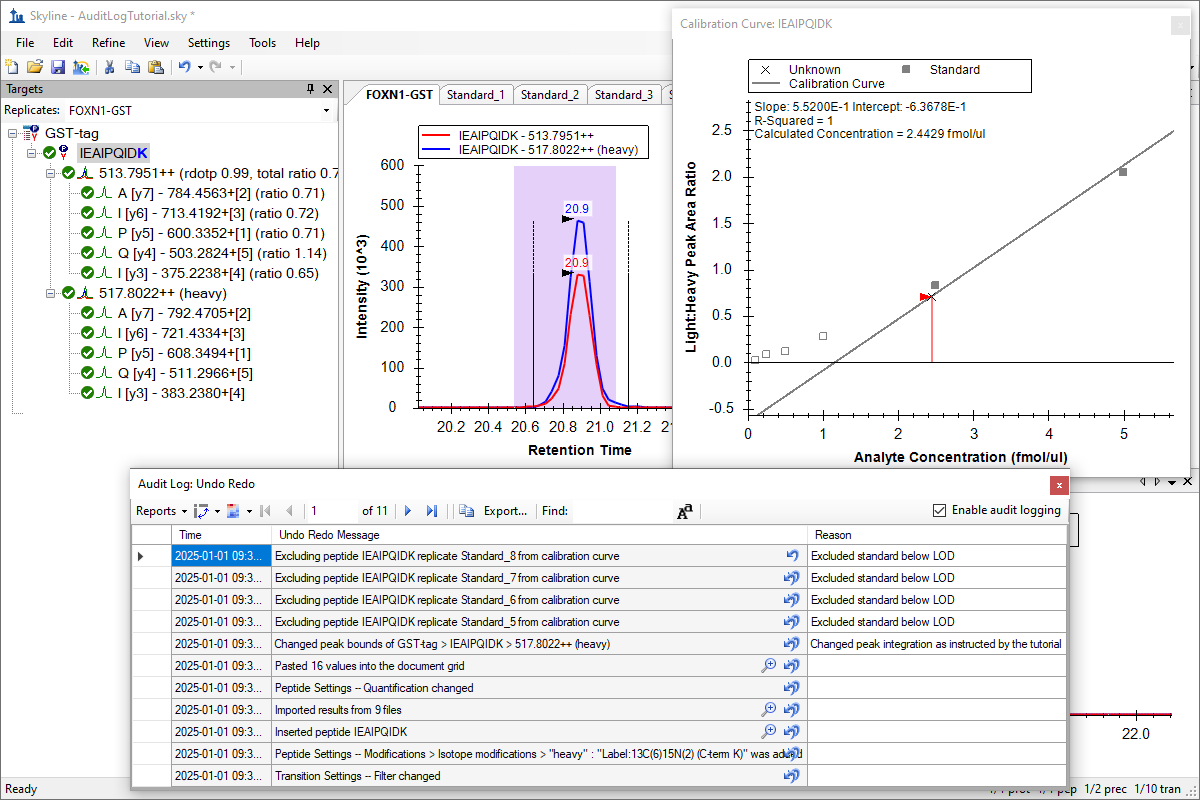
教程 (中国语文)
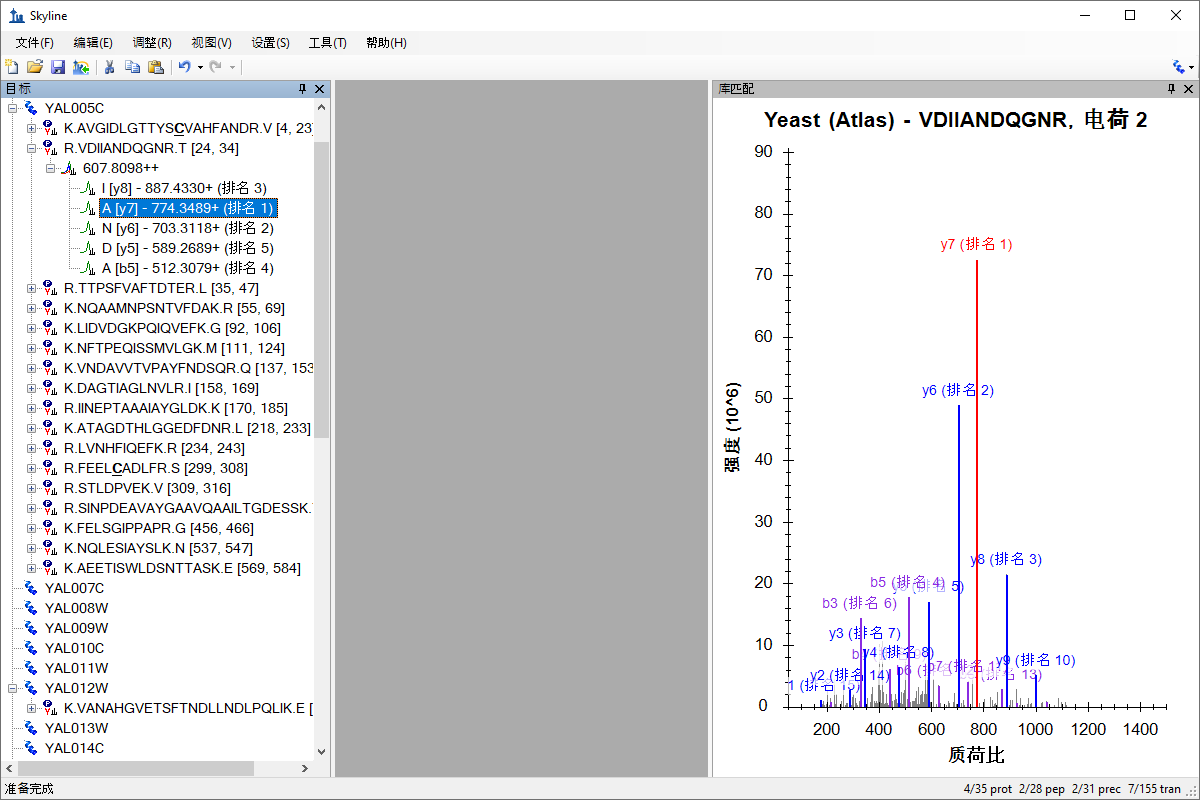
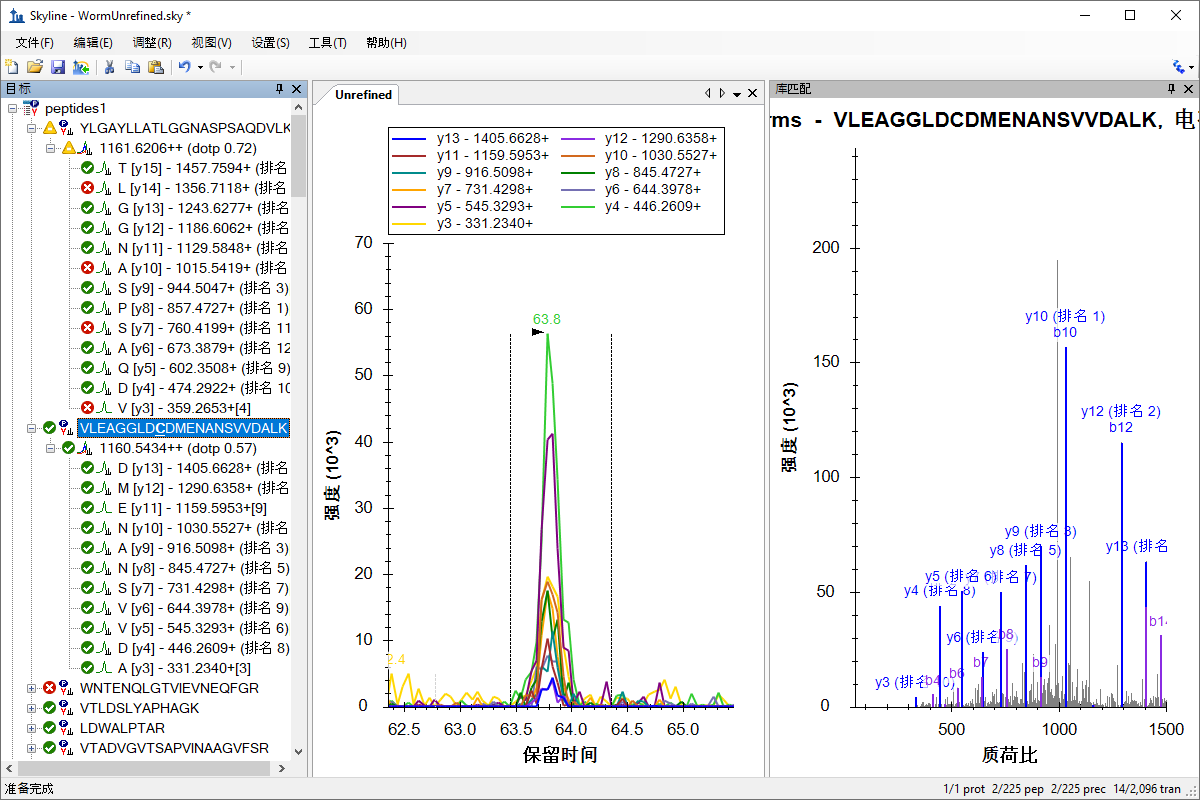
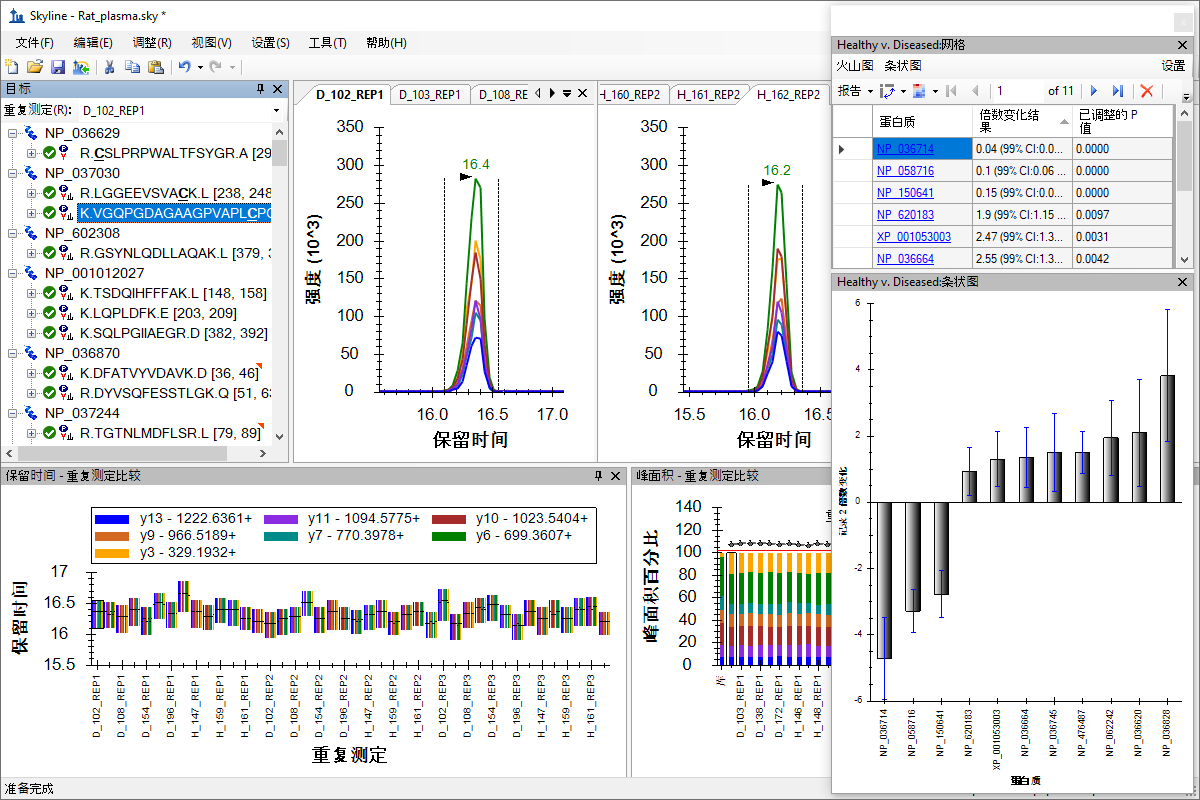
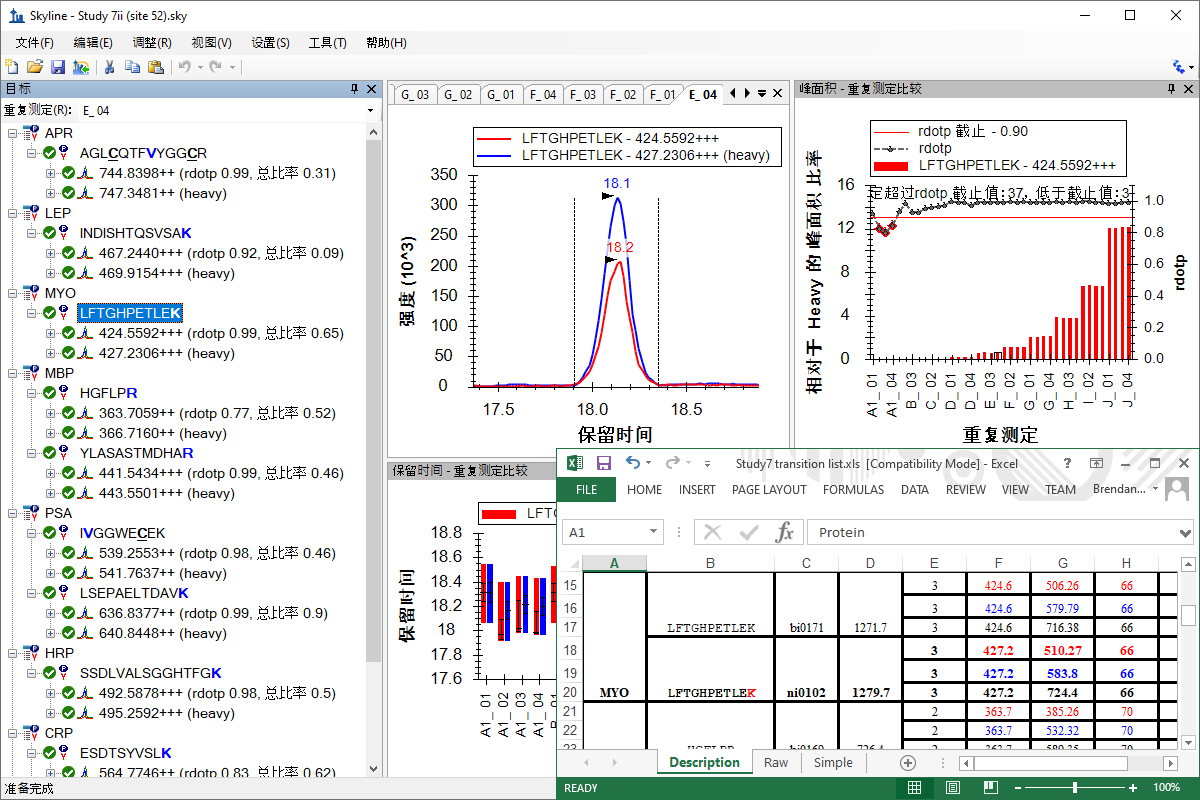
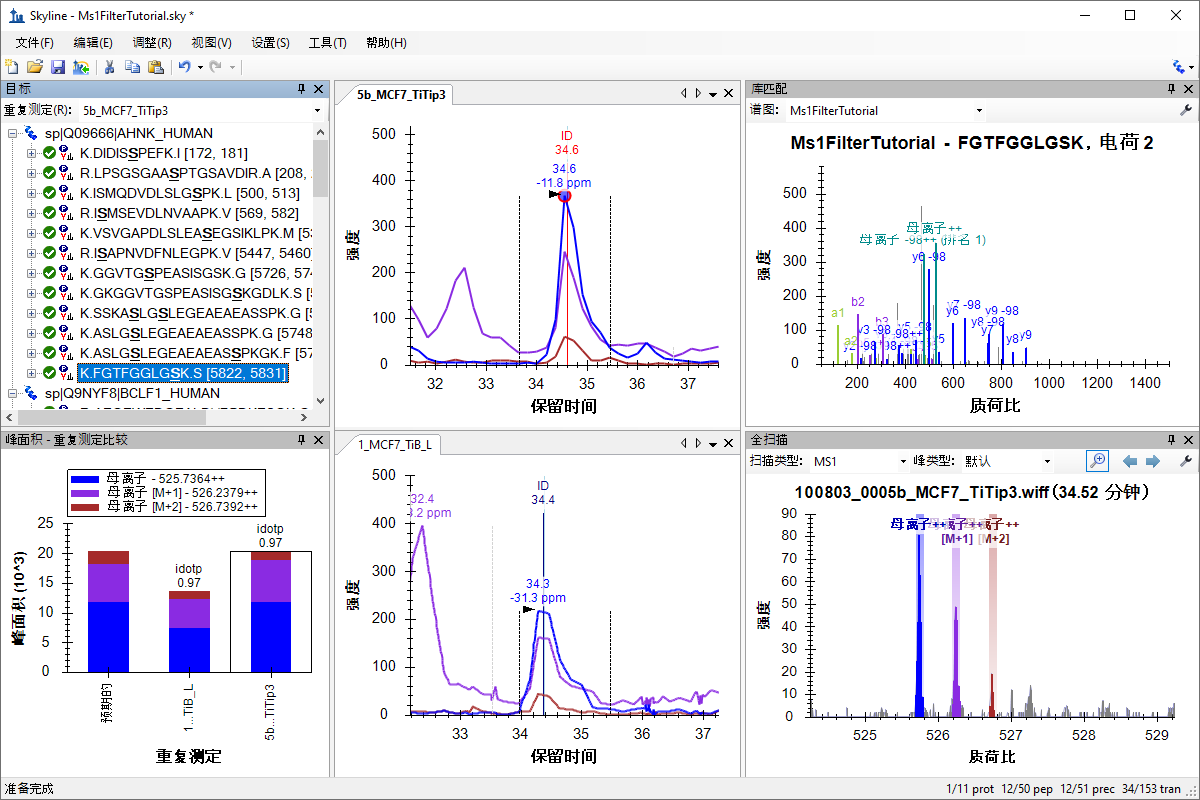
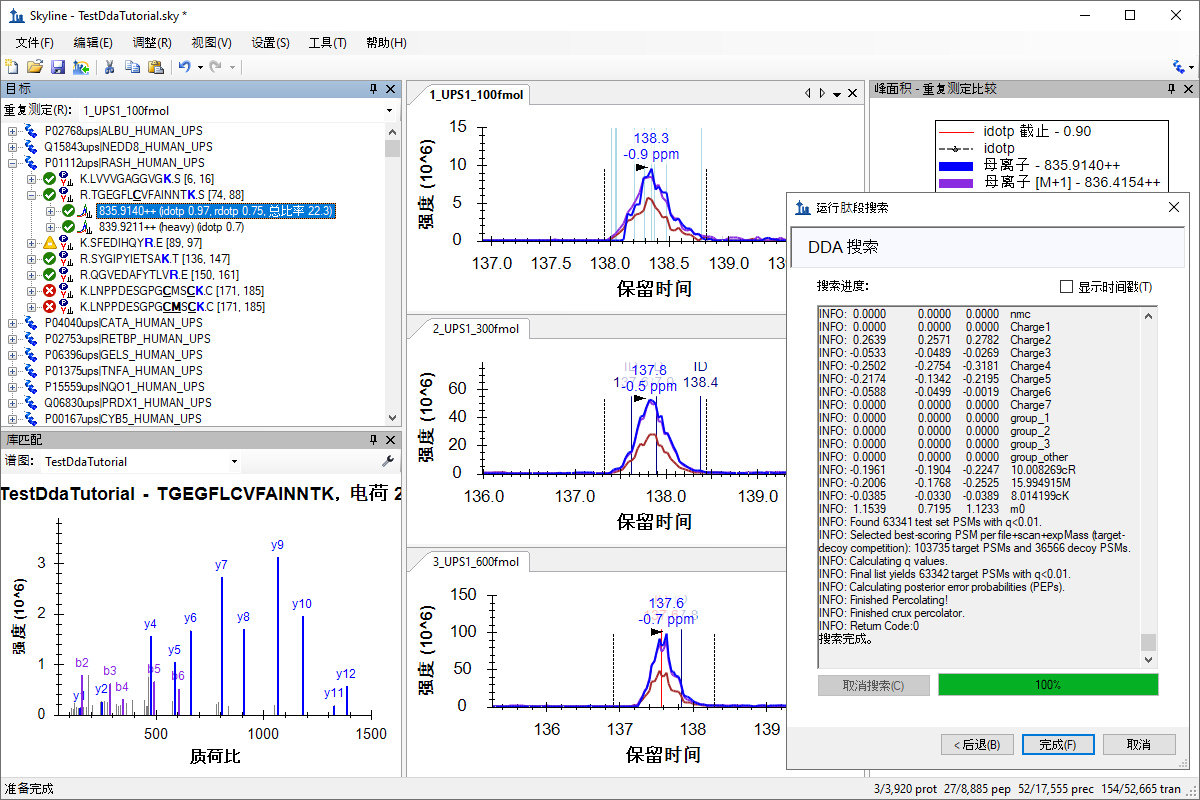
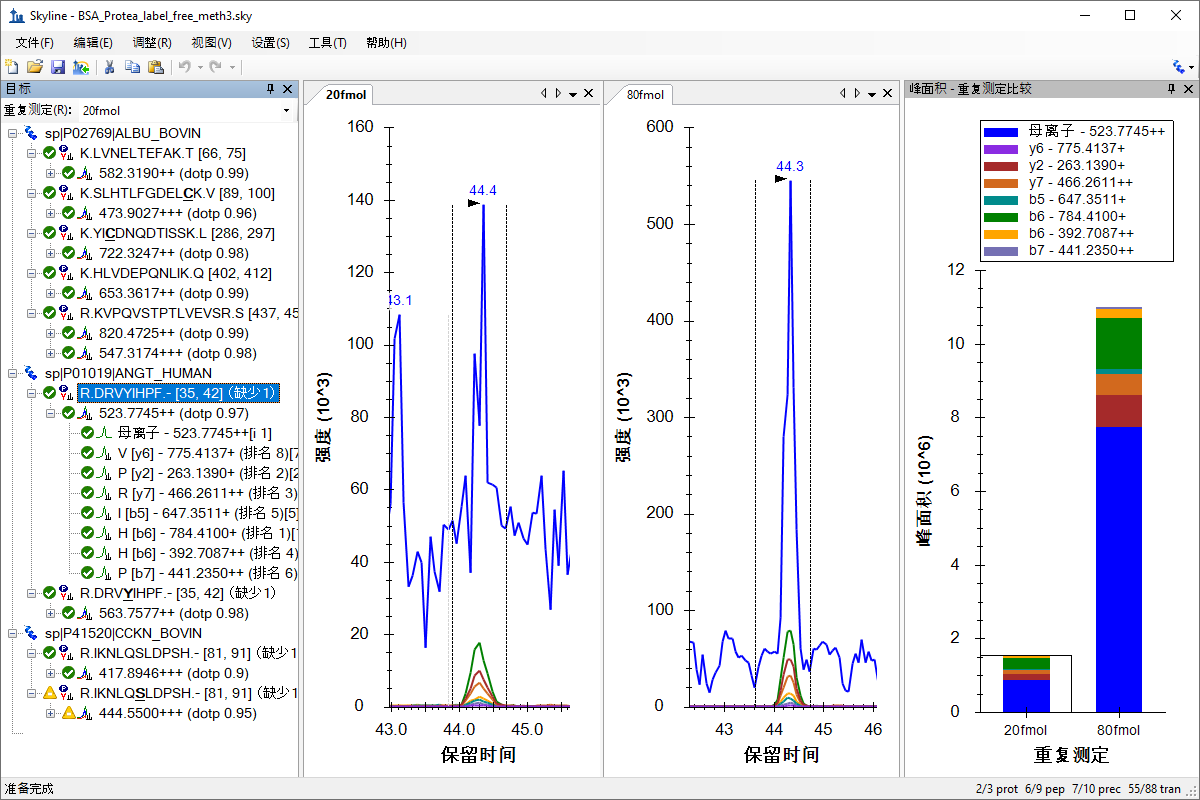
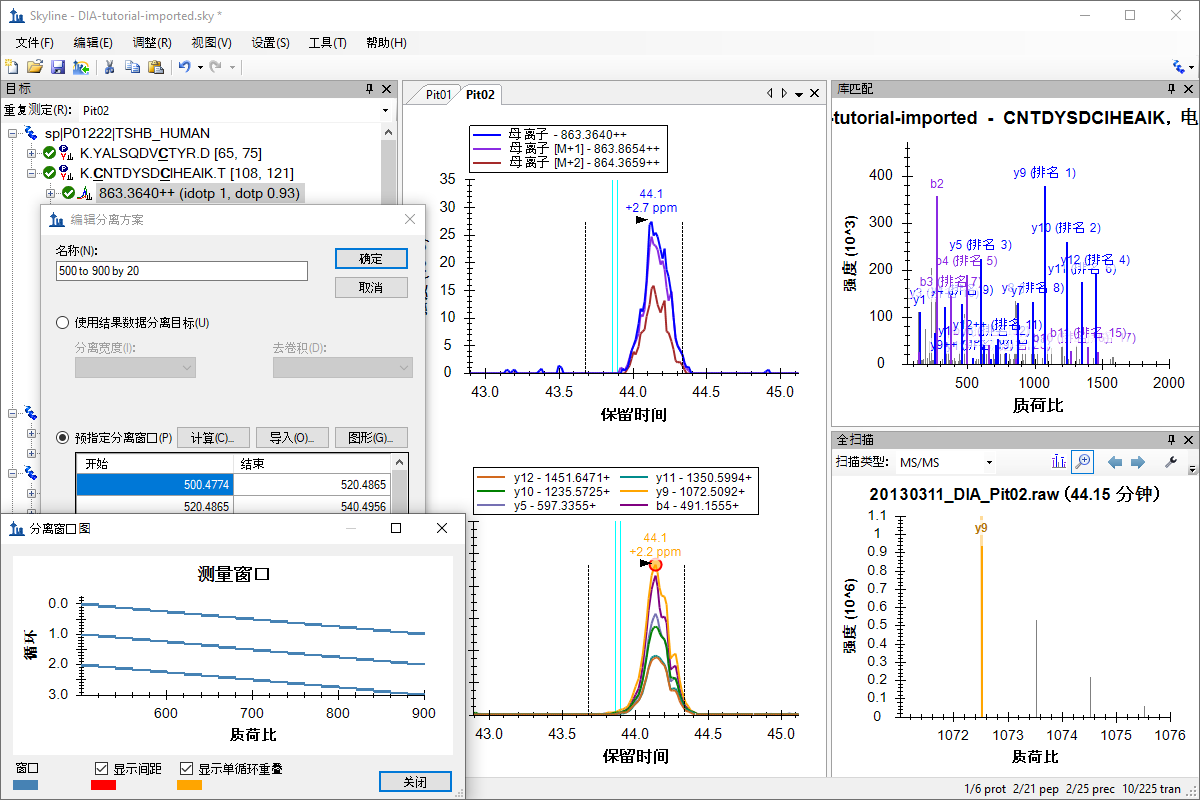
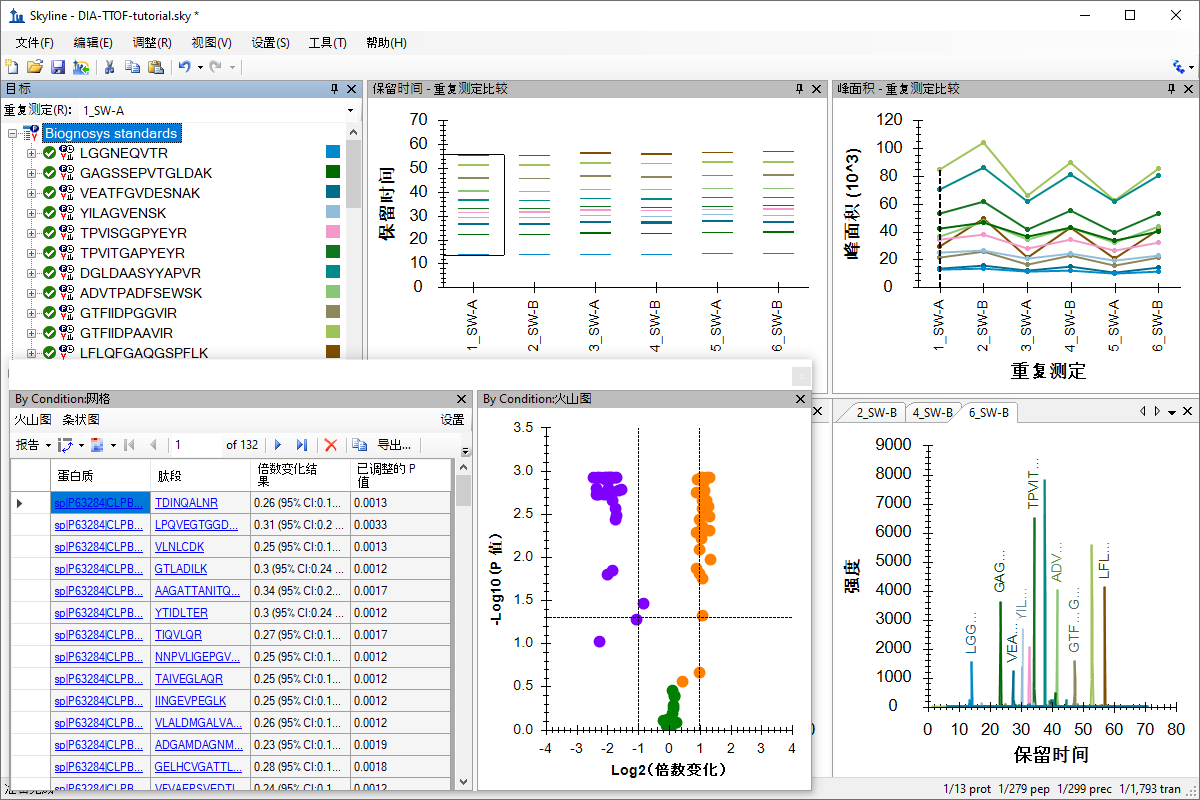
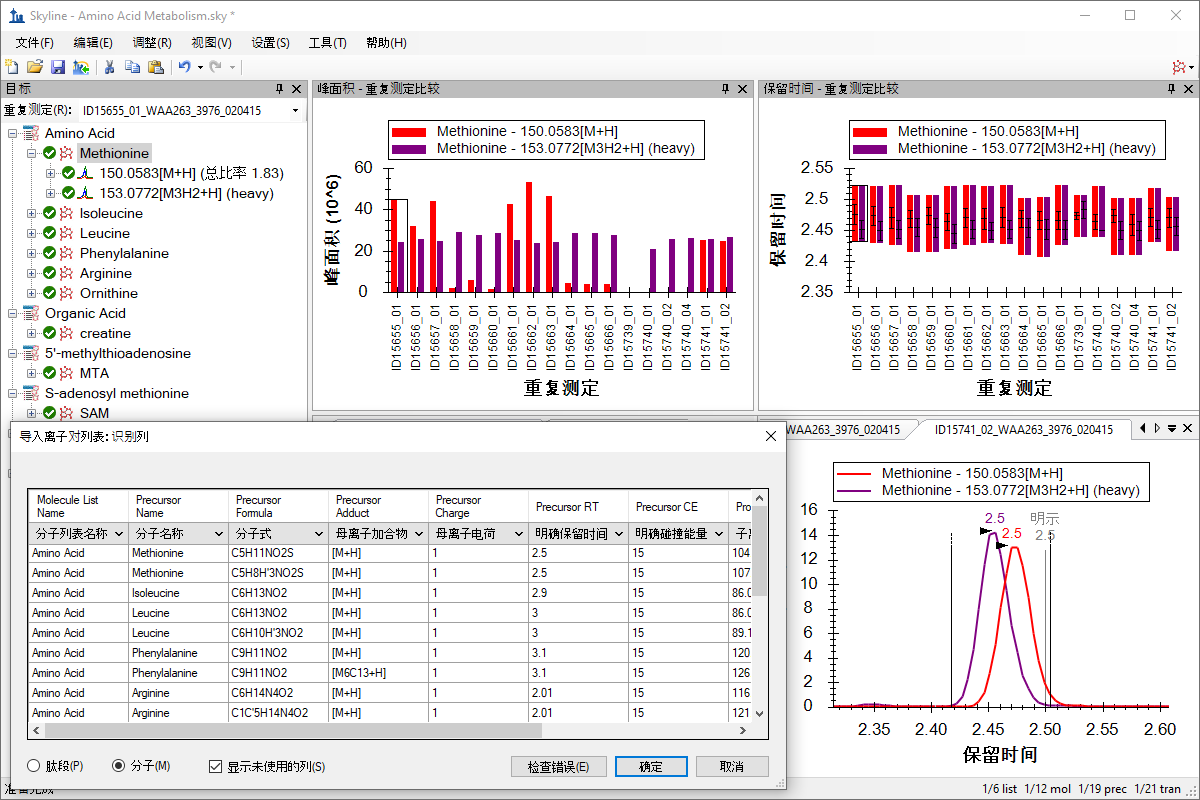
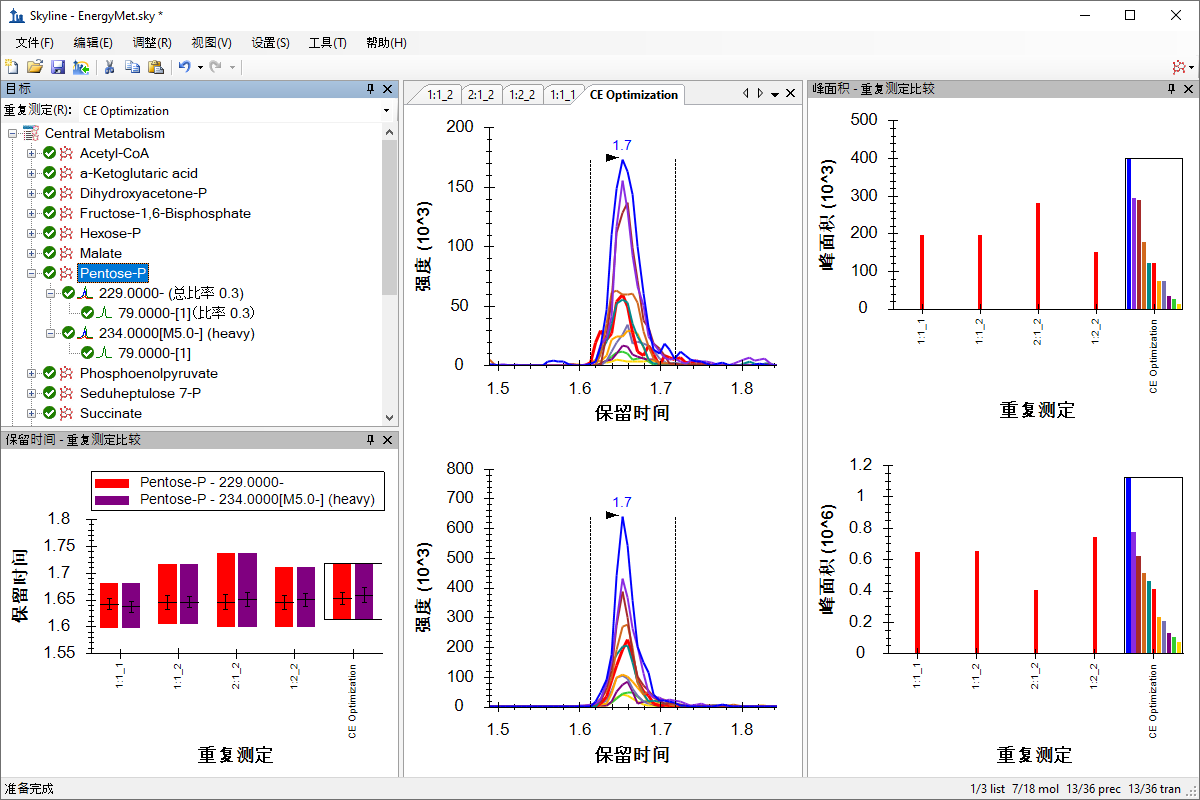

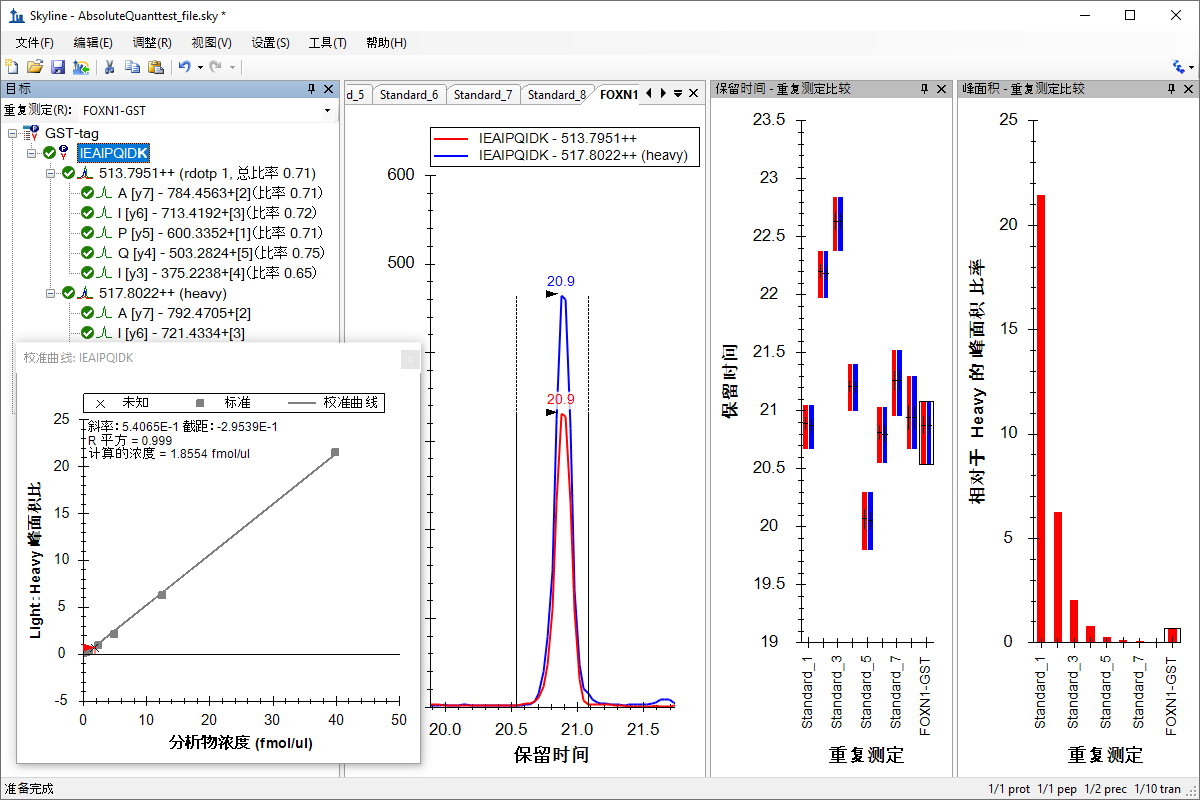
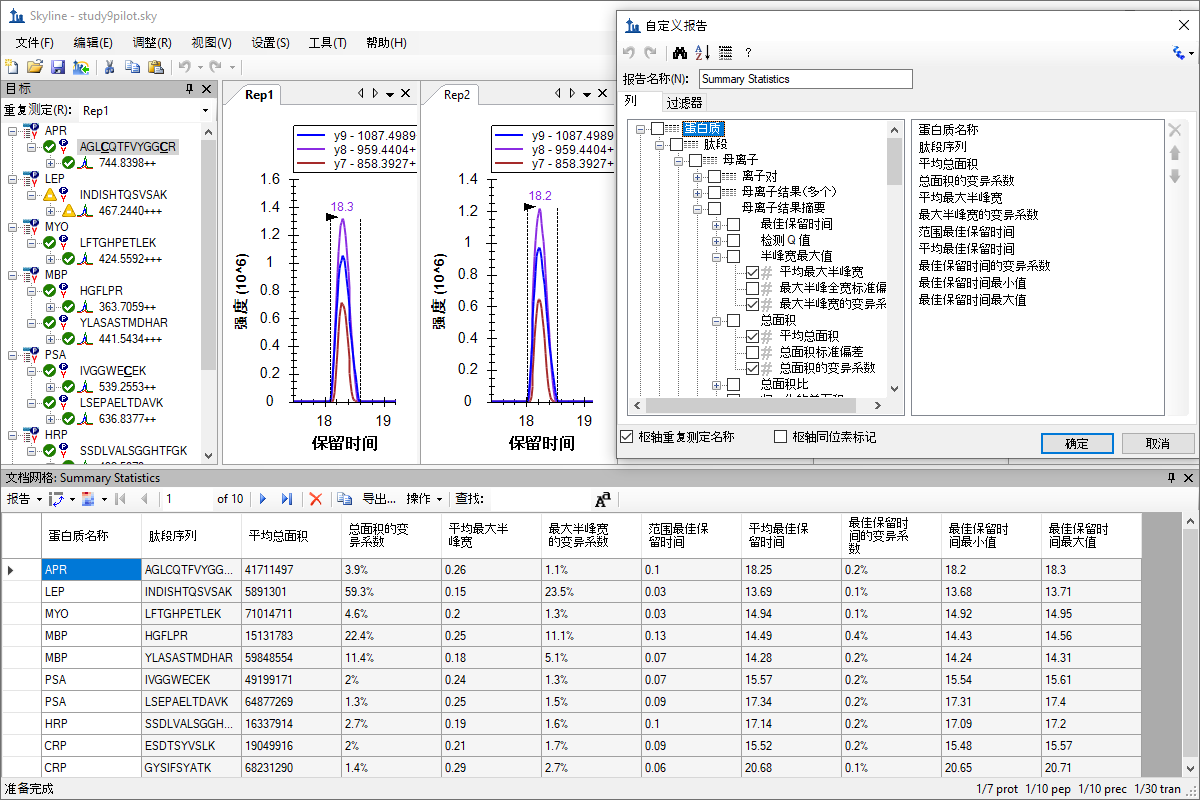

靶向 方法编辑

靶向方法优化
分析分类研究的数据
处理已有定量实验数据
MS1 全扫描筛选
针对 MS1 筛选的 DDA 搜索
并行反应监测 (PRM)
非数据依赖型采集
SWATH 数据分析
以 Navarro, Nature Biotech 2016 基准论文为依据,使用为指示说明而创建的三物种混合数据集,获得从 Q Exactive 或 TripleTOF 仪器中采集的数据独立采集 (DIA) 数据的实际操作处理经验。对 DIA 使用“导入肽段搜索”向导以根据 DDA 数据构建谱图库,期间对保留时间校准进行自动 iRT 校准,并对肽段峰值检测采用 mProphet 学习模型。采用“保留时间”、“峰面积”、“质量精度”和 CV 等丰富的 Skyline 摘要图评估数据质量。最后进行群组比较,并对通过数据获取每个物种预期比率的效果进行评估。(31 页)
| Thermo Q Exactive | SCIEX TripleTOF | |
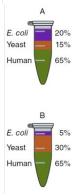 | 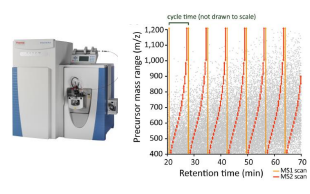 | 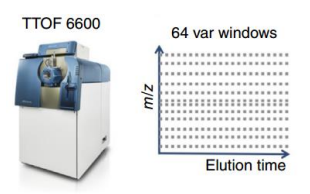 |
Q Exactive SWATH 数据分析
TripleTOF SWATH 数据分析
小分子目标

小分子方法开发与 CE 优化
小分子定量
绝对定量
自定义实时报告
iRT 保留时间预测
チュートリアル(日本語版)
これらのチュートリアルでは,実際のデータを用いた解析をご自身の環境で経験いただくことができます。
入門編

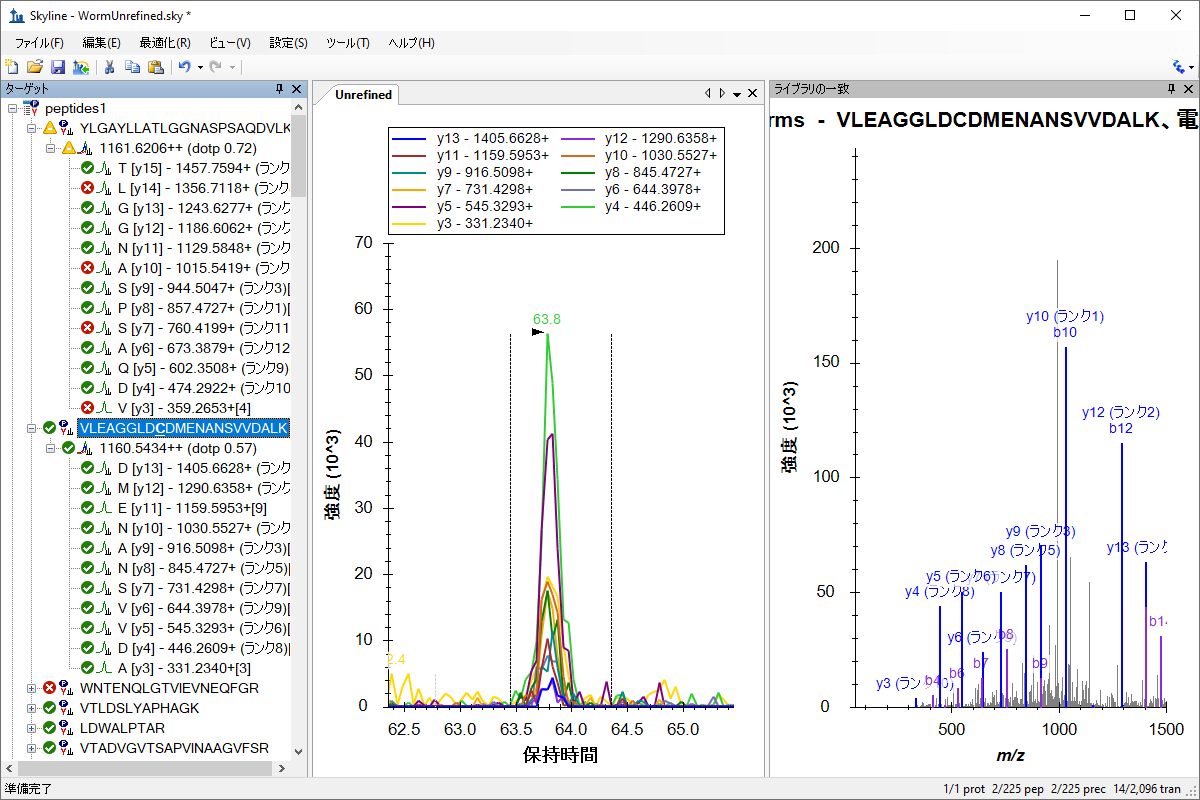
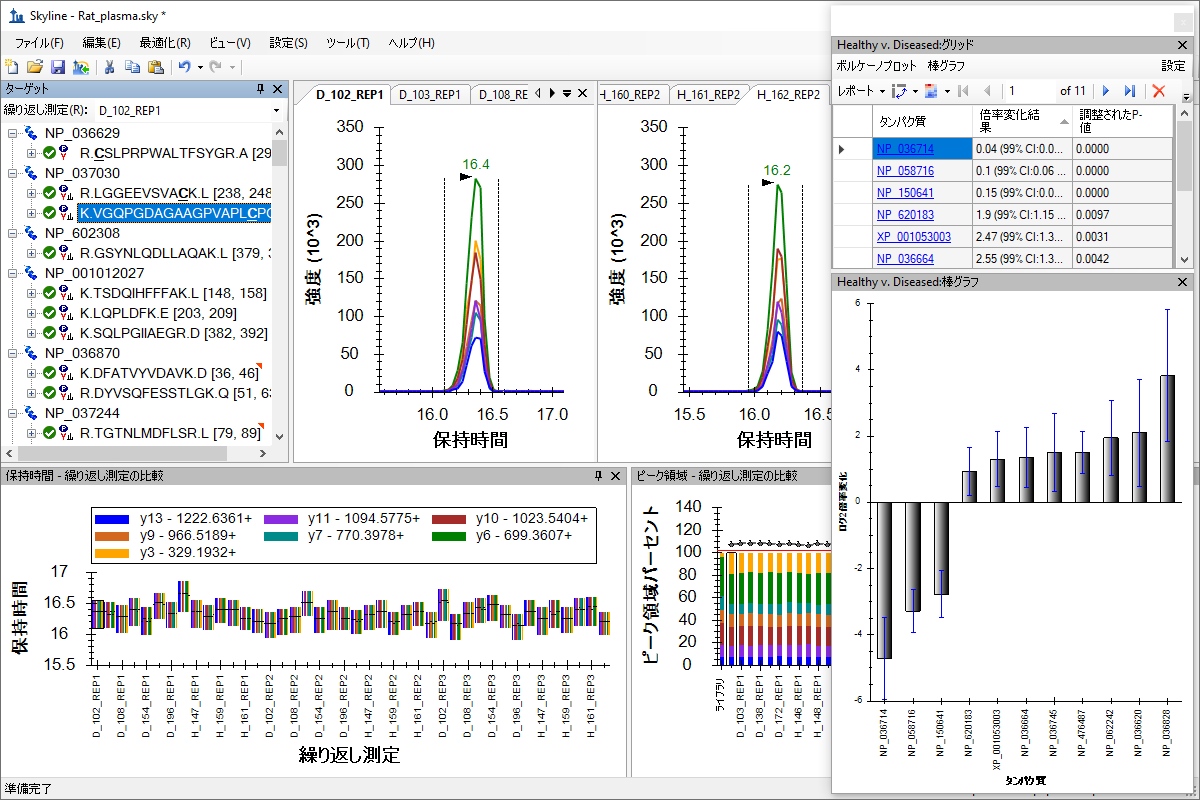
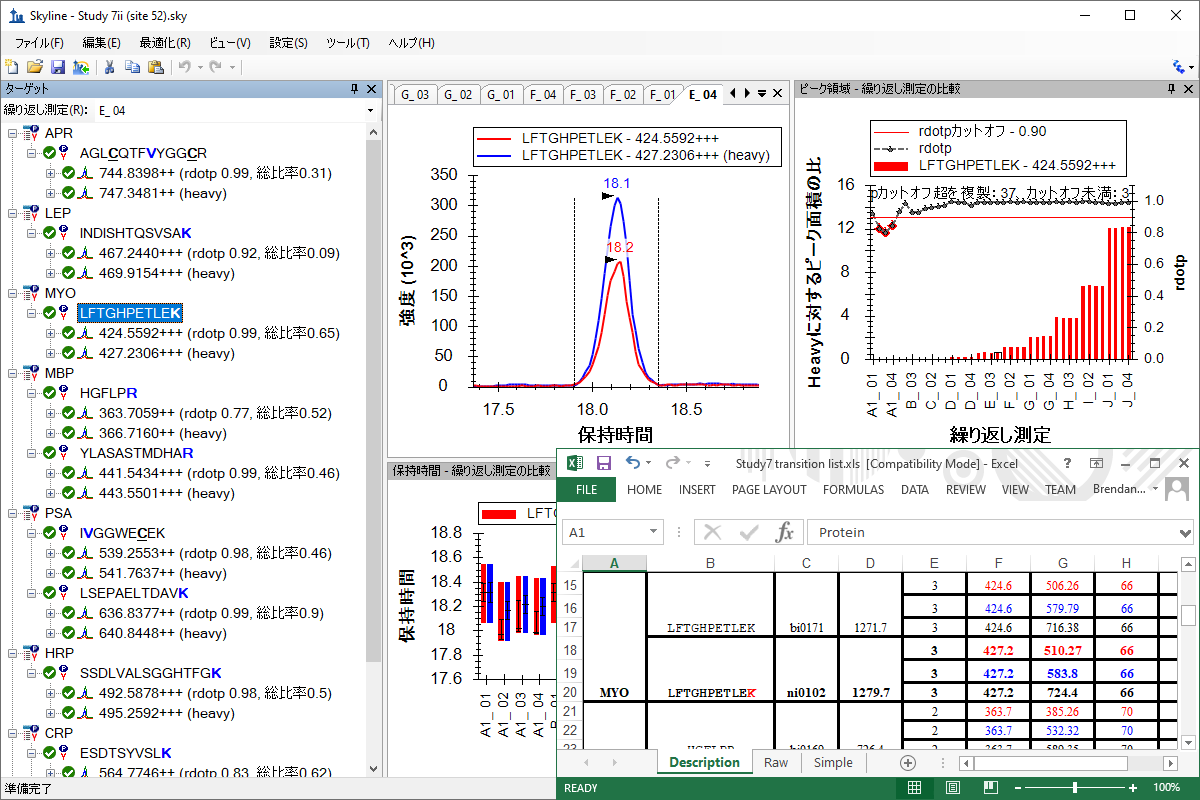
フルスキャン測定データの解析
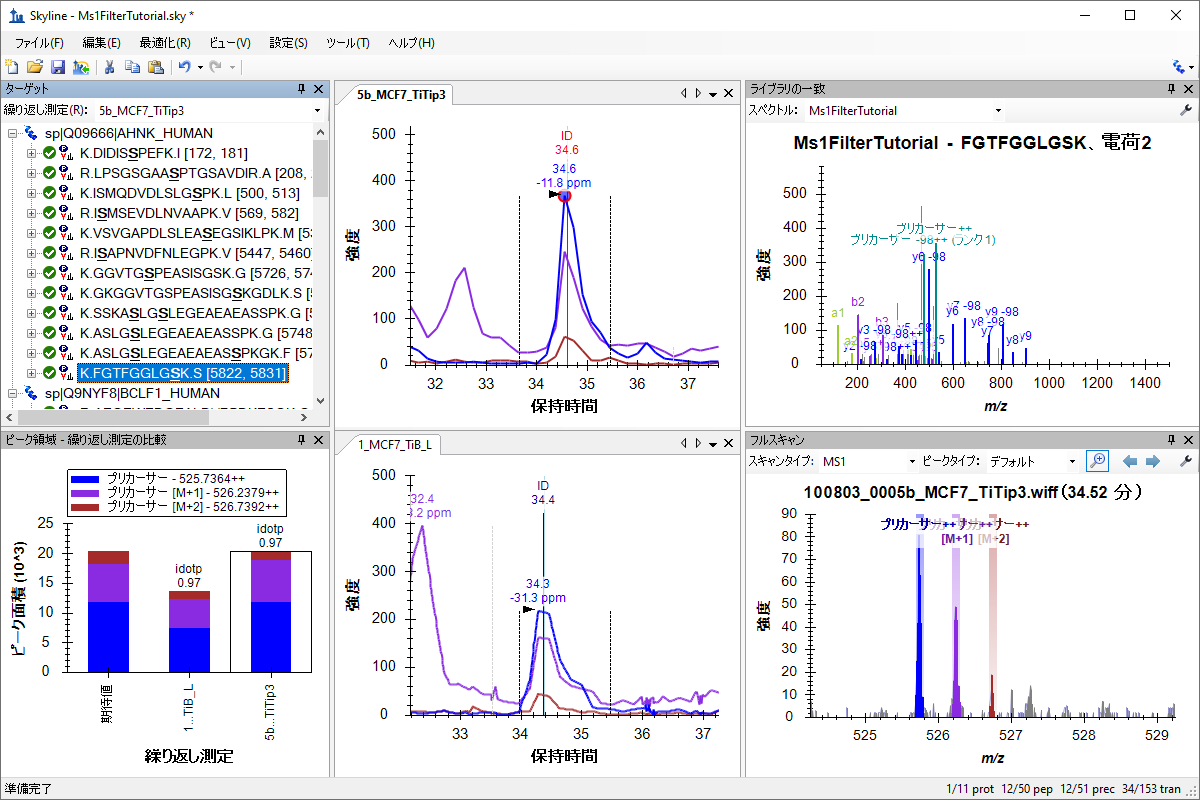
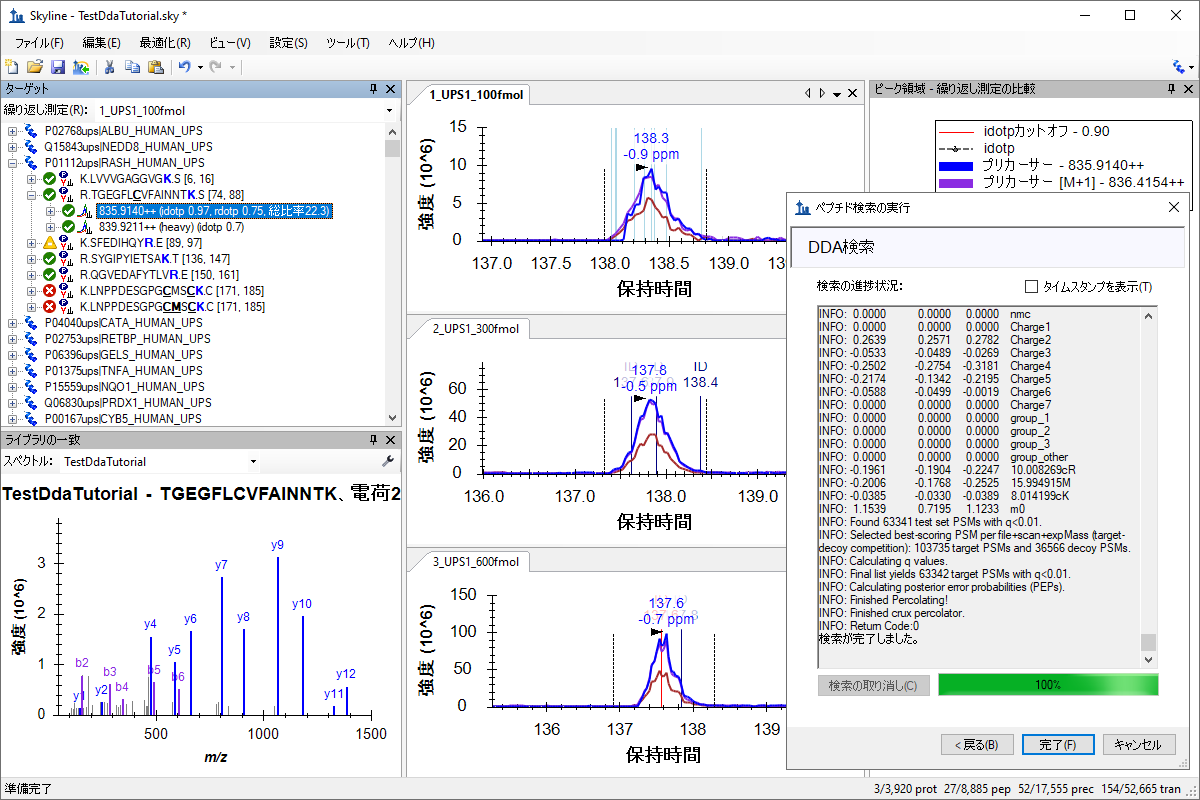
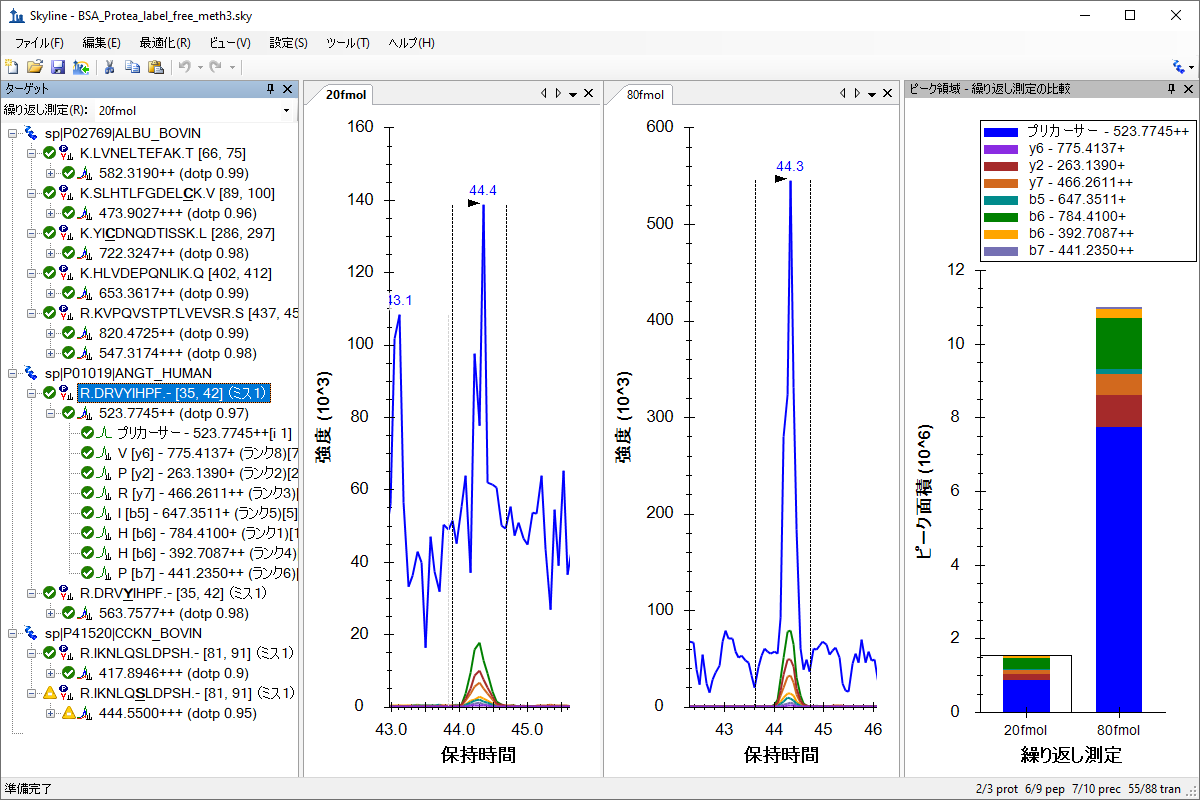

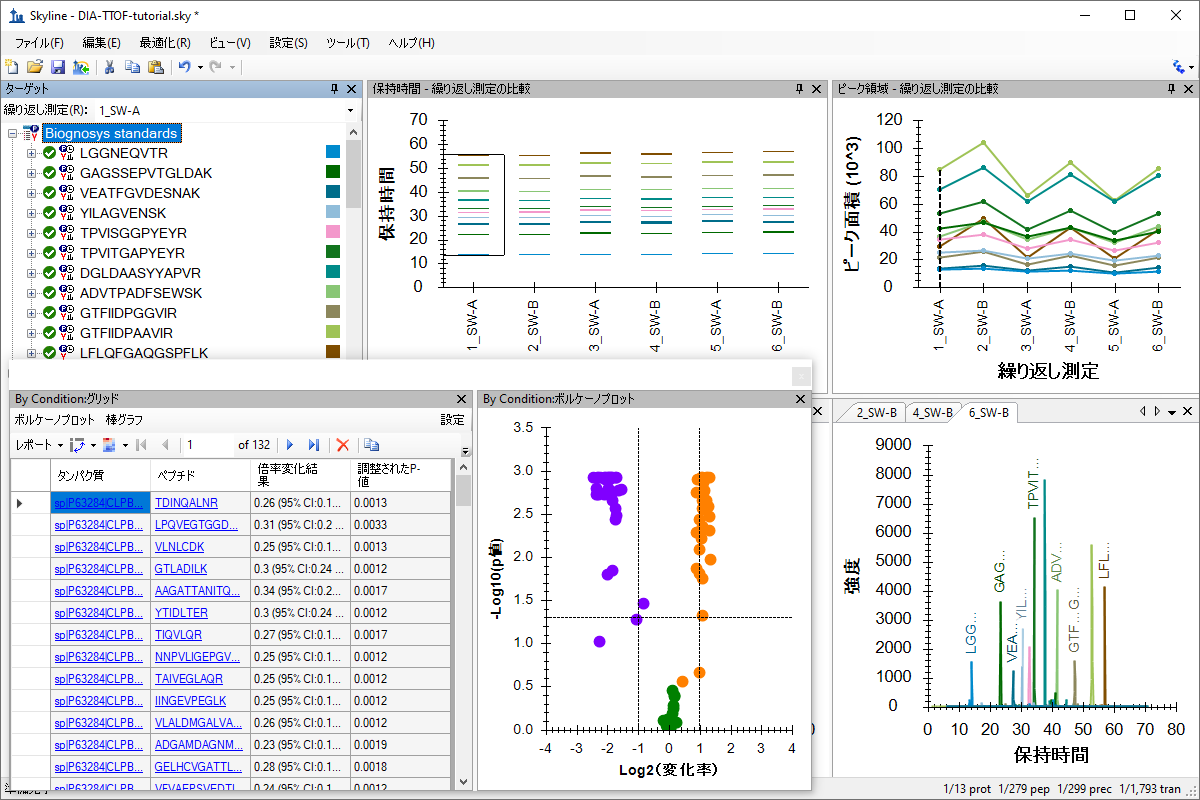
小分子タ
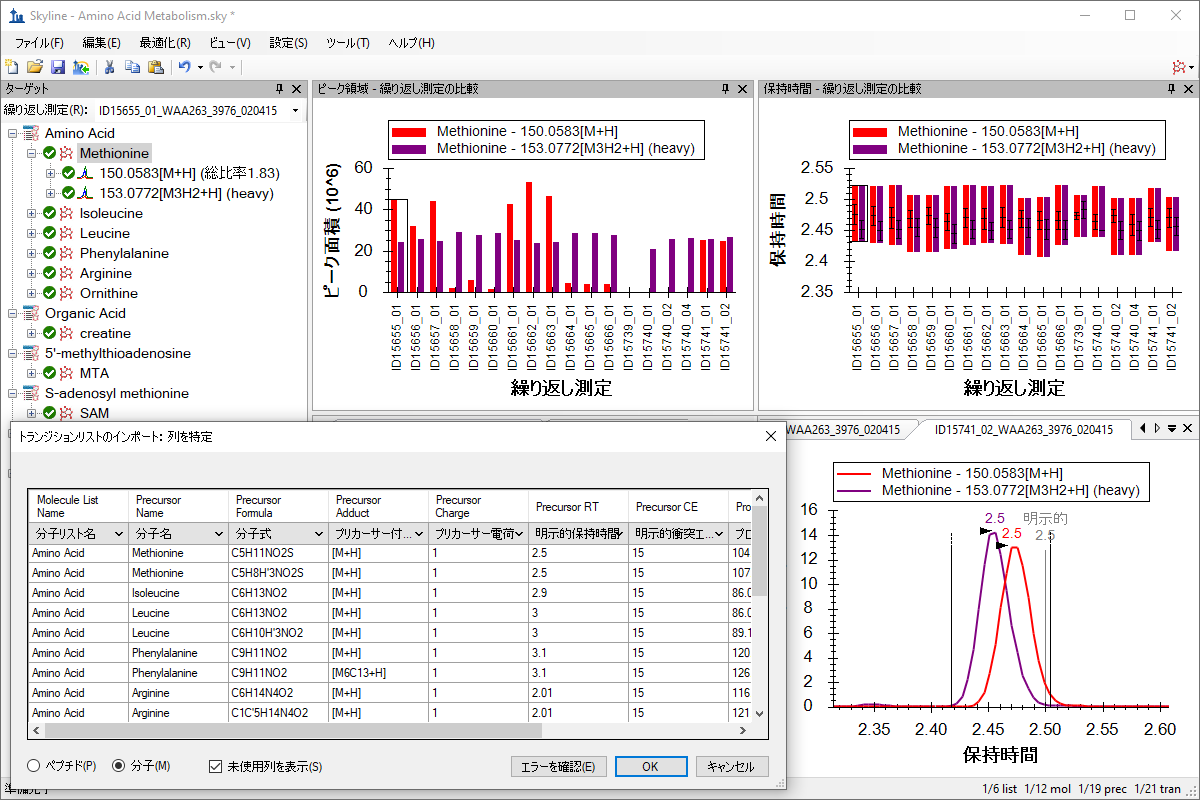
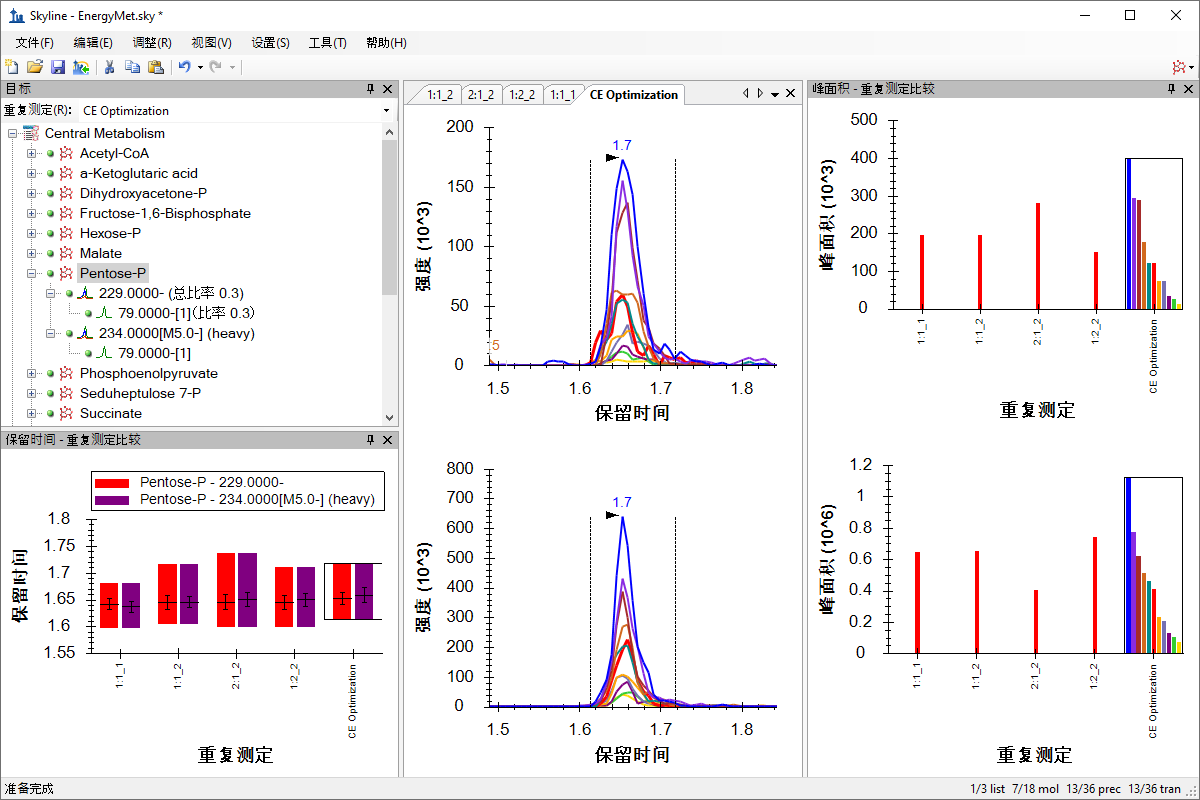
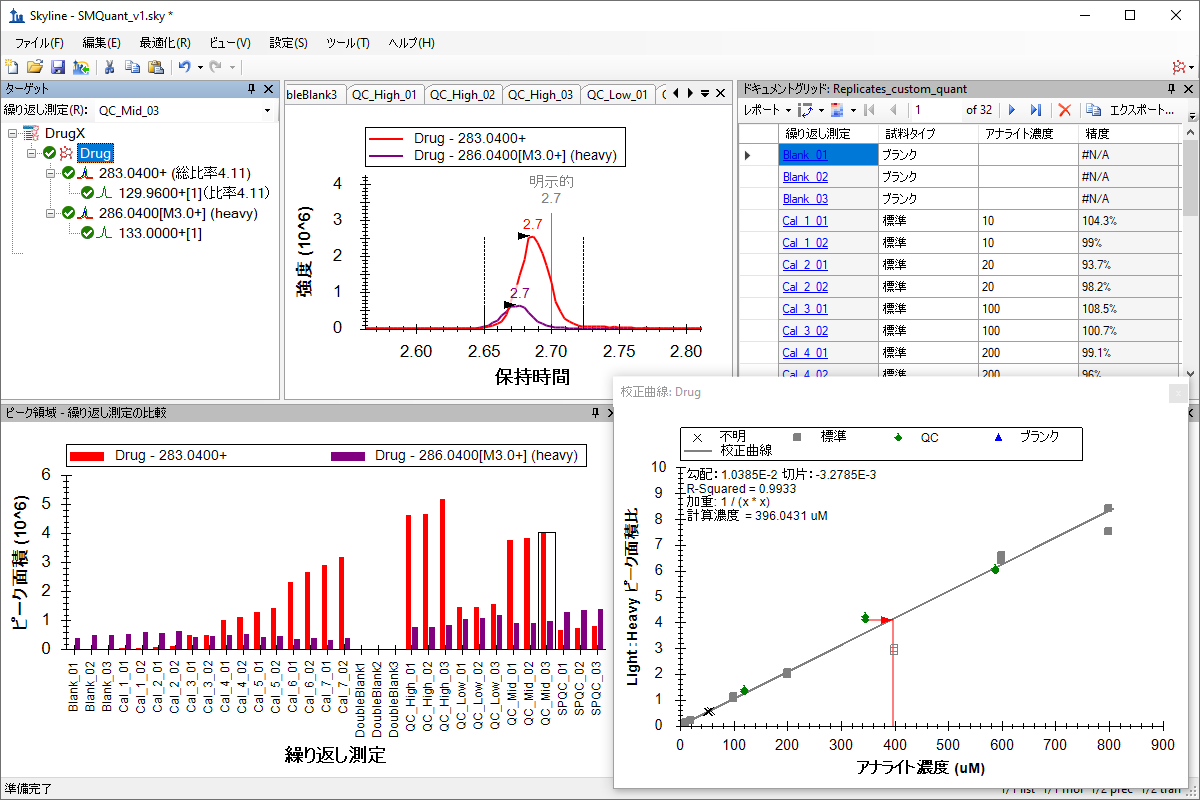
上級者向け
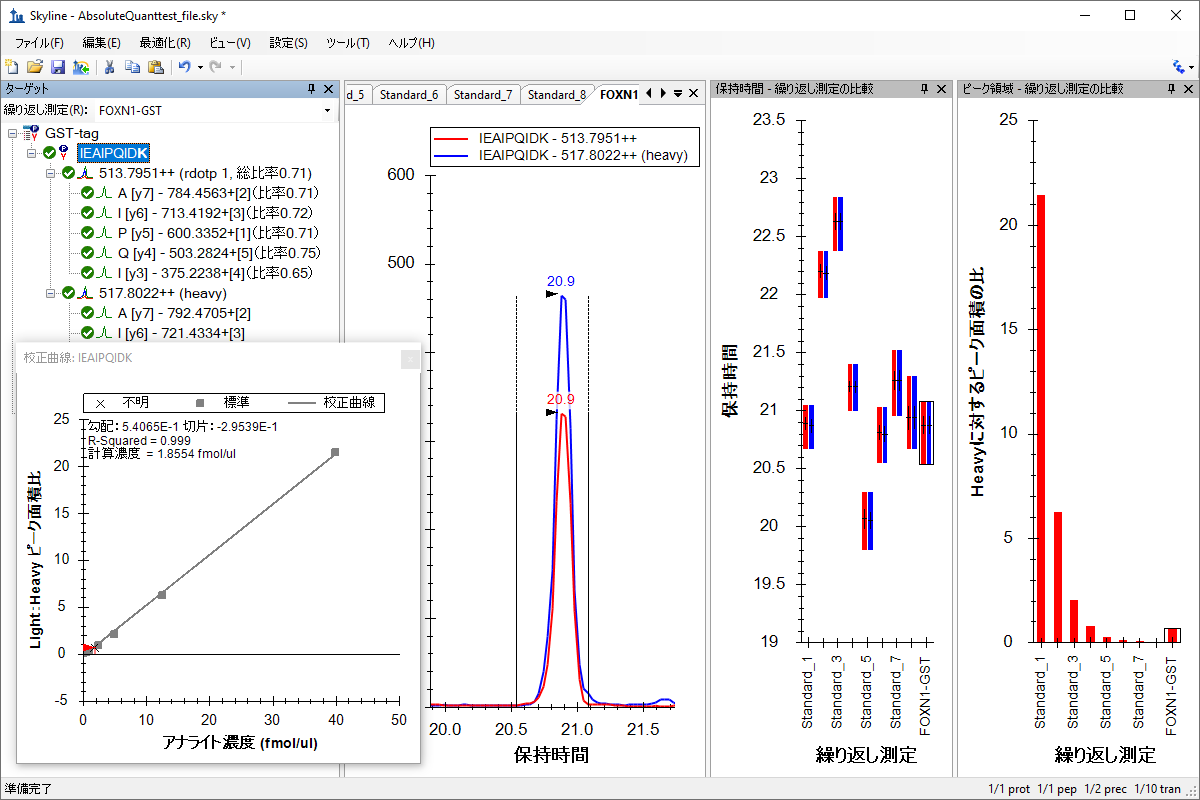
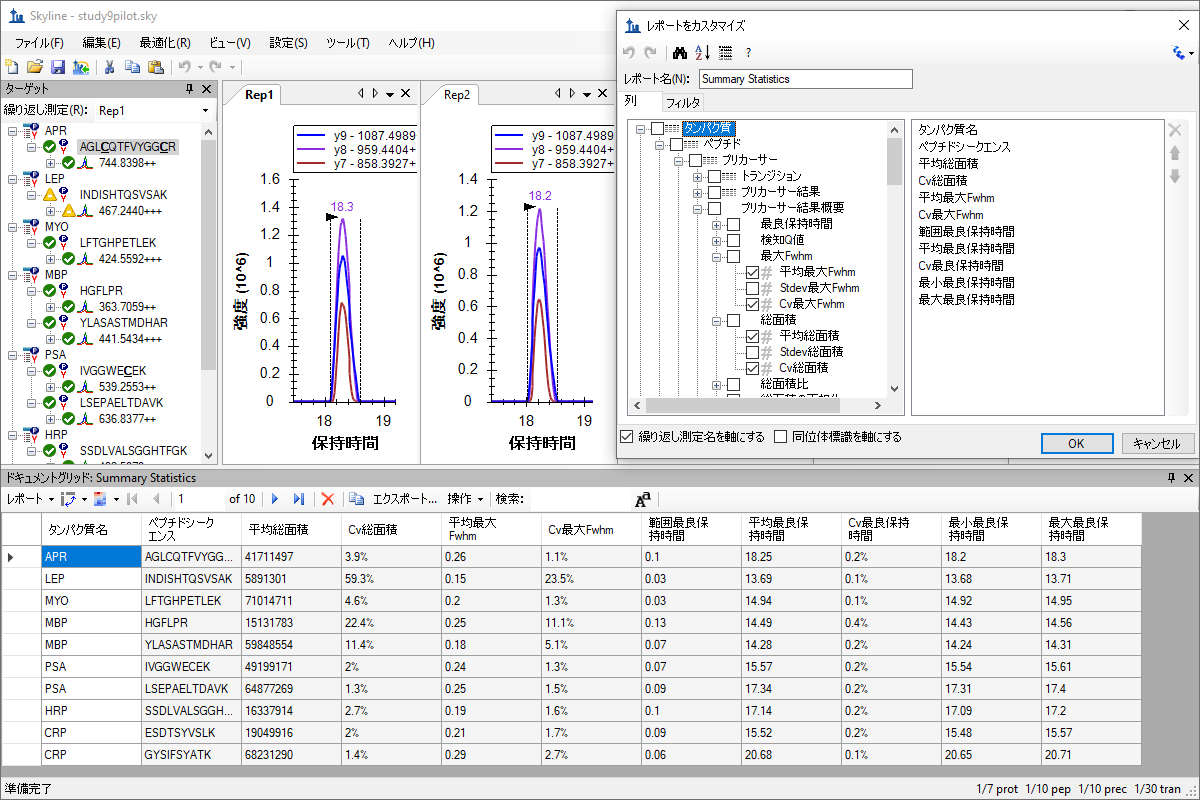
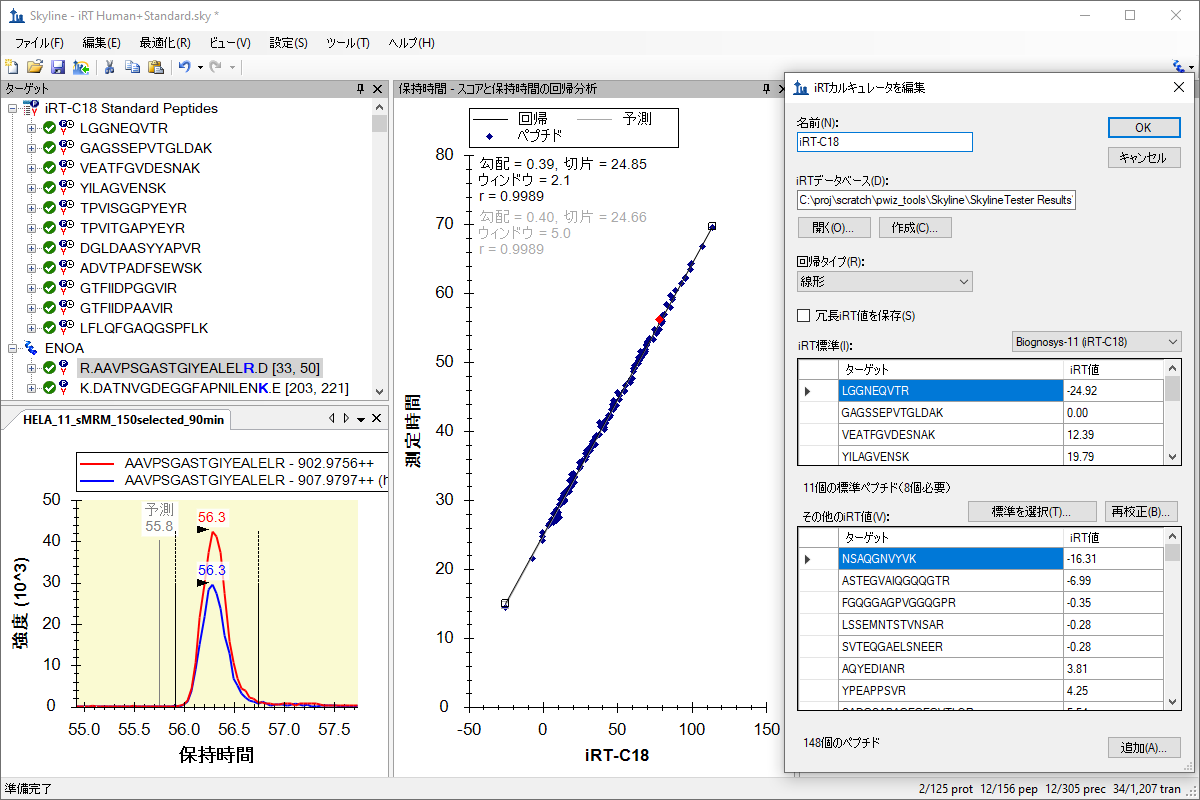
他の内容は近日公開する予定です!
ターゲットメソッドの編集
ターゲットメソッドの最適化
によるグループ研究データの処理
既存データ処理および定量実験
MS1フルスキャンフィルタ
MS1 フィルタ用 DDA 検索
併発反応モニタリング(PRM)
DIA、データ非依存性解析
SWATHデータの分析
Navarro, Nature Biotech 2016のベンチマークとなる論文に基づいて、装置用に作成された有機体3種の混合データセットを使用し、Q ExactiveまたはTripleTOF装置のいずれかより取得したデータ非依存性取得(DIA)データを利用する実務経験を積みます。保持時間校正向けの自動iRT校正でDDAデータからスペクトルライブラリと、ペプチドピーク検出のmProphet学習モデルを構築するDIAには、ペプチド検索のインポートウィザードを使用します。保持時間、ピーク領域、質量精度、CVを含むSkyline概要プロットの豊富なコレクションを使用してデータ品質を評価します。最後に、グループ比較を実行し、各有機体で予想される比率をデータがうまく取得できたかを評価します。 (35ページ
| Thermo Q Exactive | SCIEX TripleTOF | |
 |  |  |
Q Exactive SWATHデータの分析
TripleTOF SWATHデータの分析
によるターゲットメタボロミクス解析
小分子メソッド開発とCE最適化
小分子の定量化
絶対定量
カスタムレポートとライブレポート
iRT保持時間予測
Targeted Method Editing
Targeted Method Refinement
Processing Grouped Study Data
Existing and Quantitative Experiments
Comparing PRM, DIA, and DDA
PRM With an Orbitrap Mass Spec
MS1 Full-Scan Filtering
DDA Search for MS1 Filtering
Parallel Reaction Monitoring (PRM)
Basic Data Independent Acquisition
Analysis of DIA/SWATH Data
Get hands-on experience working with a data independent acquisition (DIA) data, from either a Q Exactive or a TripleTOF instrument, using a 3-organism mix data set created for instruction, based on the Navarro, Nature Biotech 2016 benchmarking paper. Use the Import Peptide Search wizard for DIA to build a spectral library from DDA data with automatic iRT calibration for retention time calibration and an mProphet learned model for peptide peak detection. Assess the data quality using a rich collection of Skyline summary plots including Retention Times, Peak Areas, Mass Accuracy, and CVs. Finally, perform a group comparison and make your own assessment of how well the data capture the expected ratios for each organism. (32 pages)
| Thermo Q Exactive | SCIEX TripleTOF | |
 |  |  |
Analysis of Q Exactive DIA/SWATH Data
Analysis of TripleTOF DIA/SWATH Data
Analysis of diaPASEF Data
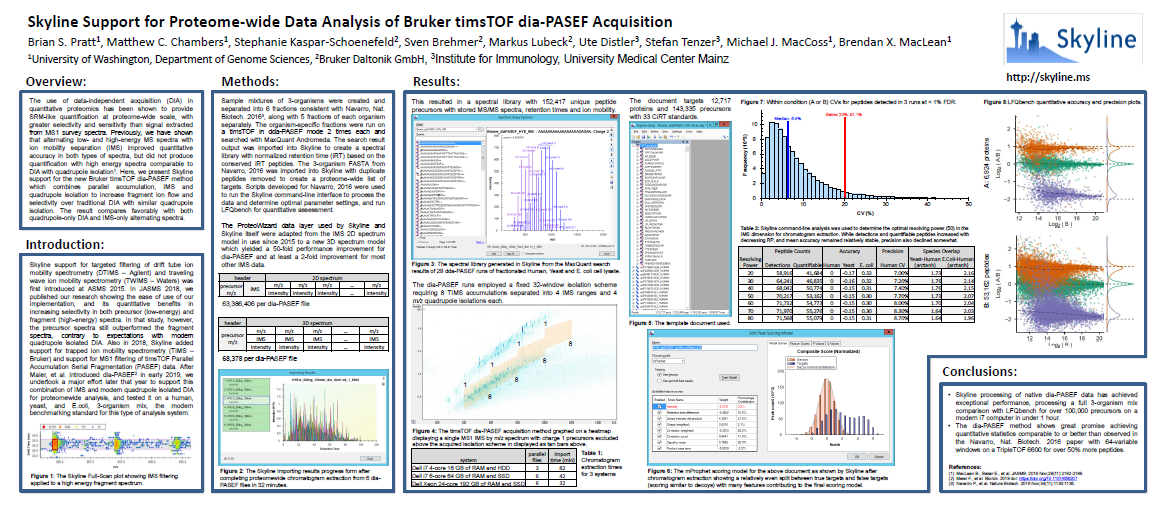
Library-Free DIA/SWATH
Small Molecule Targets
Small Molecule Method Development and CE Optimization
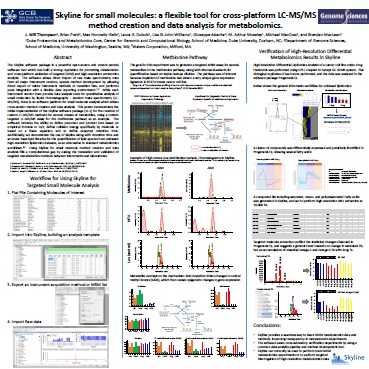
Small Molecule Multidimensional Spectral Libraries
Small Molecule Quantification
Hi-Res Metabolomics
Absolute Quantification
Custom Reports
Advanced Peak Picking Models
iRT Retention Time Prediction
Collision Energy Optimization
Ion Mobility Spectrum Filtering
Spectral Library Explorer
Audit Logging
ETH Targeted Proteomics Course Tutorials
In 2016, members of the Aebersold lab at ETH, Zurich - with help from CRG, University of Washington, Purdue and Biognosys - presented the last week long course on targeted proteomics with SRM, PRM and DIA to 30 participants. During the course, the participants worked through 9 tutorials with follow-up exercises. This material has been made freely available on the Targeted Proteomics Course web site, providing a great resource to anyone interested in learning more about Skyline method editing and data processing (8 Skyline + MSstats + mProphet tutorials)
[go there] (2016)
 | ETH Targeted Proteomics Course |
* - written on Skyline v3.5
You can also watch the presentation videos.
In 2018, many of the same instructors with some new additions presented the second week long course on DIA/SWATH for proteomics to 50 participants. That course included new tutorials and lectures aimed at teaching DIA/SWATH data processing and use in proteomics research, with some very nice examples using Skyline. You can download them form the same location.
[go there] (2018)
| ETH DIA/SWATH Course |
* - written on Skyline v4.1
You can also watch the DIA/SWATH Course presentation videos.
Videos
Watch one of these instructional videos for a quick start using Skyline in your targeted proteomics experiments. Although these three videos were recorded in 2009 and refer exclusively to the Skyline SRM support, they still provide a good bit of useful information about Skyline and how it may be used in setting up targeted proteomics experiments, even when using full-scan mass spectrometers. For a more complete overview what you can do with Skyline, please refer to the Skyline tutorials.
Learn more about creating SRM/MRM methods in 28 minutes.
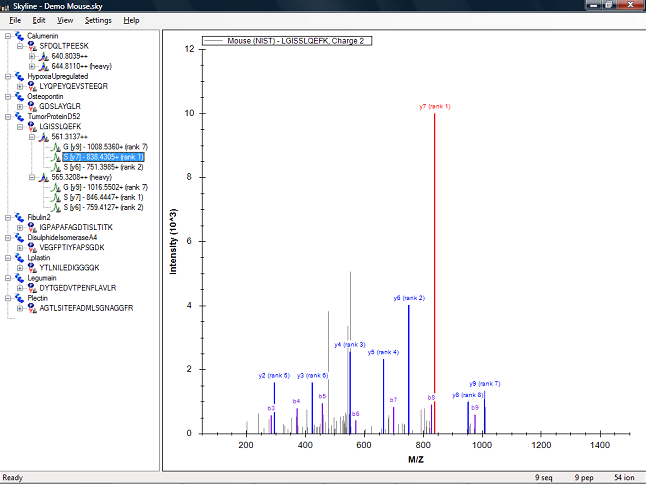 |
Learn more about results analysis and method refinement in 25 minutes.
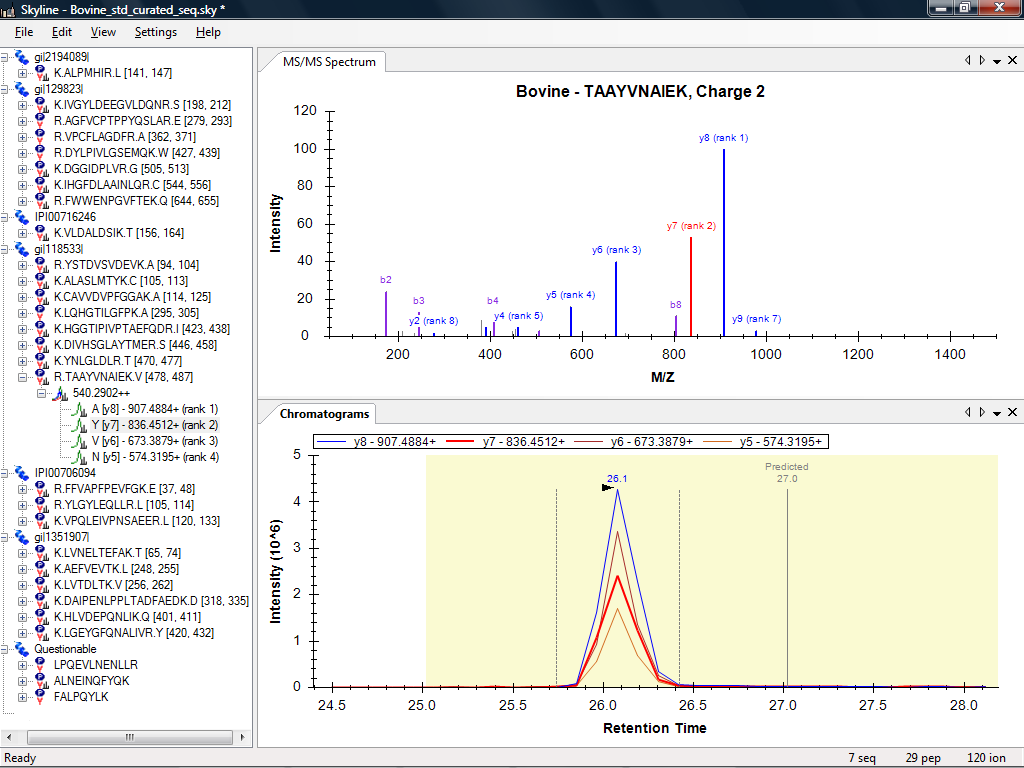 |
Learn more about importing existing experiments and isotope labeled reference peptides in 27 minutes.
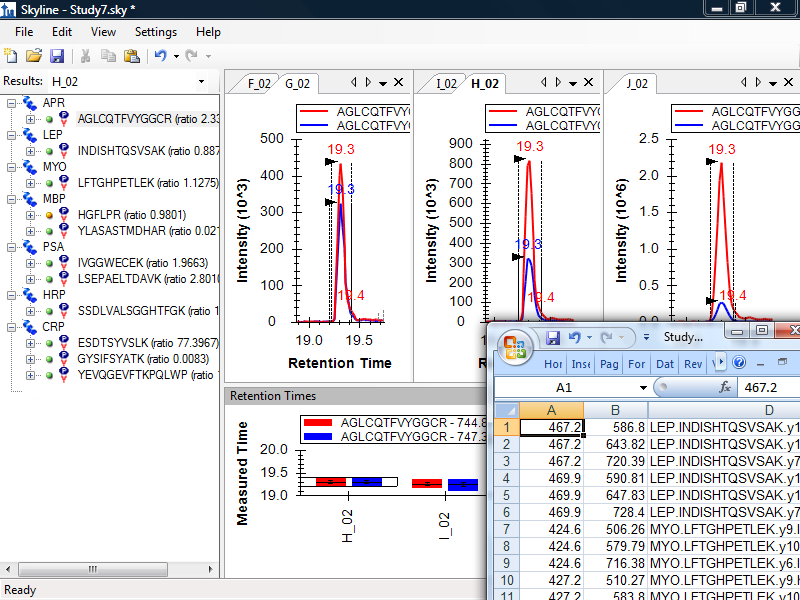 |
Watch the Skyline trailer video
 |
Video 1: Method Editing
Try the Targeted Method Editing tutorial, and get hands-on experience.
Download the full video for faster access to repeat viewing.
* - recorded using Skyline v0.2
Video 2: Results Analysis
Try the Targeted Method Refinement tutorial, and get hands-on experience.
Download the full video for faster access to repeat viewing.
* - recorded using Skyline v0.5 Preview
Video 3: Existing & Quantitative Experiments
Try the Existing and Quantitative Experiments tutorial, and get hands-on experience.
Download the full video for faster access to repeat viewing.
* - recorded using Skyline v0.5 Preview
Video: Trailer
Webinars
|
The Skyline Team is excited to present this tutorial webinar series designed to help you get the most out of Skyline targeted proteomics software. Skyline Team members and guest researchers share their experience in these webinars and explain Mass Spectrometry topics through the lens of the Skyline software environment. Each webinar has its own page (linked below) containing a recording of the webinar and all related information. The webinar recordings are about 90 minutes long with the last 30 minutes dedicated to Questions and Answers from the attending audience. Additionally, each webinar page contains the presentations, supporting tutorial data, and other related information. Even the most experienced Skyline users are likely to learn something new. 2025
2024
2023 & 2021
2020 & 2018
2017 & 2016
2015
2014
|
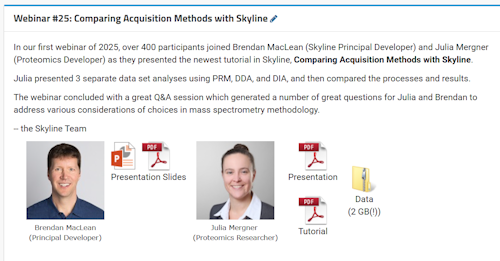
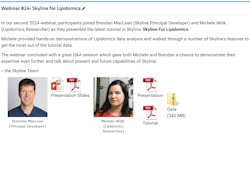

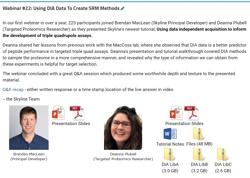
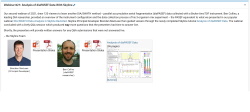
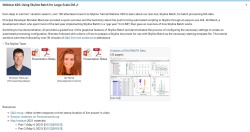
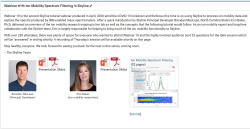
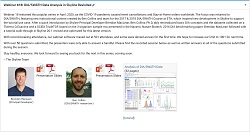
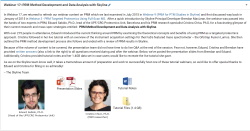
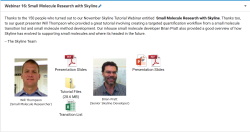
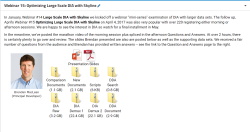
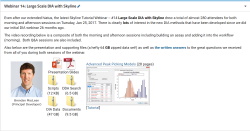
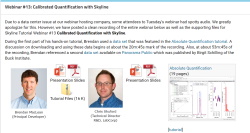
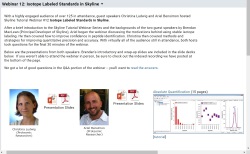
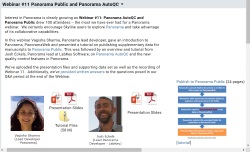
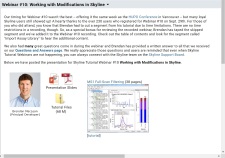
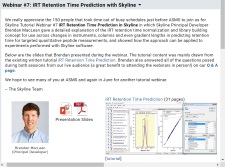
YouTube Channels
Visit Skyline's own YouTube Channel for content from recent UW courses as well as Skyline-related instructional content from courses offerered at other institutes:
Tips
Here are a few tips too short to be a full tutorial, but which may be helpful nonetheless. This is a partial list, check the "Pages" menu on the right for more.
- Adduct Descriptions
- Working with Other Quantitative Tools
- How to Display Multiple Peptides
- Terminology Cheat Sheet
- How Skyline Builds Spectral Libraries
- ID Annotations Missing with Mascot Search Results
- DIA Configuration for Thermo Q Exactive Instruments
- How Skyline Calculates Peak Areas and Heights
- Support for Bruker TOF Instruments
- Recovering From a Broken Installation
- Sharing MS/MS Spectra with Manuscripts
- Share Skyline Documents in Manuscripts
- Export SRM Methods for a Thermo LTQ
- Skyline Lists
- Pivot Editor
- Result File Rules
Terminology Cheat Sheet
At the recent Targeted Proteomics Course at UW 2014, participants claimed that the many terms we have in mass spec proteomics with exactly the same meaning made the course much more difficult to follow. They requested a glossary or cheat sheet that might help them translate between these various terms. Here it is:
SRM - Selected Reaction Monitoring (sometime confused as Single Reaction Monitoring - no such thing). Common synonym MRM (Multiple Reaction Monitoring). Performed on triple-quadrupole instruments, where the instrument cycles through a pre-specified set of precursor m/z (Q1), product m/z (Q3) pairs called 'transitions', using the quadrupoles as filters (usually 0.5 to 1.0 m/z range). Cycle time is determined by the sum of the dwell times of all transitions in the set.
MRM - Multiple Reaction Monitoring, a synonym for SRM created and trademarked by AB SCIEX, but extremely popular because of early popularity of AB Q TRAP instruments for performing this method.
scheduled-SRM = scheduled-MRM = dMRM = dynamic-MRM - In order to allow measuring a greater number of transitions in a run, transitions are specified with start and end times (or retention times and windows) to allow the instrument to measure each transition for only a fraction of the entire gradient. Cycle time at any given time is determined by the sum of the dwell times of all transitions being measured at that time.
iSRM = intelligent-SRM = triggered-SRM = triggered-MRM = tMRM - In order to gain more confidence in the correct identification of a chromatogram peak in SRM without overly sacrificing quantitative throughput, the instrument measures a set of primary transitions, as in normal SRM/MRM until the intensity on those transitions exceeds some threshold. When the threshold is exceeded, the instrument takes one or more measurements of a secondary set of transitions usually used only for peak identity confirmation, and not quantification.
Targeted MS/MS = tMSMS = PRM = MRM-HR - Like SRM, but performed on a full-scan instrument (ion-trap or Q-TOF). The instrument cycles through a pre-specified set of precursor m/z values, using quadrupole or ion trap isolation as a filter (usually 1.0 to 2.0 m/z range) and collects a full MS/MS fragment ion spectrum for each. Cycle time is determined by the sum of the dwell/accumulation or scan times of all scans in the set. Software is used to extract chromatograms from the resulting MS/MS spectra. If the spectra are high-resolution, then extraction can be done using 50-100pm range, making it more selective than SRM. Common synonyms PRM (Parallel Reaction Monitoring), MRM-HR (HR = High Resolution), pSRM (Pseudo Selected Reaction Monitoring).
MS1 [Full-Scan] Filtering - Chromatograms are extracted from the MS1 scans of normal DDA (Data Dependent Acquisition) data. Because of the semi-random sampling approach, for MS/MS, of DDA, it is not possible to extract product ion chromatrams (time, intensity) with meaningful peaks for quantification. Chromatogram-based quantification from DDA runs is limited to extracted ion chromatograms from the MS1 survey scans of such runs. Common synonym Label Free Quant.
DIA = SWATH = HRM - Data Independent Acquisition is a technique where ranges of precursor m/z are isolated and subjected to fragmentation in a consistent pattern over cycles of time. In this way a mass spectrometer can be set up to gather fragment ion spectra for large regions of precursor m/z space, independent of the actual precursor ions being fragmented, which may include fragments for multiple precrusors in any given scan. Software can be used to extract product ion chromatograms from the acquired MS/MS spectra. Cycle time is determined by the sum of the dwell/accumulation or scan times of all scans in the set. (e.g. 20 ranges x 10 m/z = 200 m/z total range, 30 ranges x 20 m/z = 600 m/z total range)
SWATH - Popular synonym for DIA coined in Gillet, et al. MCP 2012, but also trademarked by AB SCIEX, originally specified as 32 x 25 m/z ranges covering 400 - 1200 m/z.
HRM - Hyper Reaction Monitoring, less common synonym for DIA/SWATH.
MSe - Type of DIA where ions are collected without prior filtering in alternating low- and high-energy scans (all precursors and fragments of all precursors respectively), coined and trademarked by Waters. Common synonym All-Ions DIA.
Installing Skyline
Reverting an Upgrade Installation
- Using the Windows Start menu, search for "Add or remove programs":
- Search for Skyline or Skyline-daily:
- Choose to uninstall accepting all warnings from Windows to get to this uninstall form:
- Choose "Restore the application to its previous state." and click OK.
Recovering From a Broken Installation
If you know your current release is out of date, but Skyline has not asked to upgrade after two restarts, you should first try simply manually installing again from the web page over the top of your existing installation. If this does not work, read on.
At times a Skyline installation may become so broken that you cannot install a new release over the top of your existing installation. In this case, you will need to find the Skyline installation files on your computer, save your Skyline settings, and then either uninstall or potentially even delete the Skyline files before you can re-install and subsequently restore your settings. This tip will walk you through doing just that.
Finding and Saving Your Settings
First, you need to find your Skyline installation. On Windows 7 or Windows Vista, you first want to find the folder:
C:\Users\brendan\AppData\Local\Apps\2.0
On Windows XP, it will be something like:
C:\Documents and Settings\brendan\Local Settings\Apps\2.0
If you are unable to find either the AppData (Windows 7 and Vista) or the Local Settings (Windows XP) folder, you may need to do the following in Windows Explorer:
- Press Alt+T, O to open the Folder Options form.
- Click the View tab.
- Under the Hidden files and folders item, click the Show hidden files and folders option.
- Click the OK button.
You should now be able to see the necessary folder in Windows Explorer.
To save your Skyline settings before removing the Skyline files, do the following:
- Use Windows Explorer to search within the Apps\2.0 folder for the file 'user.config'. (Starting at C:\ will be a very long search!)
- If you find more than one, look at the Date Modified and In Folder fields to determine which is the most recent under a folder beginning with 'skyl..'.
- Hold down the Ctrl key on your keyboard, click the mouse cursor on the file and drag it to your desktop.
Now you have a copy of your Skyline settings on your computer desktop.
Removing Skyline From Your System
The next thing you should try is to simply uninstall Skyline, using the Control Panel ("Uninstall a program" in Windows 7 & Vista, and "Add/Remove Programs" in Windows XP). If the uninstall fails, then you have no option but to clean up manually.
Before attempting to delete your Skyline installation, you should expand the folders below the '2.0' folder, so that you seem something like the folder tree shown in the image below:
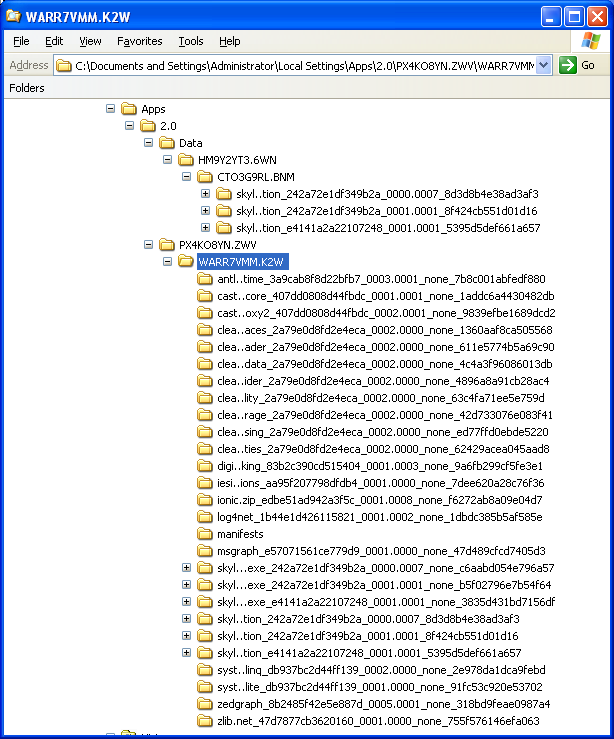
If your '2.0' folder looks much the same as the one above, then you can simply delete the entire '2.0' folder now, but be very careful with this option, as you may have other software in here. If you see any differences, delete only the folders beginning in 'skyl..'.
Re-installing Skyline and Restoring Settings
You have removed Skyline from your system. After restarting the system, try again to install Skyline from the Skyline web site or stand-alone installers.
After you have installed successfully, close the Skyline window. Then again find the 'user.config' under '2.0', belonging to a folder beginning with 'skyl..' and copy the user.config you saved to your desktop over the top of the new user.config, which will contain only the default settings.
You should now be able to start Skyline and see that your settings have been preserved, and continue working with Skyline as normal.
Recovering the .sky File Extension Association
If you end up in a state where you can no longer double-click in the Windows Explorer on .sky or .skyd files and have Skyline open the files for you, do the following:
- Run regedit.exe and delete the following keys if any are present (they may not all be)
- Delete the keys HKEY_CLASSES_ROOT\.sky and HKEY_CLASSES_ROOT\.skyd
- Delete the keys HKEY_CURRENT_USER\Software\Microsoft\Windows\CurrentVersion\Explorer\FileExts\.sky and .skyd
- Delete the keys HKEY_CLASSES_ROOT\Skyline.Data.0 and HKEY_CLASSES_ROOT\Skyline.Document.0
- Reboot your computer
- Wait for an update or reinstall Skyline (see also Recovering From a Broken Installation)
Thanks to Stack Overflow for this entry:
https://stackoverflow.com/questions/6489112/clickonce-deployment-file-association-not-registering
Running Skyline TeamCity Artifact Builds
To download a TeamCity artifact for a feature or bugfix that will be integrated into Skyline (if a developer has provided you with a link, simply download SkylineTester.zip and skip to the next section):
- Find the relevant pull request on GitHub: https://github.com/ProteoWizard/pwiz/pulls
- If the TeamCity builds have not been run, wait for them to run.
- Click the "Details" link for the "Skyline master and PRs (Windows x86_64)" build.
- Click the "Artifacts" tab.
- Click "SkylineTester.zip" to download.
Running the build:
- Extract the contents of the SkylineTester.zip.
- Run the extracted executable "SkylineTester Files\Skyline-daily.exe". No installation is necessary, because Skyline is a side-by-side exectuable and will find necessary files relative to the location of the executable.
Small Molecules
Automatic Precursor Isotopes
Skyline can automatically add [M+1], [M+2], etc isotopes to your Targets tree if you provide molecular formulas in your transition lists. Here are some things to know about that.
When you first import a transition list, Skyline will only show the most abundant isotope for precursors in the Targets window.
If you want to see others, there are a few settings that need to be adjusted in Transition Settings (via the Skyline Settings > Transition Settings... menu):
- In the Filter tab, make sure the Ion types field includes the letter 'p' to indicate that you want to work with precursors.
- In the Instrument tab, make sure the Min m/z and Max m/z values are suitable for the precursor m/z values you are interested in.
- In the Full Scan tab, make sure the Isotope Peaks value is set to something other than None.
Note: in Skyline versions 21.2 and earlier, even if you have these values preserved in your settings from a previous run you may have to visit the Transition Settings and make a slight change to your settings to provoke the creation of the additional precursor nodes in the Targets window. It doesn't matter which setting, and you can change it back again afterward, but this is necessary to reevaluate the contents of the Targets tree.
UI Modes
Skyline was built from the ground up as a proteomics targeted mass spec research tool. By popular demand, Skyline’s support for more general biomolecular mass spectrometry research has steadily increased over the past several years.
Unfortunately until the Skyline 19.1 release the user interface remained proteomics-centric. Non-proteomics researchers had to think “molecule” while seeing “peptide”, and it wasn’t always easy knowing which parts of the UI didn’t apply to your work. This was especially true for new users.
But now, Skyline adjusts its user interface according to the kind of molecules you're working with.
For full details continue reading the attached PDF.
Adduct Descriptions and Small Molecule Labels
Ionization in Peptides vs Ionization in Small Molecules
Skyline assumes protonation for peptides so we can simply speak about "charge" or "charge states". For generalized molecules, we have to think about all kinds of ionization so we speak in terms of "adducts". Adduct descriptions may also specify isotope labels applied to the neutral molecule description. As such, "adducts" are similar to the idea of "modifications" in the peptide regime.
Describing Ionizing Adducts
Skyline uses the defacto standard notation for ionizing adduct descriptions, as found at the Fiehn Lab's MS Adduct Caclulator and the GNPS Spectral Library. This notation has a few major parts:
Usually beginning with a left brace "[",
then an optional dimer/trimer/etc specification e.g. the "2" in "[2M+H]",
then an "M"
then an optional isotope label specification e.g. the "2C13" in "[M2C13+Na]",
then the chemical formula of the adduct,
then a closing right brace "]",
and an optional charge declaration, e.g. the "1-" in "[M+Cl]1-".
The charge declaration is useful if you are describing an adduct that is not in common use, as Skyline will use that instead of any (possibly mis-)calculated charge.
Describing Labeled Versions of Molecules for Quantification
For quantification of heavy/light pairs, Skyline expects to see a single molecule with heavy and light adduct descriptions. For example you might describe the light ion as having adduct [M+2H] and its heavy counterpart as having adduct [M4D+2H] (double protonated, and four H replaced by D). Here is a transition list describing that scenario:
Molecule,Precursor Formula,Precursor Adduct
Caffeine,C8H10N4O2,[M+H]
Caffeine,C8H10N4O2,[M4D+H]
The important point is that it describes a common molecule with distinct adduct descriptions, one of which includes labeling information.
Simple Examples
Singly protonated: [M+H]
Doubly deprotonated: [M-2H]
Sodiated: [M+Na]
N-Mer Examples:
Sodiated dimer: [2M+Na]
Deprotonated trimer: [3M-H]
Isotopic Label Examples
Sodiated, and two carbons per molecule replaced with C13: [M2C13+Na]
Sodiated, and two carbons per molecule replaced with C13, and three nitrogens replaced with N15: [M2C133N15+Na]
Charge-Only Examples:
Often transition lists are presented as m/z values with integer charges only, and the actual mode of ionization can not be inferred. In these cases we just give an integer charge value.
Unknown ionization mode, charge = 1: [M+] or [M+1]
Unknown ionization mode, charge = -2: [M-2]
Charge-Only Examples with Isotope Labels Described Only by Mass:
Sometimes a transition list indicated different precursor m/z values for the same named molecule, Skyline reads this as an isotope label of unknown formula, and expresses the mass shift as a number.
Unknown ionization mode, charge = 1, and mass shift due to unknown isotopes of total mass 5: [M5.0+]
Getting lists of data out of Skyline
The Document Grid and Custom Reports are the way to get lists of data out of Skyline.
Viewing Replicate Pivoted Data as Headers
(This tip relates to Skyline v 25.1 or later.)
This is a demonstration of how you can view the replicate grid when viewing replicate pivoted data in Skyline.
When creating a report in Skyline it is possible to pivot your dataset by replicate by using the "Pivot Replicate Name" option:
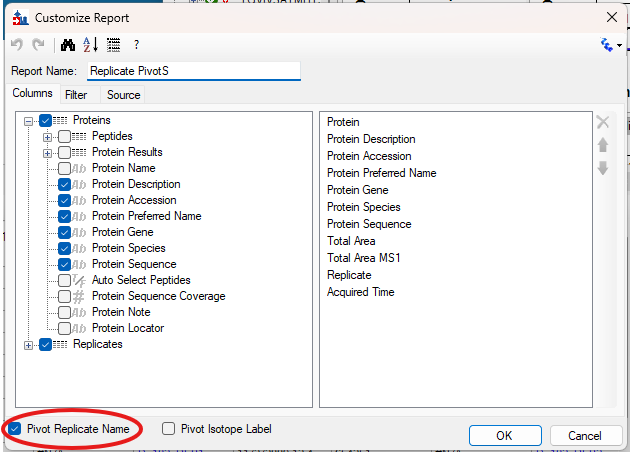
In previous versions the resulting report grid would include columns which contained repeated constant replicate data:
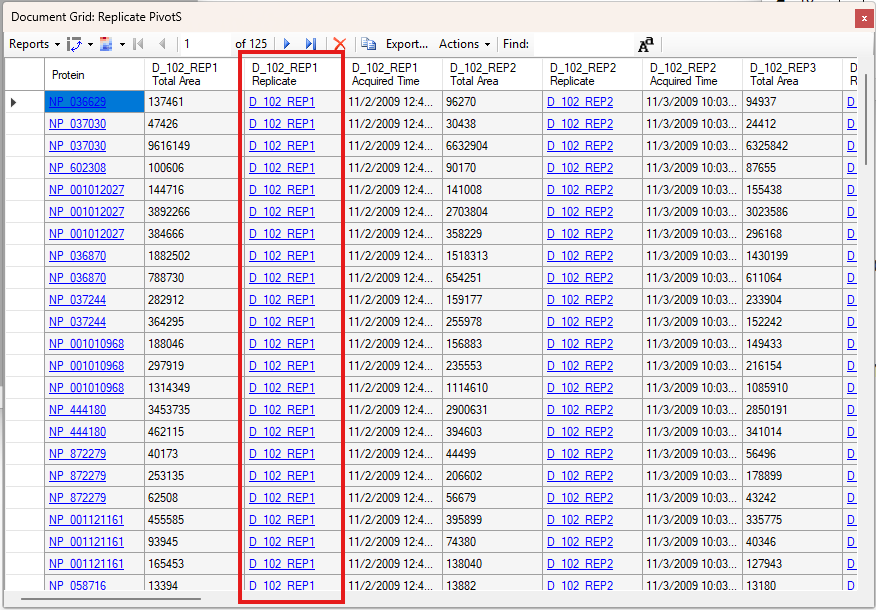
Starting in Skyline v 25.1 this repeated data will now be shown in a new grid:
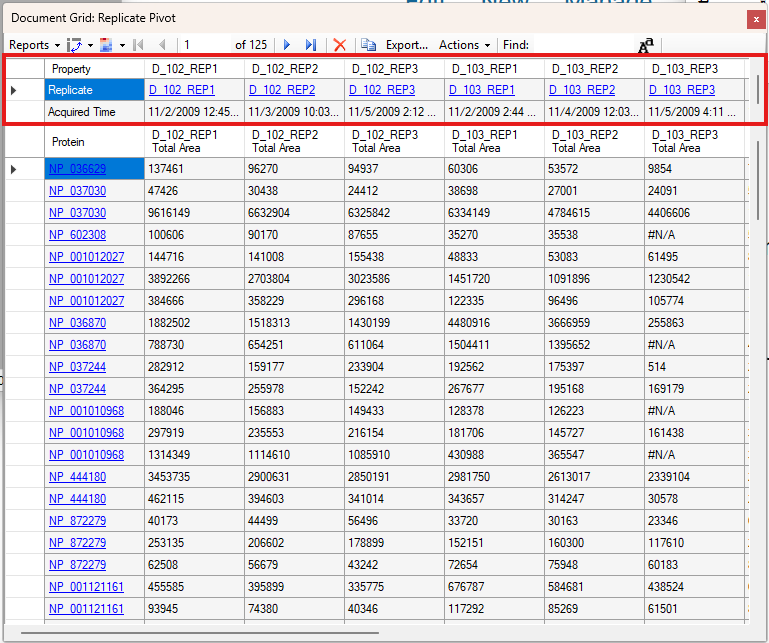
Columns in both grids will remain aligned and react accordingly to user actions:
The new replicate grid supports many of the same features as before. It is possible to select your replicate from this view:
Edit fields:
Edit multiple fields by pasting:
Exports of this report also preserve this structure. Empty delimited values are added to keep data aligned in reports:
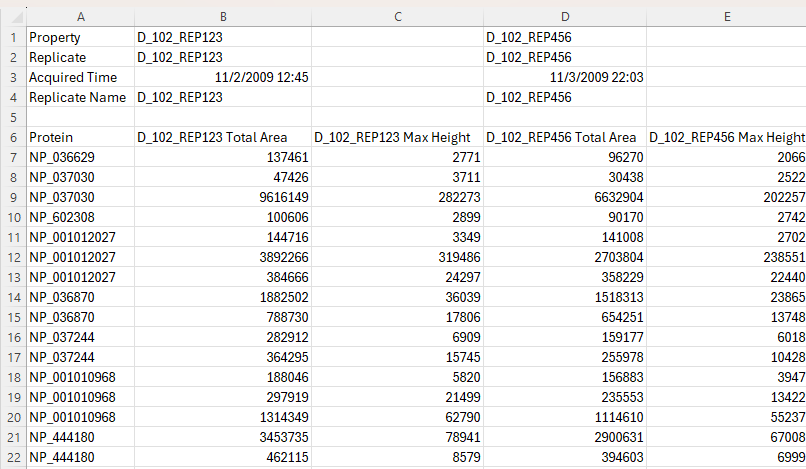
Pivot Editor
The pivot editor lets you combine rows in the Document Grid, and perform aggregate operations on them such as "Mean" or "StdDev".
Here are some examples of how to use the Pivot Editor.
Document Grid Number and Date Formats
The Document Grid allows you to specify formats for columns that contain numbers or dates, or other formattable data types.
To set the format of a column, right-click on it and choose "Number Format...".
The "Choose Format" dialog allows you to specify a custom format string.
Microsoft provides documentation for custom number format strings and date format strings.
If you want to save your formatting choices with your custom report, you can use the "Remember Current Layout..." menu item, which is on the Group/Total button next to the Reports dropdown on the toolbar at the top of the Document Grid.
When a report is exported for external tools, the format used for all numeric columns is always the round-trip format ("R"), which provides the full precision possible for the numeric values. This is the format that is used if you choose "Invariant" as the language when exporting a report at "File > Export > Report".
Skyline Lists
Skyline 19.1 added new feature "Lists" which allows you to add arbitrary lists of data to a Skyline document.
Result File Rules in Skyline 20.2
Skyline 20.2 will have a new feature called "Result File Rules" which allow you to automatically set annotations and other properties by matching parts of the result file names.
[pdf]
Hierarchical Clustering (and PCA Plots) in Skyline-daily
Skyline version 21.1 will include hierarchical clustering features.
These features can be accessed from the Document Grid, as well as Group Comparison grids.

DIA (Data Independent Acquisition)
These tips relate to principally to Data Independent Acquisition (DIA) method of mass spectrometry.
Generating an Overlapping Window Isolation List using Skyline
(This tip relates to Skyline v 4.2 or later.)
This is a quick demonstration on how to use Skyline to generate an overlapping-window isolation window list suitable for acquisition using the approach described in this manuscript and downstream computational demultiplexing.
To begin this demo, start with a blank Skyline document:
- From the Skyline landing page, click Blank Document
- On the Settings menu, click Transition Settings and in the Transition Settings dialog box, click the Full Scan tab.
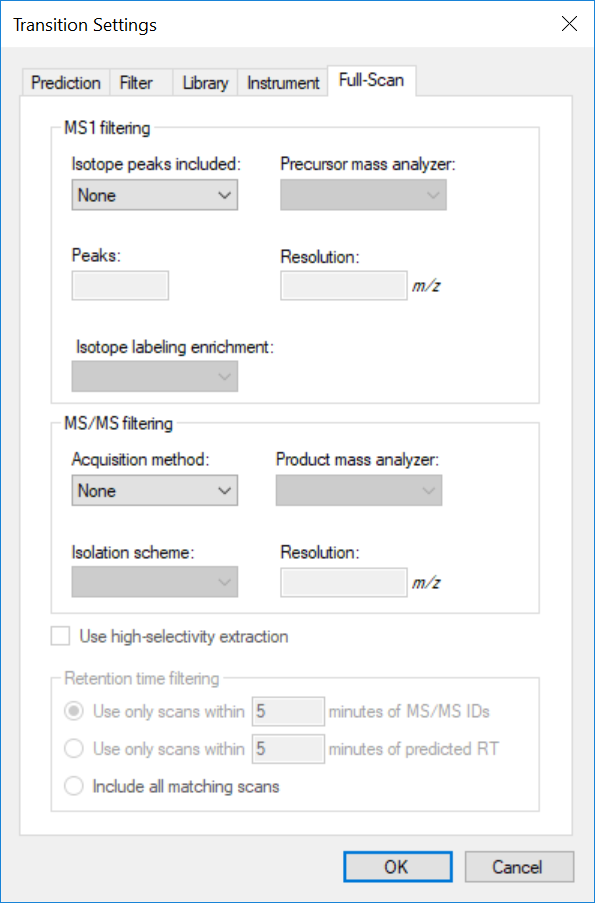
- Under MS/MS filtering, click the Acquisition method dropdown and select DIA.
- For the Isolation scheme, select Add ...
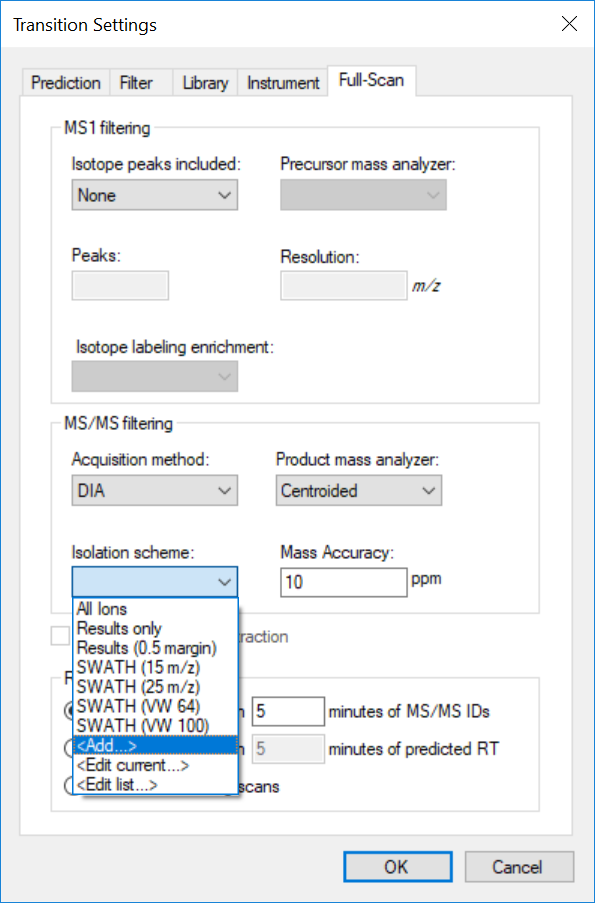
- In the Edit Isolation Scheme dialog, enter a name for the Isolation scheme such as '20mz_overlap' and then click the Prespecified isolation windows radio button.
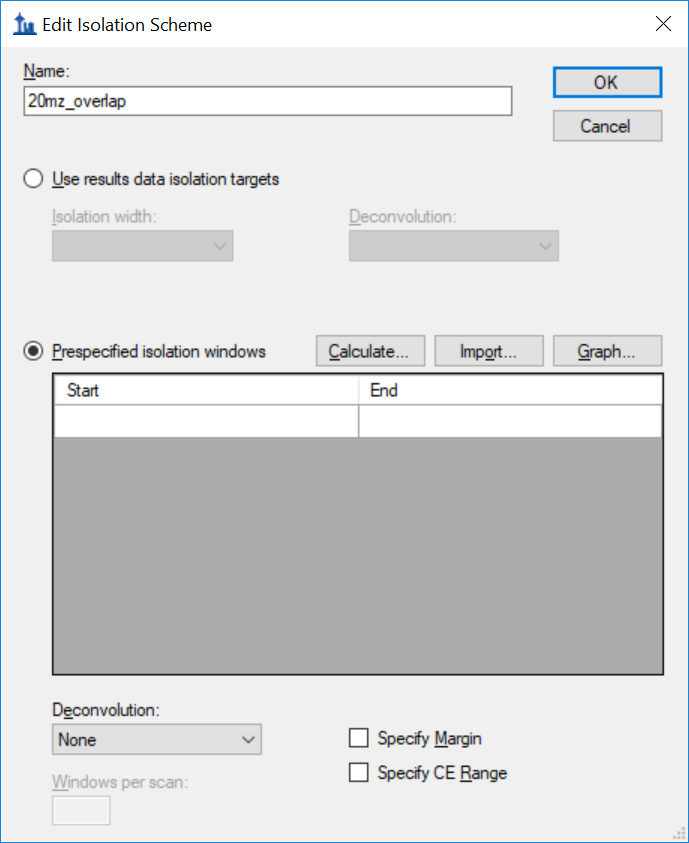
- Click the Calculate ... option and enter parameters for the method.
- Enter '500' for Start m/z.
- End m/z is '500'.
- Window width should be '20'.
- Be sure that Deconvolution is set to Operlap and that Optimize Window Placement is checked.
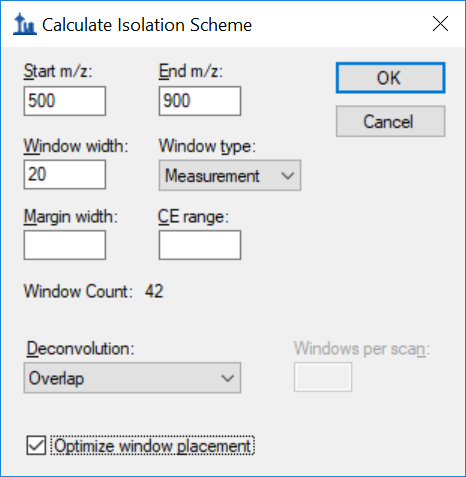
- Click OK to close the Calculate Isolation Scheme dialog and OK to close the Edit Islation Scheme window.
- Click OK once again to close the Transition Settings dialog.
- From the main Skyline menu, select File and then Export. From the flyout menu, click the Isolation List ... option.
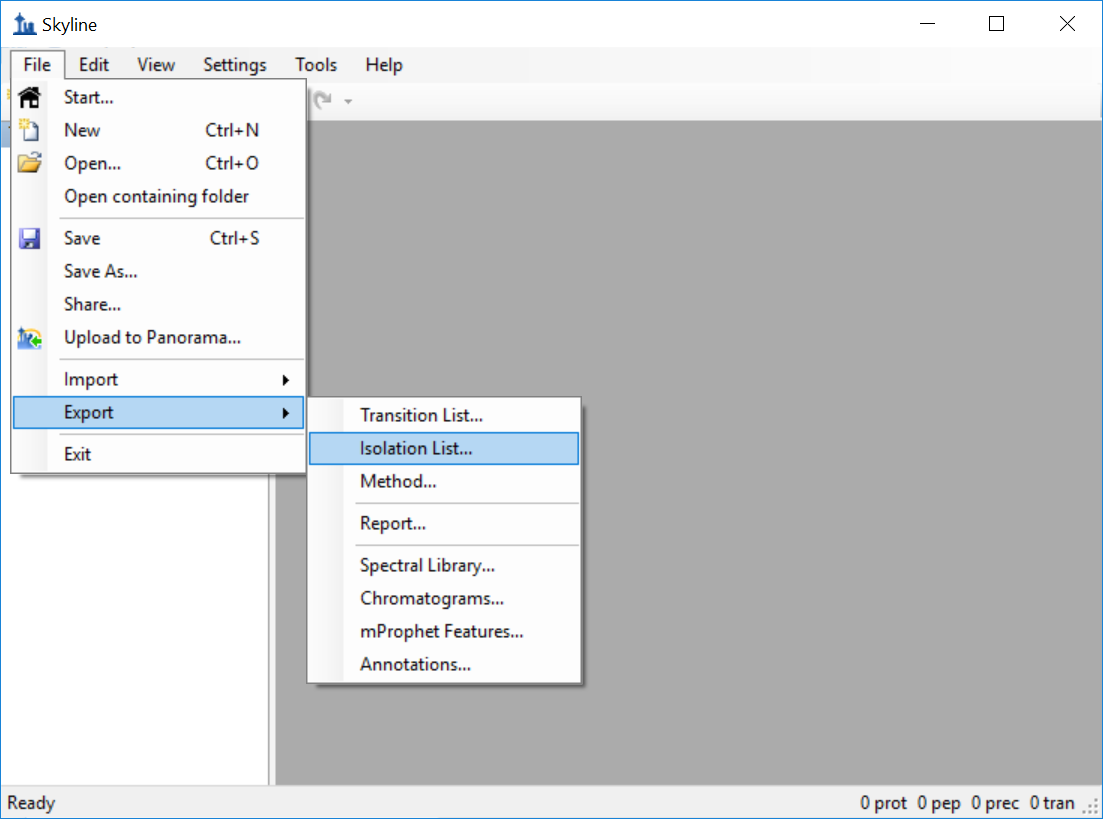
- In the Export Isolation List window, select the appropriate instrument (for this example, 'Thermo Q Exactive') and choose a file location in which to save the list of isolation windows.
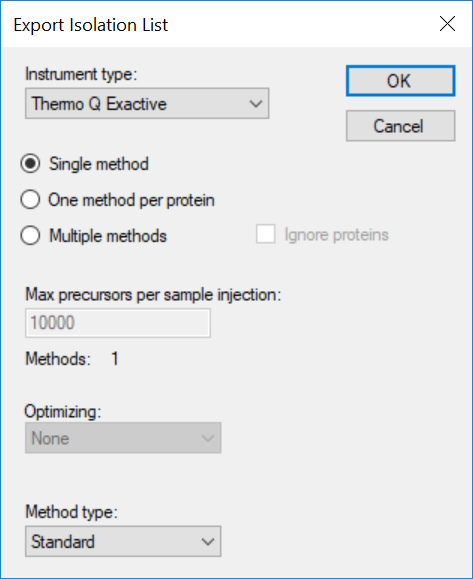
The resulting isolation list contains the isolation centers of each isolation window in the order that they should be acquired. NOTE: the isolation centers will need to be regenerated using this approach if any of the other acquisition parameters such as isolation width or m/z range covered are changed.
Full Spectrum Demultiplexing of Overlapped DIA Windows using MSConvert
(This tip relates to Skyline 4.2 and later.)
This is a quick demonstration on how to use MSConvert to generate a demultiplexed dataset from an input datafile(s) containing spectra with overlapping data independent acquisition windows. In the case of the overlapped window approach described in this manuscript, the output from MSConvert will contain twice as many spectra as the input (two demultiplexed spectra are generated from each acquired MS/MS spectrum). This tutorial uses MSConvert distributed with ProteoWizard version 3.0.18328 with vendor libraries downloadable here: http://proteowizard.sourceforge.net/download.html
- Open MSConvert and select the Browse option to select the input overlap-multiplexed files.
- Select the SIM as spectra option.
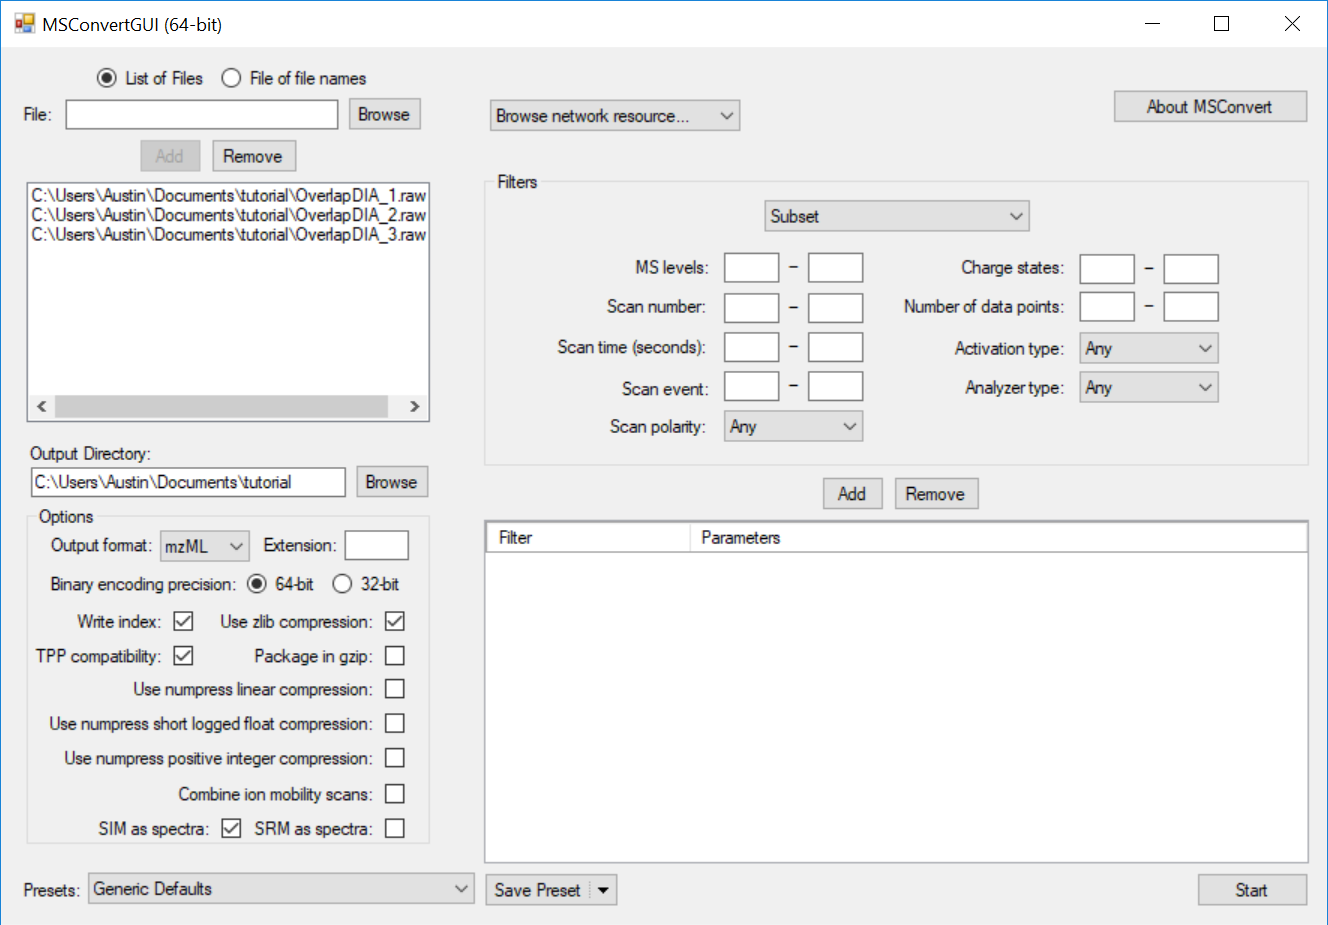
- OPTIONAL: Change the output format for the file using the Output format drop-down menu. This tutorial outputs mzML.
- Add a Peak Picking filter to the data by selecting the options indicated below and clicking the Add button below the Filters section:
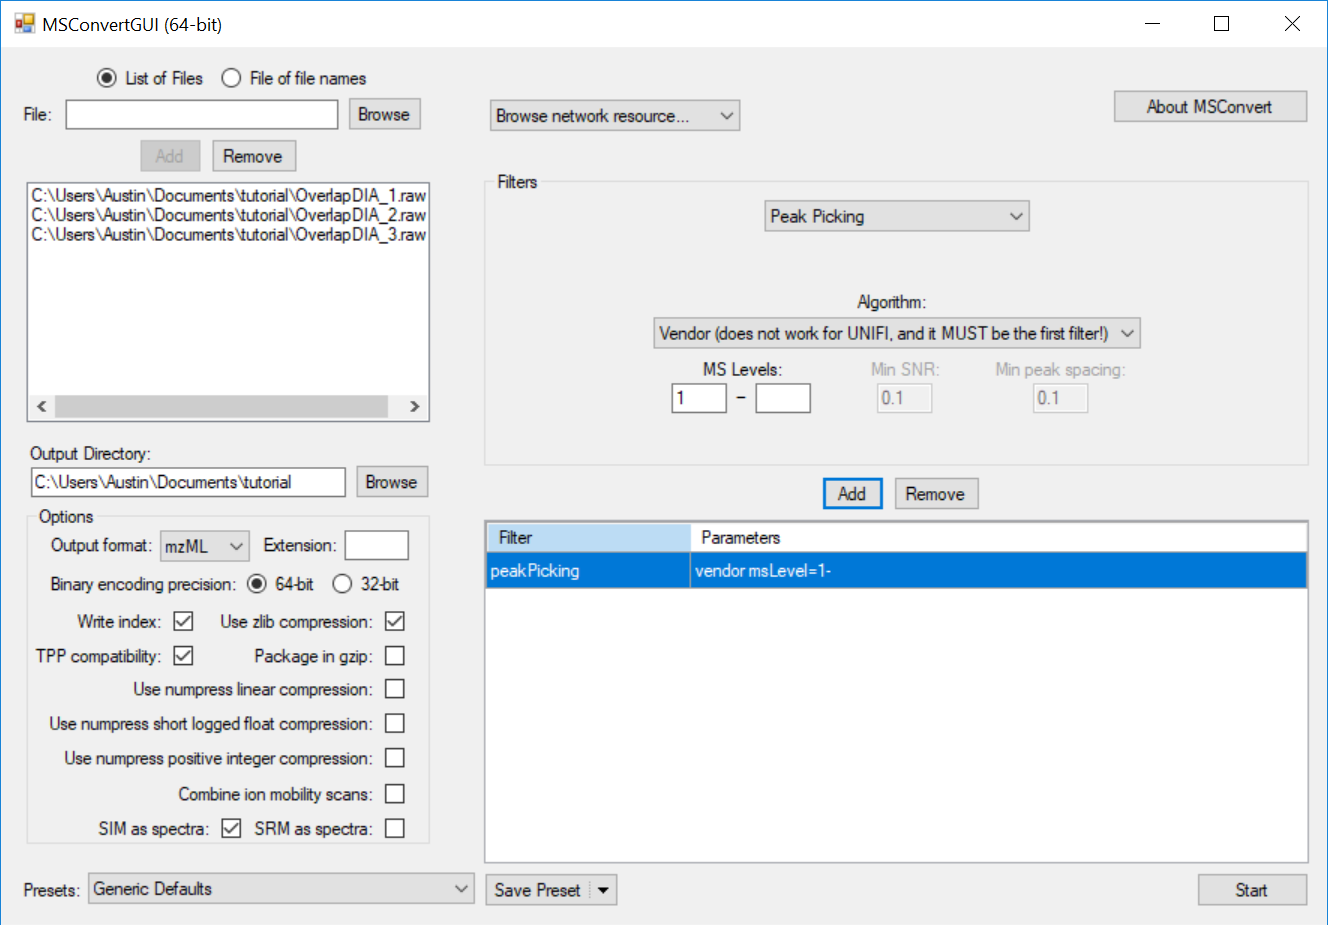
This causes the MS2 data to be centroided prior to demultiplexing, which is currently a requirement for full-spectrum demultiplexing using MSConvert. If the data were acquired with centroiding enabled, this step will have no effect and demultiplexing will proceed as expected.
- In the Filters section, add a Demultiplex filter with optimization set to Overlap Only with the settings shown below.
- Click the Add button.
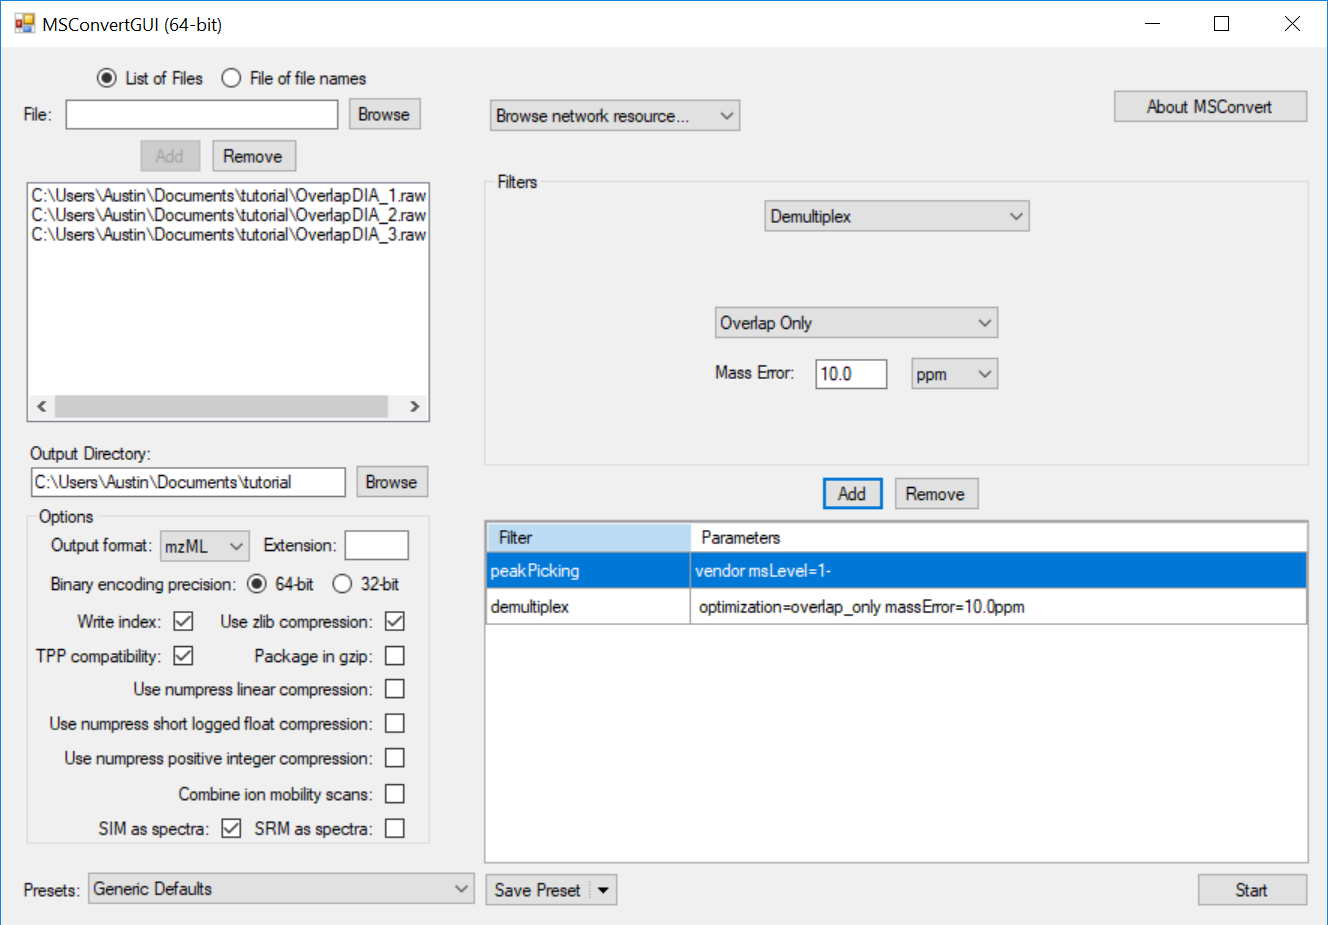
Note that the mass error may need to be adjusted depending on instrument platform. The mass error should be set to the maximum error expected in m/z measurement of the same analyte in subsequent spectra. Note that this measurement is of expected deviation of a measurement from spectrum to spectrum, not its deviation from the correct theoretical m/z (mass accuracy).
- Click Start to output demultiplexed files.
Import OpenSWATH Results
NEW! in Skyline 4.2: You can now import OpenSWATH results either from TSV or OSW file into Skyline for data visualization and beginning the targeted method refinement process.
See the PowerPoint slides attached below and watch the video from the ETH DIA/SWATH course:
Slides Explaining Data Independent Acquisition
Powerpoint slides with useful information on the fundamentals of Data Independent Acquisition (DIA) are provided below.
Introduction to Data Independent Acquisition
Please note that these slide decks are incomplete because slides containing unpublished data have been removed. If you would like the full slide deck for your personal use, or would like to use some of these slides in your own presentation, please contact the MacCoss Lab at: info@maccosslab.org
Additional material on DIA:
DIA Methods for Thermo Q Exactive
The attached mini-tutorials explain how to set up DIA methods for the Thermo Q Exactive instrument:
Quantification
Calibrated quantification (a.k.a. absolute quantification) has been added to Skyline in version 3.5. We plan on extending documentation of this feature in the future in a number of ways:
- Updating the existing Absolute Quantification tutorial
- Writing a new tutorial on calibrated quantification that covers all of the available applications
- Including a detailed demonstration of the functionality in a future webinar
Until this work can be completed, however, you can find attached to this page a set of PowerPoint slides which hopefully provide enough of a rough overview of what is now possible that anyone interested can at least get started with the new functionality.
Also, the Skyline Tutorial Webinar #12 gives some initial coverage on this feature near the end of the recording (and in presentation slides).
Normalization Methods
Skyline offers many different ways to perform normalization.
These are normalization options that may be available at "Settings > Peptide Settings > Quantification":
-
None
The normalized area is the sum of the transition peak areas of all of the transitions whose Isotope Label Type is not an Internal Standard Type specified at "Settings > Peptide Settings > Modifications"
-
Equalize Medians
The unnormalized area is divided by the median transition peak area in the result file and multiplied by the median of the median peak areas across all of the result files. The median peak area for each result file can be found in the "Median Peak Area" column in the Document Grid. The peak areas that contribute to the median are:
- The peak area of every MS2 transition
- The Total Area MS1 of every precursor
-
Ratio to Global Standards
The unnormalized area is divided by the sum of the peak areas in the Result File for all of the peptides or molecules whose Standard Type is "Global Standard". If the "Explicit Global Standard Area" value has been set in the Document Grid then that value is used instead of the actual sum of peak areas
-
Total Ion Current
The unnormalized area is divided by the Total Ion Current Area for the Result File. When extracting chromatograms from full spectrum data, Skyline sums the intensities in the points that correspond to MS1 spectra in the Total Ion Current chromatogram.
-
Ratio to <Isotope Label Type>
The sum of the transition peak areas from the other isotope label type is divided by the sum of the transition peak areas from the normalization isotope label type.
The behavior of this normalization method depends on whether "Simple precursor ratios" is checked at "Settings > Peptide Settings > Quantification". If "Simple precursor ratios" is checked then all of the transitions contribute to the peak area sums. If "Simple precursor ratios" is unchecked then Skyline matches transitions between the two label types and only transitions which can have a peak area in both label types are included.
In addition, the normalization method for a particular peptide or molecule can be overridden by setting the value in the "Normalization Method" column in the Document Grid. In that column one can also choose the normalization method "Ratio to Surrogate <XXXX>". For more information see the Surrogate Standards tips page.
When defining a Group Comparison or when looking at the Peak Area graph in Skyline one can choose the normalization method "Default". This normalization method means to apply the default normalization method but also includes the MS Level that might have been chosen at "Settings > Peptide Settings > Quantification".
Green, yellow and red symbols next to items in the Targets tree
After chromatograms have been extracted, Skyline will display one of three symbols next to items in the Targets tree.
The meaning of the symbols next to Transitions depends on whether there is a checkmark next to the "Settings > Integrate All" menu item.
If there is a checkmark next to the Integrate All menu item, then the symbol next to each Transition will be green checkmark ( ) if a peak was detected within the integration boundaries, and it will be a red "X" (
 ) if there was no peak detected between the integration boundaries.
If there is no checkmark next to the Integrate All menu item, then the symbol next to each Transition then there is the further requirement in order to receive a green checkmark that the apex of the transition's peak must be within a quarter of a peak width away from the apex of the largest peak in the peak group. There is also the requirement that the shape of the peak be similar to the shape of the other peaks.
At the Precursor and Peptide or Molecule level, the symbol will be a green checkmark () if all of the Transitions below it in the Targets tree have a green checkmark next to them. The symbol will be a yellow triangle ( ) if at least half of the Transitions below it have a green checkmark. The symbol will be a red "X" () if fewer than half of the Transitions below it have a green checkmark.
The decision about which color symbol appears next to these items is based on the peak shape in the currently selected replicate.
Batch Calibration
Skyline 19.1 allows you to specify the "Batch Name" on replicates so that different replicates will use a different set of external standards.
See the attached PowerPoint to see how to use this feature.
SureQuant and Triggered Acquisition
SureQuant Tutorial (posted May 9, 2022)
To learn more about using Skyline with SureQuant take a look at this tutorial. Here is the supplemental data for the tutorial.
Triggered Acquisition Setting
As of Skyline-Daily 20.1.1.83, Skyline-Daily has support for "Triggered Acquisition" methods.
A Triggered Acquisition method is one where the mass spectrometer has been told to begin collecting MS2 scans for one analyte when the mass spectrometer sees particular transitions for a different precursor.
This will enable Skyline to work better with assays such as Thermo's SureQuant Targeted Mass Spec Assay Kits
The Transition Settings > Instrument tab will have a "Triggered Acquisition" checkbox which tells Skyline that there may be large gaps between the points in an analyte's chromatograms.
When Triggered Acquisition is selected, Skyline will detect these gaps and make sure that integration boundaries do not cross these gaps. Also, Skyline will perform no background subtraction when Triggered Acquisition is enabled.
For more information, see the attached PowerPoint.
Surrogate Standards
Sometimes you want to normalize a particular analyte against a different molecule. Skyline supports this with the "Surrogate Standard" feature.
To designate that a molecule can be used as a surrogate standard, right click on the molecule in the Targets tree and choose "Set Standard Type > Surrogate Standard".
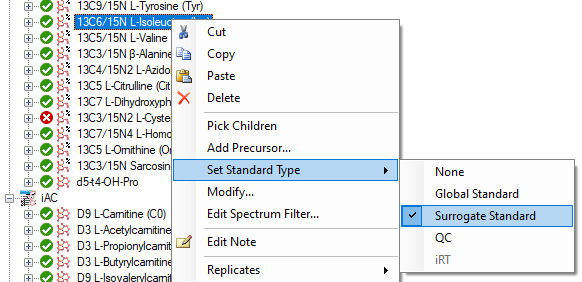
You have to use the Document Grid to change the normalization method of the analyte. You can use the "Molecule Quantification" or "Peptide Quantification" report or you can create your own report that includes the "Normalization Method" column.
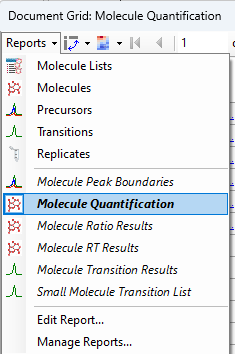
If you have surrogate standards in your document, then the "Normalization Method" column will have options of the form "Ratio to surrogate..."
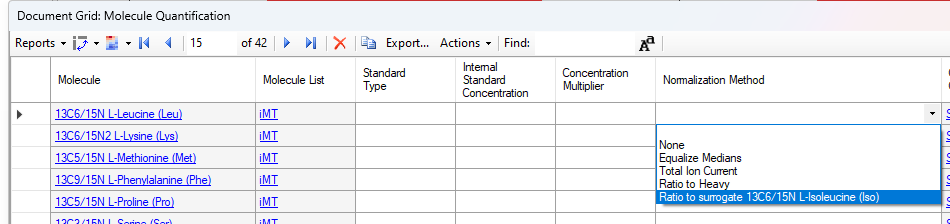
Surrogate External Standards
A new feature first available in Skyline-daily 23.1.1.342 is "Surrogate External Standards"
When a Surrogate External Standard has been specified for a peptide or molecule, the surrogate standard's calibration curve will be used for quantifying the analyte instead of the analyte's calibration curve.
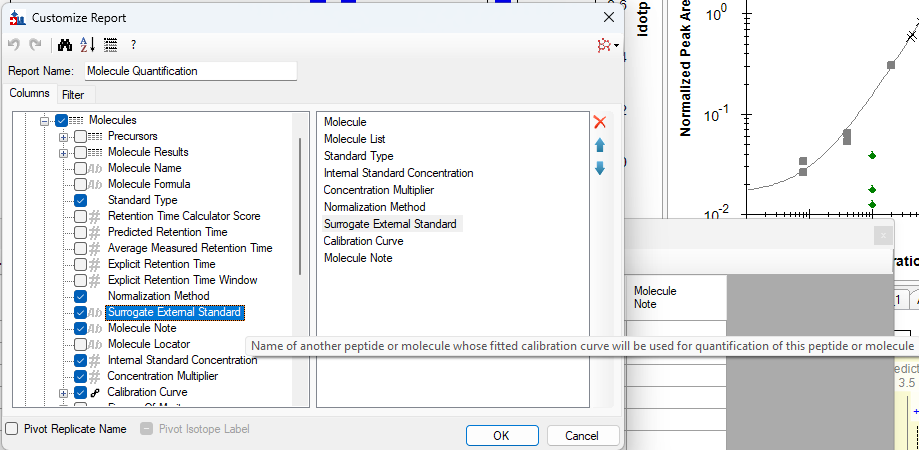
The column appears in the Document Grid as a dropdown where you can choose any of the "Surrogate Standards" in the document: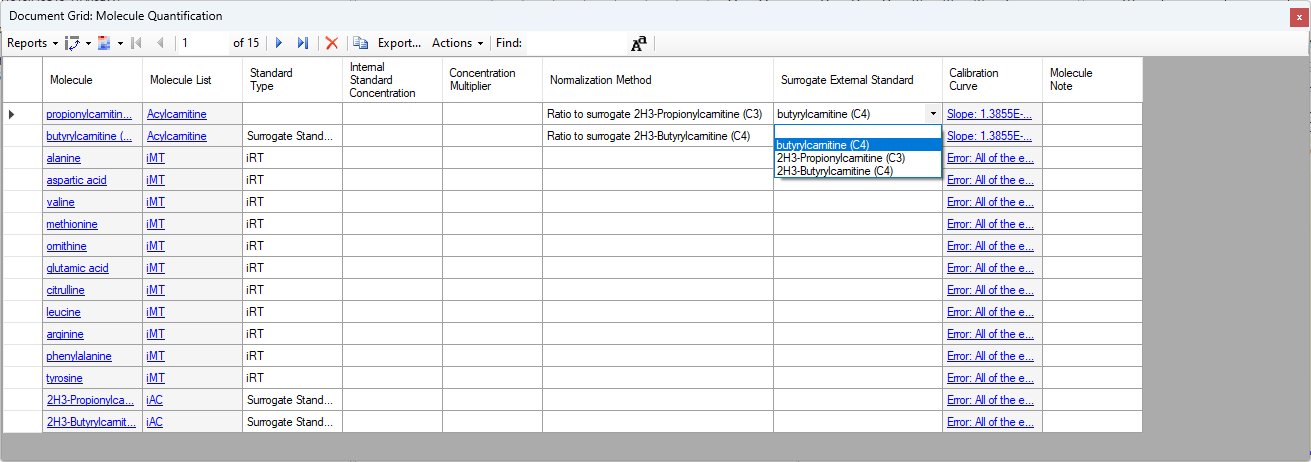
When a Surrogate External Standard has been specified for a molecule, the "Unknown" and "Quality Control" values on the calibration curve will get their values from the original molecule, but all of the other sample types (Standard, Blank, etc.) get their values from the surrogate external standard molecule: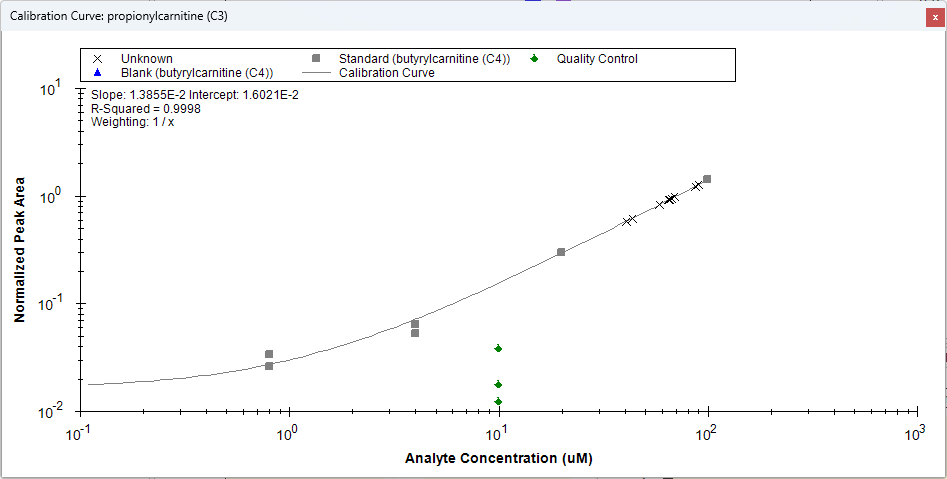
How Skyline Calculates Peak Areas and Heights
Definitions:
- Background height: minimum intensity at peak boundaries (the blue line in the image below)
- Background area ("Background" in the table below): total integrated area of the minimum of background height and intensity at each point
- Peak height ("Height" in the table below): maximum intensity between peak boundaries minus background height
- Peak area ("Area" in the table below): total integrated area within peak boundaries minus background area. Area plus background always equals raw area below the curve.
NOTE: Skyline uses points that have been linear interpolated from the raw data onto a uniform interval over the duration of the chromatogram in detecting its peak boundaries and calculating its peak areas. These are also the points Skyline displays in its chromatogram graphs. Skyline uses several types of smoothing (1st derivative, 2nd derivative and Savitzky-Golay) in order to place its automatically calculated peak boundaries. These smoothed curves are available for display in the Skyline chromatogram graphs. Skyline does not, however, use smoothed data in calculating peak areas (or area under the curve - AUC). It always uses the raw interpolated points presented in the unsmoothed graphs.
Example of calculation of peak height and background area:
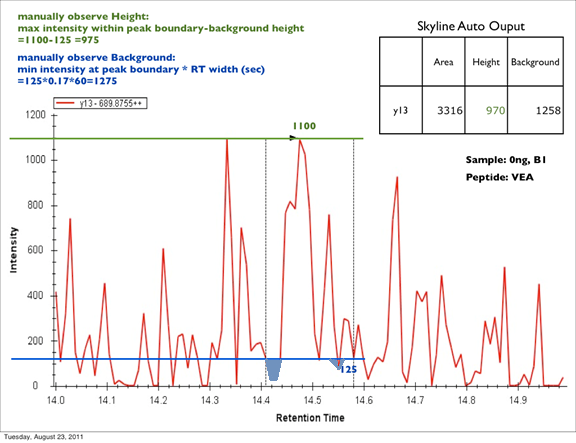
The background area is the rectangle bounded by the background height (blue "125" line) and peak boundaries (gray dotted lines), less the areas of the chromatogram that descend below the background height (light blue areas). You may have noticed that the light blue area at RT=14.55 does not exactly match the shape of the chromatogram: for speed and simplicity the area calculation simply uses the RT of the points to left and right rather than calculating the slope and intercept to get the RT where the chromatogram nominally crosses the background height line. This is a very small discrepancy in most cases.
Skyline graphs this background area information when you select a single transition. You will see the peak area value shaded in red, and the background area shaded in gray. You can place the cursor to the left of the y-axis and use the scroll wheel to zoom in the y-dimension to better inspect the background shading.
Skyline System Requirements
OPERATING SYSTEM:
Skyline is currently developed for Windows 10 and later.
Skyline is tested nightly on 64-bit Windows 10 and Windows 11.
Skyline was tested nightly on 64-bit Windows 7 until 2/23/2024 when use was below 2%.
Skyline 23.1 is the last major version to support Windows 7.
Skyline discontinued releasing 32-bit builds in 2021 after use fell below 1%. You can still download and install older builds.
Skyline 2.6 was the last version to support Windows XP.
-> All versions of Skyline since 1.4 can be downloaded from "Unplugged" installation pages by clicking "I Agree" and then the "Archive" link.
PROCESSOR, MEMORY AND DISK:
There is no minimum requirement, but for performance reasons a large fast hard drive is desirable. The amount of memory needed depends on the size of your experiments, but 4GB is a good start. Skyline is frequently taught on relatively average modern laptops. But, for larger-scale processing we recommend a more powerful desktop system with dual 24- or 27-inch monitors to take full advantage of Skyline display capabilities.
We recommend modern i7 quad-core processors, running at 3.5 to 4.0 Ghz work well, with 16 to 64 GB of RAM and a fast SSD (e.g. 500 GB) + a spinning HD with more room (e.g. 2 TB).
A modern option as of June 2021 of the type favored by Skyline developers can be found on Amazon:
Dell XPS 8940 Tower Desktop Computer - 10th Gen Intel Core i7-10700 8-Core up to 4.80 GHz CPU, 64GB DDR4 RAM, 2TB SSD + 4TB Hard Drive
For really large-scale projects, like hundreds of DIA or DDA files with many hundreds of thousands of transitions, Skyline now makes effective use of highly multi-processor (NUMA) servers with 192+ GB of RAM. We have been using Dell PowerEdge R630 with 48 logical processors and 192 GB (spec attached - purchased for under $10,000 USD). For best import performance, use SkylineRunner command-line interface with --import-process-count=12 (or similar). Be sure to run tests. Mileage may vary depending on the import file format and disk drive type and speed.
Parallel Import Performance
Attached to this page you will find a thorough study of how Skyline scales importing large scale DIA data with parallel file import of various file types on either a standard Intel i7 comptuer with 16 GB of RAM versus a Dell PowerEdge with 48 logical processors 196 GB of RAM, using either multiple threads or multiple processes.
General findings include:
- Multiple process import can scale past mutiple threads in the same process (which we think is related to garbage collection)
- Only multi-process import can take advantage of the true potential of a NUMA system with 24+ logical cores
- The difference is much less pronounce on an i7 an may not be worth the effort to go multi-process
- Many formats pay only a percentage increment for spinning disk versus SSD
- The mz5 format, otherwise the fastest format to import, has serious problems scaling with parallel file import on a spinning drive
At the time of this writing, only the Skyline command-line interface (presented by SkylineRunner or SkylineCmd) can take advantage of multi-process import by using the --import-process-count argument.
Vendor-Specific Instrument Tuning Parameters
As of release 3.5, Skyline's small molecule support includes the ability to explicitly set many vendor-specific instrument tuning parameters on a per-precursor basis.
The "Insert Transition List" dialog for small molecules now has columns for importing various vendor-specific values such as "S-Lens", "Cone Voltage", "Declustering Potential" and "Compensation Voltage", along with the previously implemented ability to explicitly set "Collision Energy", "Retention Time" "Retention Time Window", "Drift Time", and "Drift Time High Energy Offset". These values can also be modified in the Document Grid.
These values can also be modified in the document grid for peptides (formerly this was only possible for small molecules).
By default S-Lens values are not written: a new checkbox in the Export Method dialog enables this for appropriate Thermo outputs. On the commandline side, there is a new argument "exp-use-s-lens" for this.
Ardia Platform setup and importing a file from Ardia Platform
NOTE: Skyline is compatible only with Ardia 1.1 and is NOT compatible with Ardia 1.0 and we do not recommend installing / attempting to connect skyline to Ardia 1.0 (no compatibility and no support for this specific topology).
Adding an Ardia account to Skyline
An Ardia account can be added before importing a file from Ardia Platform or can be added when first importing a file from the Ardia Platform.
To add an Ardia account before importing a file (one time setup in Skyline):
- On the Tools menu, click Options
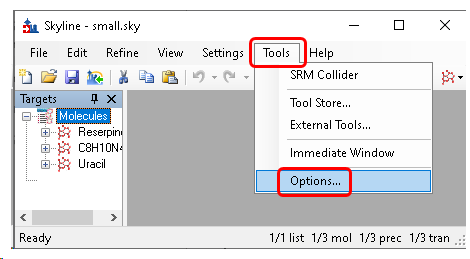
- Click the Remote Accounts tab.
- Click the Edit List button.

- Click the Add button.

- In Remote Account Details form Account type field choose Ardia
- In the Alias field, enter an Ardia Username. This is the Ardia Platform username with which you wish to log in to the Ardia Platform. Please note, that a different account might be used by your organization to register Skyline to the Ardia Platform and a different account may be used by yourself to log in to the Ardia Platform. This Alias field is for the Login.
- In the Server URL field, enter the Ardia Platform Server URL.
- Check Delete RAW files after importing checkbox if you want this. Otherwise, the file is left on the local file system.
- Click the Connect button to establish a login session with the Ardia Platform.

If the window displays "Log in to Ardia Server" with button "Login", this instance of Skyline is already registered with the Ardia Platform server, so Click here to skip to Login.

Registering a Skyline Instance
NOTE: Not all Ardia accounts have permission to register Skyline with the Ardia Platform server, even though they will be able to sign in to the Ardia Platform and import RAW files from Skyline after registration is complete.
Registration is only required once per Skyline installation for a given Windows User and the Ardia Platform server URL.
- Click Register Skyline to start registration.

Go to the opened Web Browser tab and sign in to the Ardia Platform.
(if already signed into the Ardia Platform in the default browser, you will not have to sign in again)
If the account is not allowed to register Skyline with the Ardia Platform, the following will be displayed:
- Click View Account to open the Ardia account home page in the browser and sign out of the Ardia account.
- Click Register Skyline and sign in with an account that can register a client application.

In this case, ask your server administrator to register your Skyline instance.
After Registration is complete the following is displayed:

To use the same Ardia account to sign in with Skyline:
- Click Go to Login.
Otherwise, to use a different Ardia account:
- Log out of Ardia Platform in the browser. Click View Account to open the browser with the account home page and then log out.
- Click Go to Login.
Log in to the Ardia Platform
- Click on Login

The default browser will open with the Ardia Platform login.
- Complete the login.
Upon successful login, you will see a confirmation message.

This login session will be retained in Skyline until the Skyline application is closed or the "Logout Ardia" button is clicked.
- Click Ok in all dialogs back to main window to save this new connection.

Importing a RAW file from the Ardia Platform
Assigning Data Explorer privileges in the Users and Roles utility of the Ardia Core Software does not automatically extend to external applications such as Skyline. To ensure proper access control, you must set appropriate restrictions at the folder level in the Data Explorer application. For example, if you want to prevent a user from downloading files from a specific folder, disabling the Download Data privilege in the Users and Roles utility is insufficient. You must also set access permissions directly on the folder within Data Explorer.
For detailed instructions, refer to the "Manage Folder Access" topic in the Ardia Core Software User Guide.
- On the File menu, click Import then Results
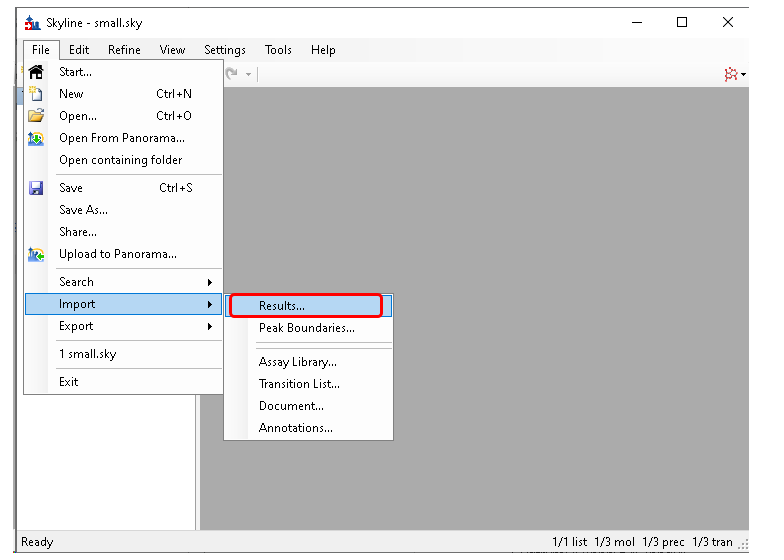
Make selections in dialog and click Ok

- Click Remote Accounts

If there is more than one Remote Account configured in this Skyline instance all the accounts will be listed as shown. Otherwise open the folder/file to download.
- When have more than one remote account, choose an account to use.

If not currently logged into the Ardia Platform since starting Skyline, the browser will open and log into the Ardia Platform.
(If the current Skyline instance has not been registered with the Ardia Platform, that will need to be completed first.)
Then the list of files and folders from the Ardia Platform will be displayed.
Opening a file(s) will download it to the local machine and import it into the current Skyline document.
If the "Delete RAW files after importing" was checked the file will be deleted from the local machine.
Further troubleshooting
-
What happens if an Ardia administrator removes the Skyline installation from the Ardia Platform?
An Ardia administrator can remove the Skyline registration from the Ardia Platform in the Ardia Client Registration and Management utility.This will prevent that Skyline installation from making further connections to that Ardia Platform installation.This will not affect any ongoing downloads.
-
What happens if the User logs out of Ardia in their browser?
In this case, the User will have to re-login to Ardia if they wish to download any other .raw files from the Ardia Platform to Skyline.This will not affect any ongoing downloads.
-
Where can I read more about the Ardia Platform?
Official documentation is available at: https://docs.thermofisher.com/p/ardia-platform
Support for Bruker TOF Instruments
Skyline v2.1 introduces fully integrated support for Bruker micrOTOF-Q and maXis series instruments. The Skyline support for working with full-scan mass spectra has been extended to Bruker TOF instruments, and data acquired with them in several modes:
- MS1 Filtering - chromatogram extraction from MS1 scans in data dependent acquisition (DDA) experiments
- Targeted MS/MS (PRM) - chromatogram extraction from MS/MS scans in pseudo-SRM experiments
- Data Independent Acquisition (DIA) - chromatogram extraction from MS/MS scans acquired in various isolation schemes
- Consecutive wide windows
- All Ions - alternating low energy and high energy scans of the entire instrument range
For more information on working with Skyline and Bruker TOF instruments, consult the following resources:
- HUPO 2012 Bruker Lunch Seminar [PowerPoint][PDF]
- Targeted Proteomics with Bruker TOF Instruments tutorial [PDF]
The following supporting files may also be useful:
SCIEX Instrument Settings
Attached to this page you will find Skyline settings files created by SCIEX as helpful defaults for the QTRAP and TripleTOF instruments.
To load these settings files into Skyline, perform the following steps:
- On the Settings menu, click Import.
- Select one of the .skys files.
- Click the Open button.
This will add a new menu item to the Skyline Settings menu, either QQQ_QTRAP_Environment or TripleTOF_Environment depending on which file you imported. To change the settings on your current document, simply choose one of these menu items. This will change the document settings to the defaults that AB SCIEX has created for their instruments.
Note that if you employ explicit tuning parameters such as Explicit Collision Energy or Explicit Declustering Potential these must be absolute values (i.e. positive numbers). When writing transition lists for negative ion mode operation, Skyline will automatically express them as negative values.
Export SRM Methods for a Thermo LTQ
You may know that Skyline documents can be exported to MRM/SRM transition lists for all of the major triple quadrupole instruments available today. You may even know that Skyline documents can be exported directly to native methods for some of these instruments. But, Skyline can also export SRM method files for the Thermo-Scientific LTQ.
An ion trap instrument like the LTQ may not have the sensitivity of a triple quadrupole, but you can still use one for targeted proteomics, and you can use SRM on the LTQ as a quality control measure for your liquid chromatography.
While you can export an existing Skyline document to a native LTQ method for SRM, you should be aware of a couple settings before you do. To prepare your document for use with the LTQ, perform the following steps:
- On the Settings menu, click Transition Settings.
- Click the Instrument tab.
- Check Dynamic min product m/z.
- Enter the correct value (e.g. 2000) for your instrument into the Max m/z field.
- Click the OK button.
The first setting will restrict the product m/z values Skyline will allow to being greater than a dynamic minimum, based on the precursor m/z, consistent with the limits the LTQ imposes. The second setting will restrict both the precursor and product m/z values Skyline allows to be consistent with what your LTQ is calibrated to allow.
If you have done this on an existing document, you should probably review your transitions to be sure Skyline has not removed anything important. Small product ions may no longer be measurable on the LTQ, which could cause some precursors to contain fewer transitions than you want for your experiment.
If this is a new document, you can now enter the peptides you are interested in targeting as you would normally, understanding that some smaller product ions that you would normally see will no longer be available in the Skyline user interface.
When you are ready to export a LTQ method file for your Skyline document, you must transfer your Skyline document to the instrument control computer for your LTQ instrument, where you will also need to have Skyline installed. If you are using a complex document involving spectral libraries, you may want to consider using the Share command on the File menu, as described in the tip on Sharing Skyline Documents in Manuscripts.
Once you have your Skyline document open on the LTQ instrument control computer, you are ready to export it to a native LTQ method or .meth file. To do this, preform the following steps:
- On the File menu, choose Export, and click Method.
- Choose 'Thermo LTQ' from the Instrument type list.
- Click the Browse button beside the Template file field.
- Browse to a .meth file you will use as a template for all settings other than the m/z values to monitor.
- Click the Open button in the Method Template form.
- Choose options in the rest of the Export Method form as you would for exporting a transition list or a TSQ native method.
- Click the OK button.
- Enter a name for your method, or root name if creating multiple methods.
- Click the Save button.
Using SRM for Liquid Chromotography Quality Control on the LTQ
Issues with chromatography can easily go unnoticed on systems performing predominantly shotgun data dependent analysis (DDA). They can, however, still greatly effect performance, especially if you are hoping to use tools that analyze MS1 scan data for quantification and feature detection. At the MacCoss lab, we are using SRM methods generated with Skyline to monitor LTQ system performance. Every tenth run on our LTQ instruments, we inject a known standard mix and measure its abundant peptides using SRM. We find that measured retention times and peak shapes of known peptides give us increased visibility into system performance of the LTQ.
At present we are injecting the "6 Bovine Tryptic Digest Equal Molar Mix PTD/00001/63" from Michrom Bioresources, Inc., running SRM methods generated with this Skyline document:
Bovine_Mix_QC.sky
Below are examples of Skyline displaying both failing and passing runs on our LTQ Velos. Each QC replicate displayed in Skyline was taken as every tenth injection with the other 9 injections used for normal shotgun MS/MS measurement.
Failing:
In the QC runs shown below, chromatography issues first appear between runs 9 and 12. By QC13, the system is clearly not functioning acceptably.
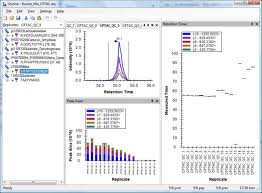
Passing: In the 33 QC runs shown below, both a retention time drift of about 2 minutes and decreasing intensity are visible, but measurements remain within an acceptable range throughout.
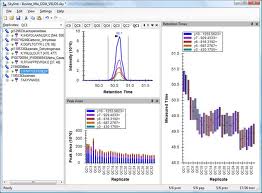
Integration with Other Tools
The Skyline project has implemented integration with many tools and instrument platforms. Skyline supports building spectral libraries from the outputs of nearly 20 different peptide spectrum matching pipelines. It exports methods to and imports data from the instruments of 6 different vendors. And, Skyline integrates with a number of external tools and the Panorama targeted proteomics knowledge base.
Here are two brief tutorials describing how Skyline also integrates with other chromatography-based quantitative tools and information they may produce:
Importing Integration Boundaries from Other Tools
This tutorial covers Skyline support for importing the start and end integration times determined for peptide elution by tools other than Skyline. You can use this feature to benchmark or visualize the performance of other tools, or simply to incorporate their results into a Skyline-based workflow.
Importing Assay Libraries
Several tools have begun to use enhanced transition lists (with added relative product ion abundance and normalized retention times - iRTs) called "assay libraries". To better support this format, Skyline will now suggest creating an iRT calculator and a minimal spectral library during transition list import when these extra columns are detected. Learn what to expect and what to watch out for when using this feature.
Build a Carafe Library
This is a short guide to demonstrate enabling Carafe in Skyline and building a Carafe AI-generated and fine-tuned library for a set of target peptides. For this guide we will use a small FASTA of abundant proteins.
Download the attached FASTA file: some-proteins.fasta
Download and extract the following mzML formatted DIA Raw Data and tsv formatted search results from the following link: Carafe Test Data
A special version of Skyline supporting Carafe integration is available here: Carafe Preview Build
After installing the Carafe Preview Build of Skyline, you can build Carafe AI-generated libraries in Skyline using the following steps:
Open Skyline and start with a blank document.
- Click the File menu, then Import > FASTA...
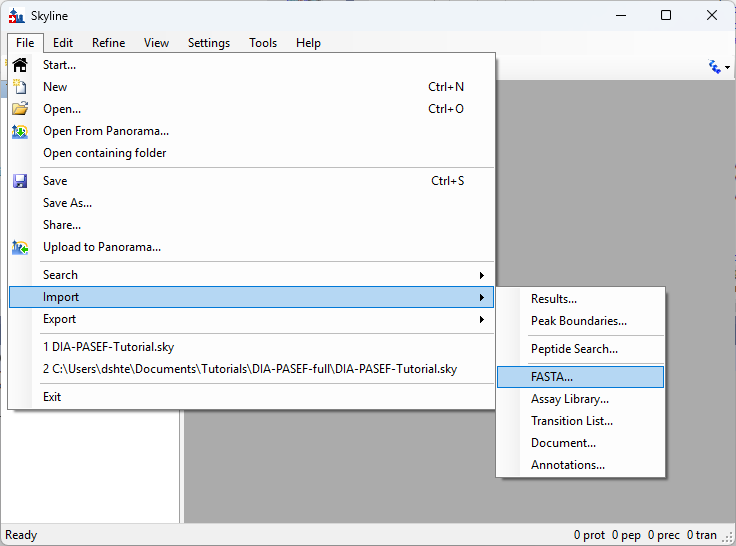
- Click the Settings menu, then click Peptide Settings... and select the Library tab:
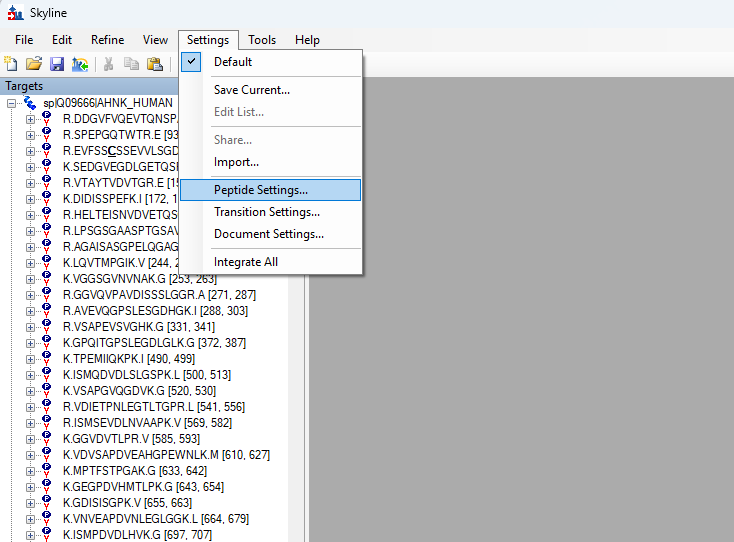
- On the Peptide Settings dialog, in the Library tab, click the Build button

The Build Library dialog will appear:
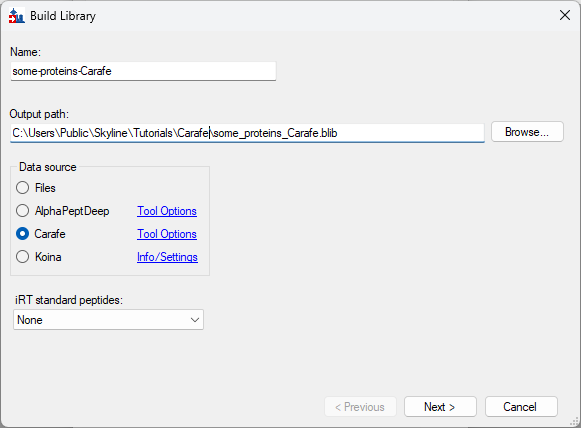
- Give the library a Name and click the Browse... button to choose where to save the library.
- Select Carafe as the Data source.
- Click the Next button
The Build Library dialog will present options for tuning Carafe predictions:
- On this page make sure the option "Build library for:" shows "Current Skyline Document"
- Select "Tuning data source:" as "DIA-NN Report Document"
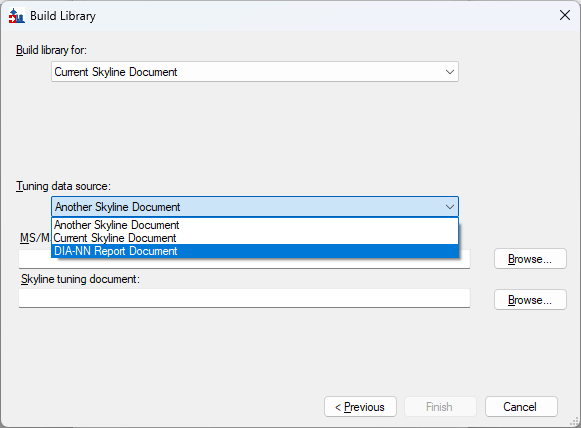
- Select the DIA Raw Data file you downloaded above as the "MS/MS data"
- Select the report.tsv file you downloaded above as the "DIA-NN report document"

- Click the Finish button
In a new Skyline installation, the first usage of Carafe requires setting up a Python environment:
- Click OK to proceed with the Python installation
To enable python to install and operate properly, the Windows registry key "LongPathsEnabled" must be set on the computer. To change this setting
Administrator privileges are required, or you can change the registry through Windows as an Administrator:
- (See "LongPathsEnabled Wiki Entry" for more information.)

If the computer is equipped with an Nvidia Graphical Processing Unit, a dialog will appear asking if you want to enable Nvidia GPU Computation for significantly faster performance of Carafe modeling. This step requires Administrator privileges to install Nvidia software on the computer.

- If you have Administrator credentials, and want GPU-enabled support click Yes.
- Otherwise, if you don't have Administrator privileges but want to use GPU-enabled processing consult with your System Administrator for help.
- Alternatively, you can click No to use Carafe with CPU processing for building libraries.
If you choose to enable Nvidia GPU Computation you will see another window that will download Nvidia software and guide you through the installation process. Follow the steps presented and please be patient because this can take a long time, but it only has to be done once per computer...
- After Nvidia is downloaded, configured and installed, Skyline will continue with the Python installation.
The Python installation and configuration process can sometimes take 10 to 15 minutes, depending on the speed of the internet connection, please be patient...
If the Python installation completed successfully you should see the following message:

- Click OK.
While building the library, Skyline will present a series of dialog messages, with the last being the following dialog:
Back on Peptide Settings dialog:
- Click the checkbox to enable the newly built library
- Click on Explore...
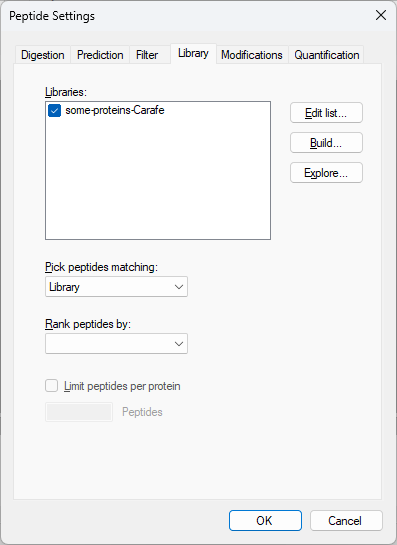
This brings up the Spectral Library Explorer dialog:
- Click on "B" and "2" in the right vertical toolbar enable B and 2+ fragment ions
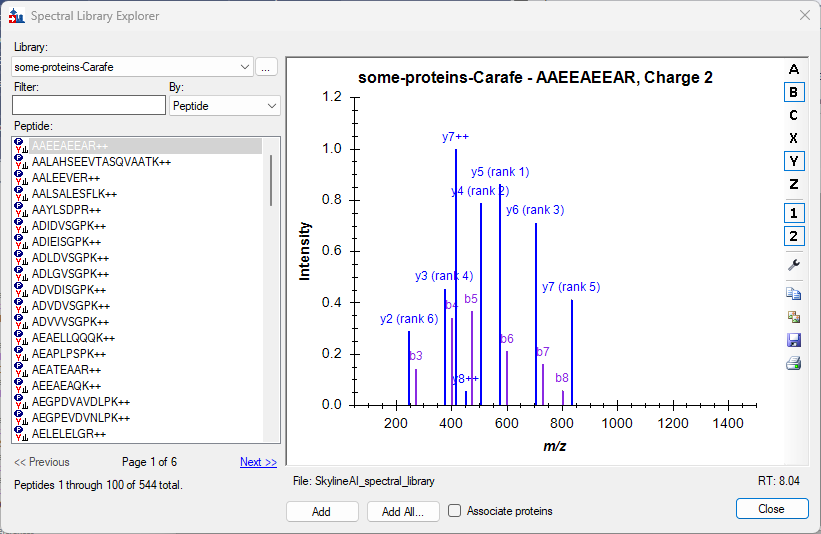
- For each peptide ion in the predicted library, Carafe predicted tuned Retention Time (RT) is displayed in the lower right-hand corner, underneath the predicted spectrum.
- You can scroll through the list of peptide ions to visualize the predictions.
Now if you do the "Build Koina Library" steps you can compare the Koina and Carafe built libraries.
Or if you do the "Build AlphapeptDeep Library" steps you can compare the AlphaPeptDeep and Carafe built libraries.
Thank you!
How Skyline Builds Spectral Libraries
Skyline builds spectral libraries using a separate program called BiblioSpec, which has two main components. BlibBuild is called to build the redundant library, which is then filtered by BlibFilter to create the non-redundant library. The BlibBuild page contains information on the various search engines that are supported, along with information about their respective file formats and the scores used with the cut-off value specified in Skyline.
BlibFilter chooses the best spectrum within a group by simply using the one with the best score. If there are multiple spectra tied for the best score, the one with the highest TIC is selected. In the past, BlibFilter chose the spectrum with the highest average dot product when compared to all other spectra within the same group, but this method occasionally produced poor results. A similar method, computing a consensus spectrum and its dot product against the related spectra, also produced inferior results as it sometimes resulted in high-noise spectra being chosen.
Skyline with BiblioSpec supports building libraries from the following peptide spectrum matching pipeline outputs:
| Database search | Peptide ID file extension | Spectrum file extension *RAW includes vendor formats like RAW, WIFF, .D, etc. |
Score Used | Notes |
| Generic SSL | .ssl | score column | A generic format for encoding spectrum library entries. | |
| ByOnic | .mzid | .MGF, .mzXML, .mzML | AbsLogProb | |
| Comet/SEQUEST/Percolator | .perc.xml, .sqt | .cms2, .ms2, .mzXML | q-value | Percolator v1.17 does not include sequence modification information therefore the .sqt file from the SEQUEST search must be present in the same directory, the directory containing the cms2/ms2 spectrum files, or the current working directory. |
| DIA-NN | .speclib and .tsv or .parquet | Global.Q.Value | No separate spectrum file, but results for individual runs are read from a TSV or Parquet file in the same directory as the speclib. | |
| IDPicker | .idpXML | .mzXML, .mzML | FDR | The name(s) of the spectrum file(s) are given in the .idpXML file. |
| MS Amanda | .pep.xml, .pepXML | .mzML, .mzXML, .MGF, RAW* | q-value | |
| MSFragger | .pep.xml, .pepXML | .mzML, .mzXML, .MGF, RAW* | q-value | |
| MSGF+ | .mzid, .pepXML | .mzML, .mzXML, .MGF, RAW* | expectation value | |
| Mascot | .dat | expectation value | No separate spectrum file. | |
| MaxQuant Andromeda | msms.txt + evidence.txt + mqpar.xml + modifications.xml | .mzML, .mzXML, .MGF, RAW* | PEP | It is possible to use peaks embedded in the msms.txt, but external spectra files are preferred because the embedded peaks are charge deconvoluted. mqpar.xml must be located in the grandparent, parent, or same directory. A custom modifications.xml, modifications.local.xml, or modification.xml can be placed in the same directory as the search results (or specified using the -x option). |
| Morpheus | .pep.xml, .pepXML | .mzXML, .mzML | q-value | The names of the .mzXML files are given in the .pep.xml file and may be in the parent or grandparent directory. Spectra are looked up by index, which is calculated using (scan number - 1). |
| OMSSA | .pep.xml, .pepXML | .mzXML, .mzML | expectation value | The names of the .mzXML files are given in the .pep.xml file and may be in the parent or grandparent directory. |
| OpenSWATH | .tsv | m_score column | No separate spectrum file. | |
| PEAKS DB | .pep.xml, .pepXML | .mzXML, .mzML | confidence score | The names of the .mzXML files are given in the .pep.xml file and may be in the parent or grandparent directory. |
| PLGS MSe | final_fragment.csv | score column | There need not be a . before 'final_fragment'.. | |
| PRIDE | .pride.xml | various | No separate spectrum file. | |
| PeptideProphet/iProphet | .pep.xml, .pepXML | .mzML, .mzXML, .MGF, RAW* | probability score | The names of the .mzXML files are given in the .pep.xml file and may be in the parent or grandparent directory. |
| PeptideShaker | .mzid | .MGF | confidence score | |
| Protein Pilot | .group.xml | confidence score | No separate spectrum file. | |
| Protein Prospector | .pep.xml, .pepXML | .mzML, .mzXML, .MGF, RAW* | expectation value | |
| Proteome Discoverer | .msf, .pdResult | q-value | No separate spectrum file. Libraries cannot be built from databases that do not contain q-values, unless a cutoff score of 0 is explicitly specified. | |
| Proxl XML | .proxl.xml | .mzML, .mzXML, .MGF, RAW* | q-value | |
| Scaffold | .mzid | .MGF, .mzXML, .mzML | peptide probability | |
| Spectronaut | .csv | none | Spectronaut Assay Library export. No separate spectrum file. | |
| Spectrum Mill | .pep.xml, .pepXML | .mzXML, .mzML | expectation value | The names of the .mzXML files are given in the .pep.xml file and may be in the parent or grandparent directory. |
| X! Tandem | .xtan.xml | expectation value | No separate spectrum file. |
Importing Existing Spectral Libraries
Skyline can also directly read existing spectral libraries (without using BlibBuild) including:
- SpectraST (.sptxt)
- theGPM X! Hunter (.hlf)
- Shimadzu (.mlb)
- Golm Metabolome Database (.msp)
- NIST (.msp)
- EncyclopeDIA (.elib)
Working with NIST files
If your library contains spectra for multiple instruments and conditions (e.g. various CE values) it is important to use the NIST-supplied filtering tools to produce a subset of spectra appropriate to your experimental conditions. Each molecule+adduct (or peptide+charge) pair can appear in a .blib file only once, and without thoughtful filtering you will almost certainly produce a .msp file that can't be used by Skyline because it contains more than one instance of a molecule+adduct (or peptide+charge) pair.
Build a Koina Library
This is a short guide to demonstrate enabling Koina in Skyline and building a Koina library for a set of target peptides. For this guide we will use a small FASTA of abundant proteins.
Download the attached FASTA file:
https://skyline.ms/wiki/home/software/Skyline/download.view?entityId=29ff5efd-e725-103d-b4e5-22f535560118&name=some-proteins.fasta
Open Skyline and start with a blank document.
- Click the Tools menu, then click Options.
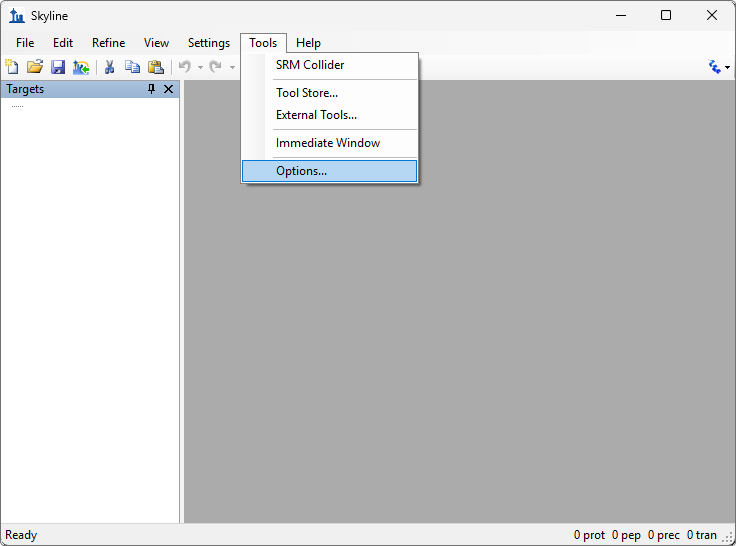
- Select the Koina tab and select the intensity and retention time models to use to build the library:
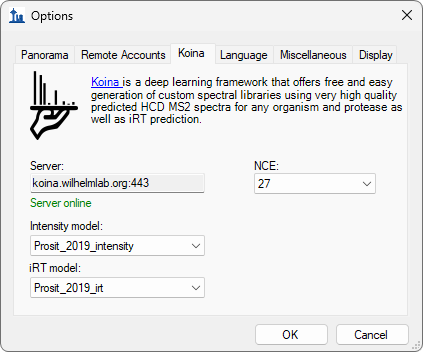
- Click the OK button.
Import the FASTA file you downloaded:
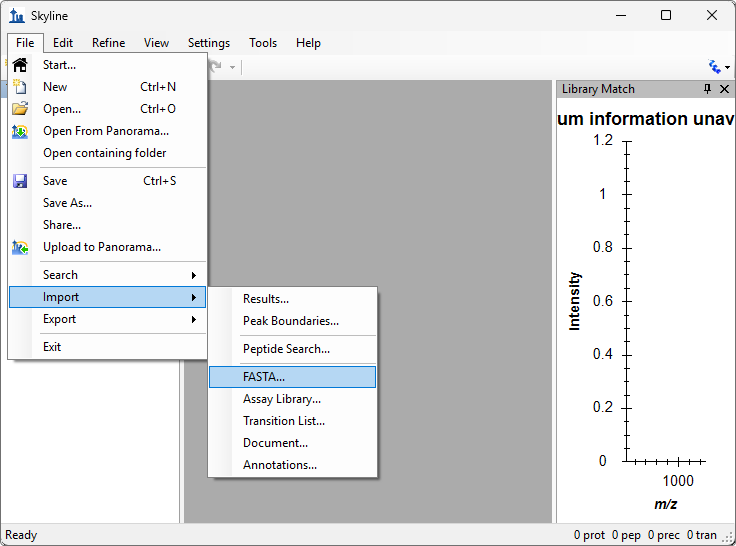
- Click the Settings menu, then click Peptide Settings and select the Library tab:
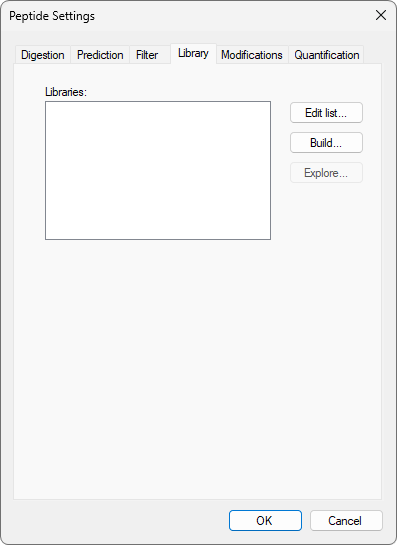
- Click the Build button.
The Build Library dialog will appear:
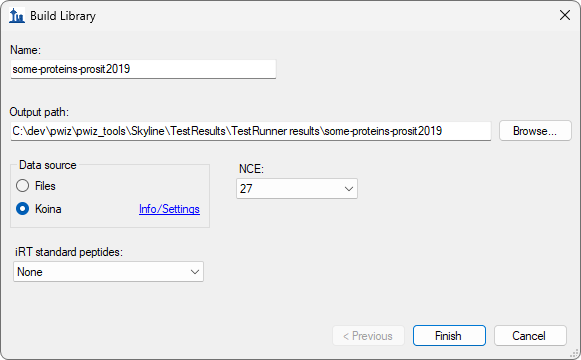
- Give the library a name and click the Browse button to choose where to save the library.
- Select Koina as the Data Source.
- Click the Finish button to begin building the library and close the dialog.
- Back on peptide settings' library tab, click the checkbox to enable the library:
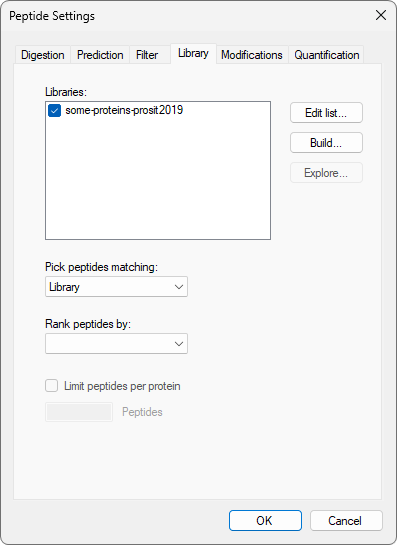
- Click the OK button to close the peptide settings dialog.
- Dock the library spectrum graph in the main document area by dragging the title bar.
- Expand a protein in the target tree and click on a peptide.
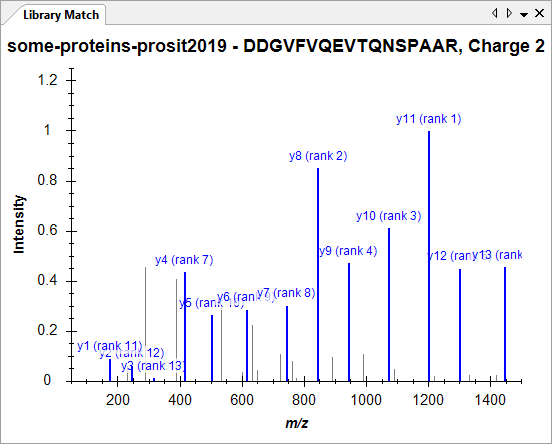
- Right click on the library spectrum and click "Mirror".
- Right click there again and click "Koina".
You will see the generated-on-the-fly Koina spectrum on top compared to the locally stored Koina spectrum mirrored on the bottom:
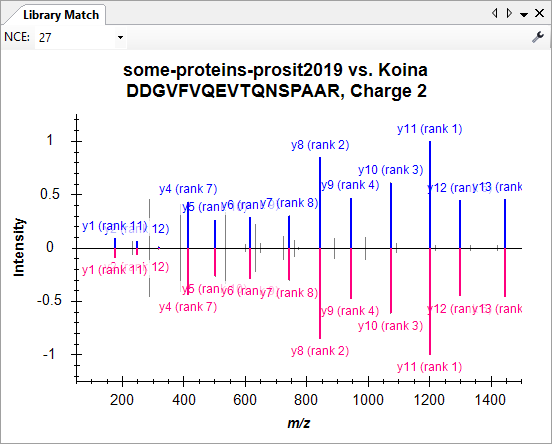
- Go back to Koina settings in Tools -> Options and change to a different model.
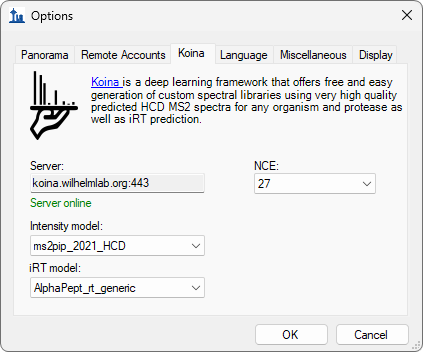
- Select another peptide to refresh the graph with the new Koina model.
You will now see the generated-on-the-fly Koina spectrum on top is different than the locally stored Koina mirror spectrum:
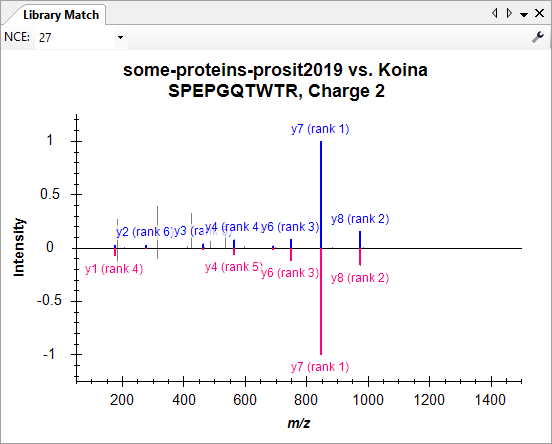
You can keep changing the Koina model or NCE to see how the spectrum changes compared to the local one.
Build an AlphaPeptDeep Library
This is a short guide to demonstrate enabling AlphaPeptDeep in Skyline and building an AlphaPeptDeep AI-generated library for a set of target peptides. For this guide we will use a small FASTA of abundant proteins.
Download the attached FASTA file: some-proteins.fasta
You can build AlphaPeptDeep AI-generated libraries in Skyline using the following steps:
Open Skyline and start with a blank document.
- Click the File menu, then Import > FASTA...

- Click the Settings menu, then click Peptide Settings... and select the Library tab:

- On the Peptide Settings dialog, in the Library tab, click the Build button
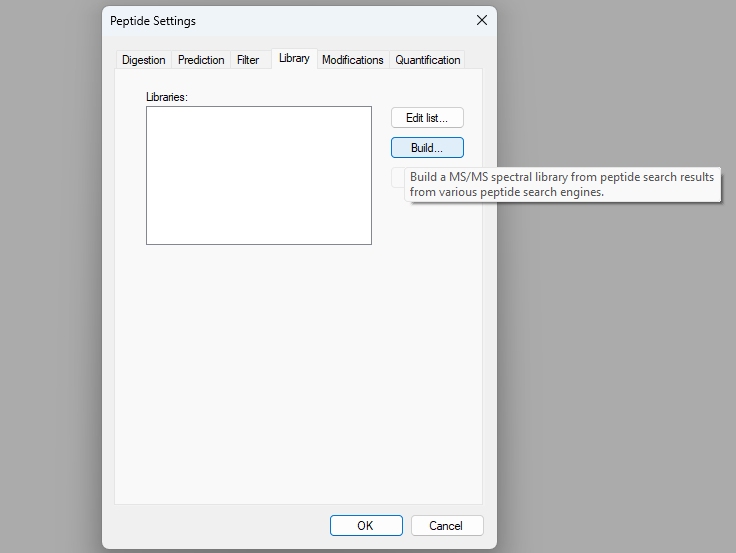
The Build Library dialog will appear:
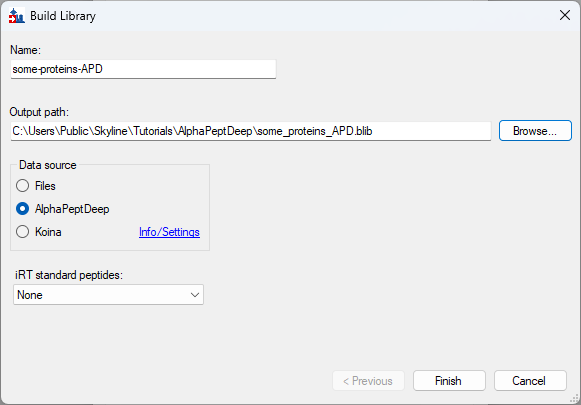
- Give the library a Name and click the Browse... button to choose where to save the library.
- Select AlphaPeptDeep as the Data source.
- Click the Finish button
In a new Skyline installation, the first usage of AlphaPeptDeep requires setting up a Python environment:
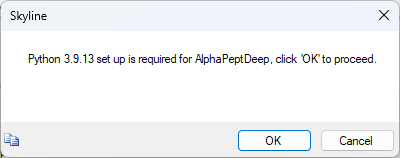
- Click OK to proceed with the Python installation
To enable python to install and operate properly, the Windows registry key "LongPathsEnabled" must be set on the computer. To change this setting
Administrator privileges are required, or you can change the registry through Windows as an Administrator:
- (See "LongPathsEnabled Wiki Entry" for more information.)
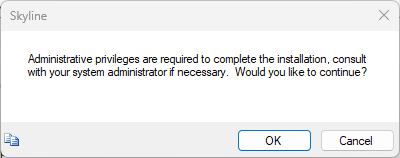
If the computer is equipped with an Nvidia Graphical Processing Unit, a dialog will appear asking if you want to enable Nvidia GPU Computation for significantly faster performance of AlphaPeptDeep modeling. This step requires Administrator privileges to install Nvidia software on the computer.
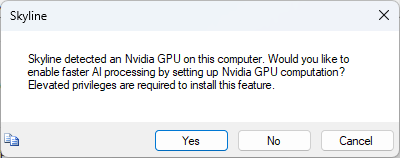
- If you have Administrator credentials, and want GPU-enabled support click Yes.
- Otherwise, if you don't have Administrator privileges but want to use GPU-enabled processing consult with your System Administrator for help.
- Alternatively, you can click No to use AlphaPeptDeep with CPU processing for building libraries.
If you choose to enable Nvidia GPU Computation you will see another window that will download Nvidia software and guide you through the installation process. Follow the steps presented and please be patient because this can take a long time, but it only has to be done once per computer...
- After Nvidia is downloaded, configured and installed, Skyline will continue with the Python installation.
The Python installation and configuration process can sometimes take 10 to 15 minutes, depending on the speed of the internet connection, please be patient...
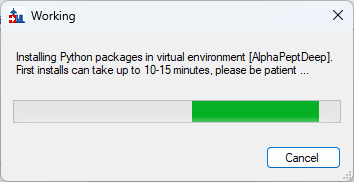
If the Python installation completed successfully you should see the following message:
- Click OK.
While building the library, Skyline will present a series of dialog messages, with the last being the following dialog:
Back on Peptide Settings dialog:
- Click the checkbox to enable the newly built library
- Click on Explore...
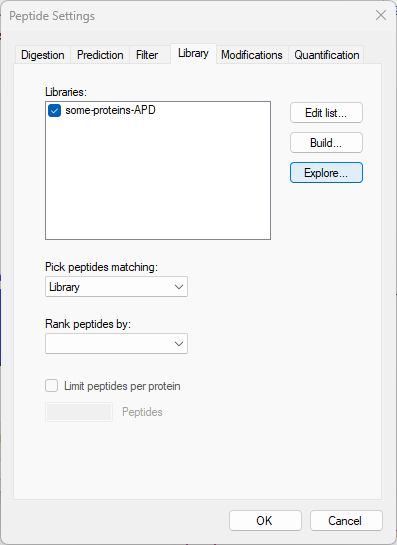
This brings up the Spectral Library Explorer dialog:
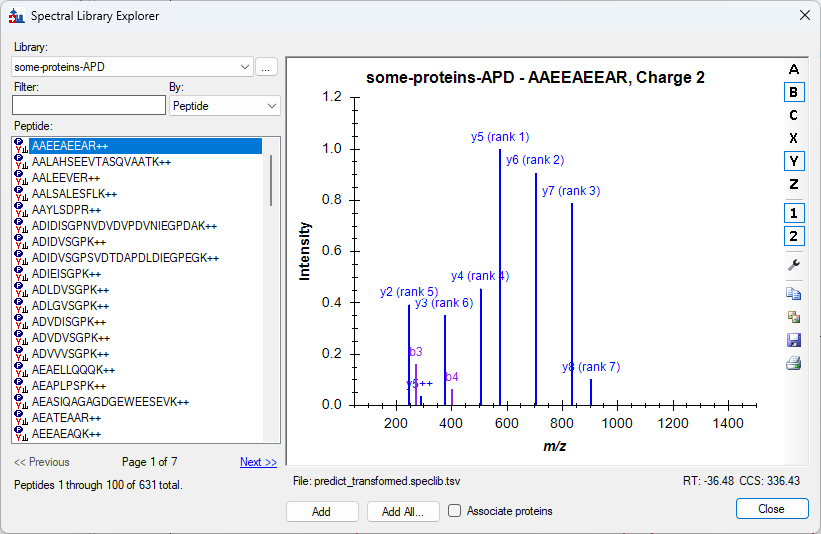
- For each peptide ion in the predicted library, AlphaPeptDeep predicted Retention Time (RT in iRT space), and Collisional Cross Section (CCS in Ų), is displayed in the lower right-hand corner, underneath the predicted spectrum.
- You can scroll through the list of peptide ions to visualize the predictions.
Now if you do the "Build Koina Library" steps you can compare the Koina and AlphaPeptDeep built libraries.
Thank you!
ID Annotations Missing with Mascot Search Results
Skyline supports several workflows where the retention time of peptide search identified MS/MS spectra are used to help it pick chromatogram peaks, and for subsequent visual inspection. The most visible effect of when this extra information is present and usable by Skyline is the addition of ID annotations to the chromatogram graphs, as shown below:
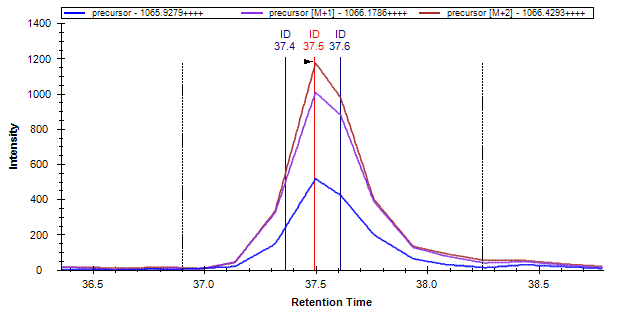
If you build a spectral library or use the Import Peptide Search wizard to import Mascot search results for use with full-scan chromatogram extraction, and find that you do not see ID annotations in your chromatograms as you would expect, the problem most likely originates with the MGF converter you used to create MGF files as input to Mascot.
For Skyline to be able to place an identified spectrum on an extracted chromatogram, it needs two things, beyond the peptide identification itself:
- A spectrum source file name that Skyline can match with the data file used to extract chromatograms.
- A retention time at which the spectrum was measured.
The spectrum source file name does not need to match exactly with the file specified in the Import Results form. Skyline uses base name matching, which counts all of the following files as matching:
- spectrum_source.raw
- spectrum_source.mzXML
- spectrum_source.c.mzXML
- spectrum_source.ms2
- spectrum_source.mzML
Note also that Skyline completely ignores any path information included with the spectrum source file name. Many converters will include a full path, but this is not necessary, and Skyline will match chromatogram data imported from any path, as long as the file basenames match.
The first place to look for clues on contents of any library is the Skyline Spectral Library Explorer (View > Spectral Libraries). A library built from search results that contain the necessary information will look like this:
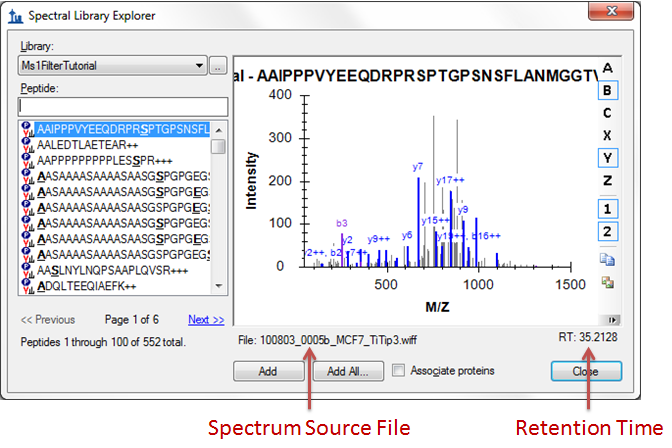
If you click the button beside the Library drop down list, Skyline will display the Library Details form with a list of the spectrum source files from which there are identified spectra in the library:
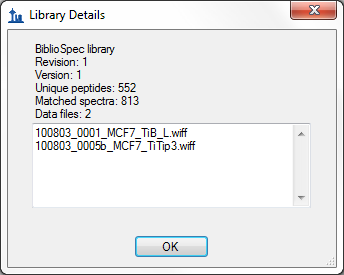
The most common issue you will see with a Mascot DAT file is that it does not contain spectrum source file information in a format that Skyline can understand. That format can be traced back to the TITLE lines in your original MGF file. Thanks to a lack of standardization in this area, a long stream of bug reports has lead to Skyline handling a number of different TITLE line formats, but the most flexible and robust format are:
TITLE=...File: "path/to/file.raw"...
or slightly less robust:
TITLE=...File: path/to/file.raw ...
TITLE=...[path/to/file.raw]
Since the first does not allow spaces in the path, and the second does not allow brackets in the path. Note again that the path information will be ignored by Skyline in matching with imported chromatogram files, though characters in the path can have a negative impact on parsing of some formats (e.g. spaces in format that relies on a space as a terminal character).
The retention times are provided by RTINSECONDS lines in the MGF like:
RTINSECONDS=3006.0281
Problems in either of these can cause issues that show up like the following Spectral Library Explorer figures:
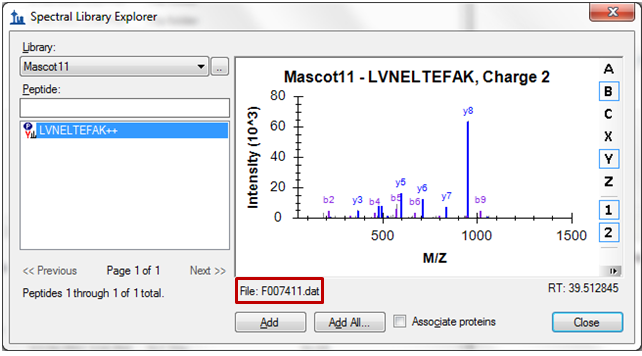
Issue 1: The TITLE line in the MGF file did not contain a recognizable format (described above) from which the spectrum source file can be parsed, causing the DAT file name to be used instead. If your DAT file contains the search results for a single file, this can be corrected by simply renaming the DAT file to have the same base name as the data file you will import for chromatogram extraction (e.g. spectrum_source.dat).
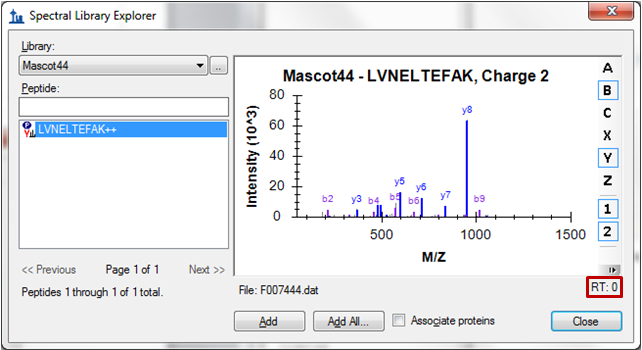
Issue 2: The RTINSECONDS line in the MGF file was missing, causing the spectrum RT value to be set to zero.
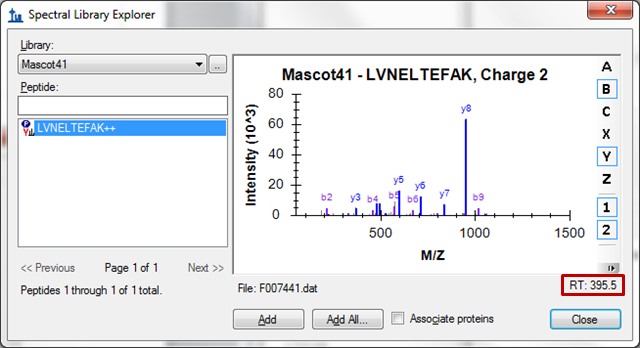
Issue 3: A time outside the gradient length is shown. Something has gone wrong with the library builder parsing this file. You should report something like this to the Skyline team.
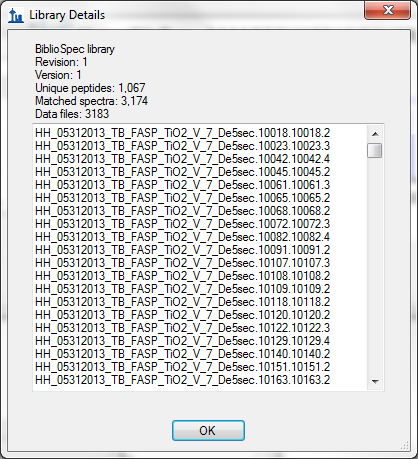
Issue 4: Every spectrum has a different source file not representative of files on disk. Something has gone wrong with the library builder parsing this file. You should report something like this to the Skyline team.
If you run into any problems like this, we always recommend installing ProteoWizard and using MSConvertGUI to create your MGF files, as shown below:
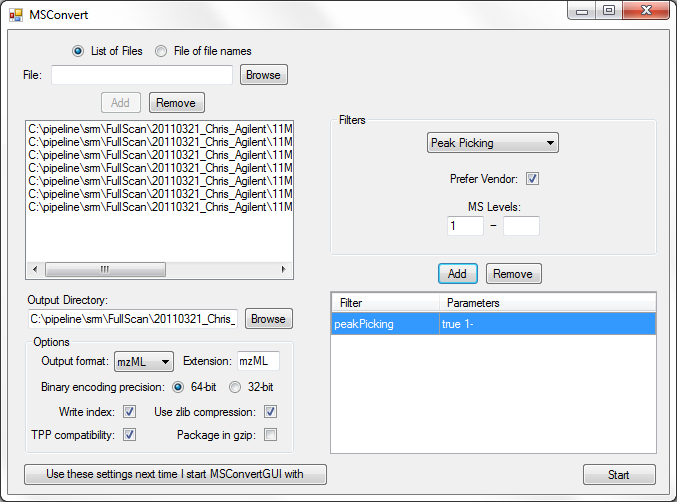
Note that you must make sure the TPP compatibility check box is checked.
If the MGF converter you used comes from an instrument vendor or professional software company, and you want help communicating with them what is required for full integration with a workflow that includes Skyline, either point them to this page, or post your issue to the Skyline support board.
Share Skyline Documents in Manuscripts
Skyline has the following advantages that are not available in any other targeted proteomics software:
- Open source
- Freely available and easy to install
- Vendor-neutral platform for targeted mass spectroscopy investigations of both proteomic and small-molecule data
- Perform analysis of mass spectrometry data from a range of acquisition techniques such as selected reaction monitoring (SRM), data-dependent acquisition (DDA), parallel reaction monitoring (PRM), and data-independent acquisition (DIA)
- Support for SRM instruments from Agilent, SCIEX, Shimadzu, Thermo-Scientific, and Waters
- Support for full-scan instruments from: Agilent, Bruker, SCIEX, Thermo-Scientific and Waters
- Human readable XML document format
- Compact, high-performance, easily shared data cache file format
Once you have created a Skyline document (.sky) and its companion data cache file (.skyd), your entire method and acquired results can be easily shared with other researchers. You are guaranteed that others will have freely available and rich access to your method design and results data.
To create a sharable ZIP file that includes:
- Skyline document (.sky)
- Skyline data cache file (.skyd)
- Skyline display information (.sky.view)
- Either all used spectral libraries or the fraction used by the document (.blib & .redundant.blib)
- The backgound proteome file (.protdb - optional)
Simply perform the following steps in Skyline:
- On the File menu, click Share.
- If the document uses spectral libraries or a background proteome:
- Click the Minimize libraries radio button to share only the library spectra used in your document.
- Click the Store everything radio button to share the libraries and background proteome files as they exist on your system
- Enter the file name of your choice in the File name field (or accept the default).
- Click the Save button.
Your readers will have open access to:
- View your methods and data in Skyline's rich visual environment
- Export transition lists or methods for their own instruments
- Export custom reports for deeper analysis of your data
You can also share the report template(s) you found most useful in analyzing your data by doing the following:
- On the Settings menu, choose Document Settings, and click the Reports tab.
- Check the checkboxes beside the names of the reports you wish to share.
- Save the document.
Sharing Skyline results on Panorama Public
Sharing Skyline documents associated with manuscripts is made easier with Panorama Public, a centralized, community resource of published results processed with Skyline. Panorama Public facilitates viewing, sharing, and disseminating results contained in Skyline documents via a web-browser. In addition to viewing results in the Panorama interface, Skyline documents published to Panorama Public can be downloaded in their original form and opened with Skyline for an in-depth exploration.Submitting Skyline results to Panorama Public involves:
- Getting a free project for your lab on PanoramaWeb, which is a server repository that is used by several laboratories and organizations to store their Skyline-processed data
- Click here to request a new project
- Uploading and organizing Skyline documents within sub-folders of a project on PanoramaWeb
- Documents can be uploaded to PanoramaWeb with the click of a button in Skyline
- Submitting data to Panorama Public
Data submitted to Panorama Public can be private initially while the manuscript is under review. A reviewer account is provided to the submitter. When the manuscript is accepted for publication data is made public.
Panorama Public is a member of the ProteomeXchange Consortium which is a group of repositories dedicated to the standardized submission and dissemination of proteomics data worldwide. Proteomics data submitted to Panorama Public that fulfills all of the ProteomeXchange requirements is assigned a unique ProteomeXchange accession that can be included in the manuscript. Published data associated with a ProteomeXchange ID is made available to a wider research community via the ProteomeXchange portal and can be searched on the portal with the unique PXD accession number assigned to the data.
Skyline and Panorama Public help you give the proteomics and small molecule research cummunity full, open access to your methods and results.
Sharing MS/MS Spectra with Manuscripts
If you are looking for a MS/MS spectrum viewer, you may not be familiar with Skyline, a tool developed primarily to aid targeted proteomics investigation. Skyline does, however, provide features that make it ideal for sharing MS/MS spectra with manuscripts before and after publication. Skyline displays fully annotated spectra for peptides with post translational modifications (PTMs) and neutral losses extremely quickly, and the Skyline software itself is freely available and easy to install. [Install Now]
If you already have a Skyline document that was submitted as part of a manuscript follow the steps below to use Skyline to view these spectra:
- On the File menu, click Open (ctrl-O).
- Select the shared file you are working with (usually .sky.zip).
- Click Open.
Once the file is open in Skyline, it should look something like this:
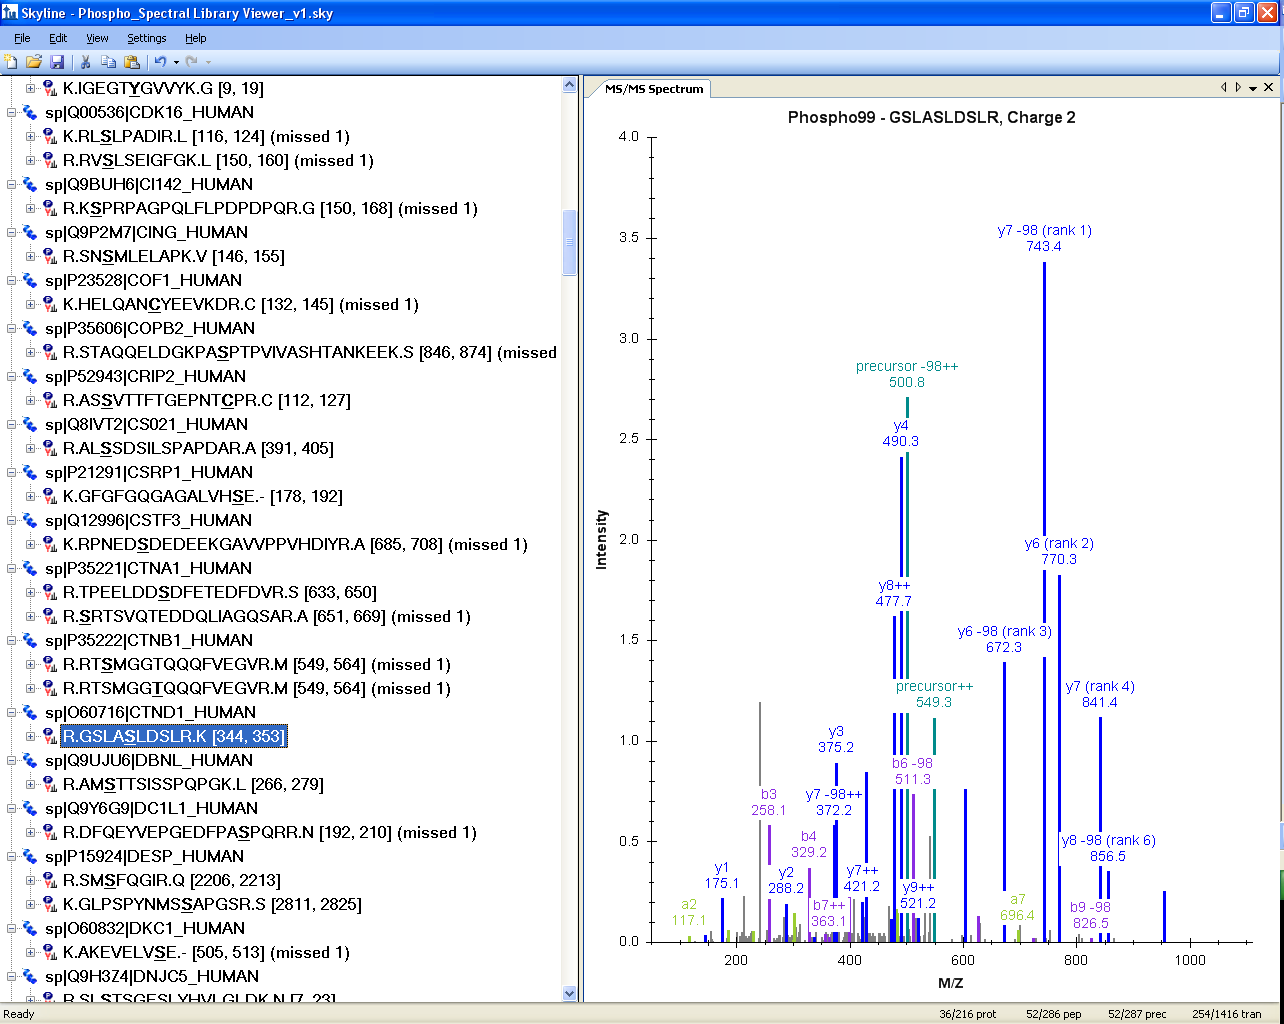
If you do not see the MS/MS spectrum graph:
- On the View menu, click MS/MS Spectra.
If you want to see different precursor charge states for the peptides in the document:
- On the Edit menu, choose Expand All and click Peptides.
Select peptides or precursors in the Peptide View on the left to see the corresponding MS/MS spectrum.
For PTMs in the Peptide View, any modified amino acid is bold and underlined.
If you hover over a protein name, the positions of the peptides it contains are highlighted in bold colored text. If a peptide is selected in the Peptide View, it is highlighted in red.
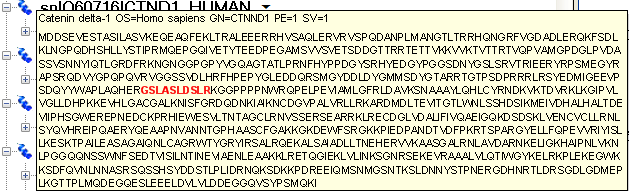
If a peptide of interest contains post translational modifications (as in this case Ser-348 phosphorylation) you can see the modified amino acid bold and underlined in the Peptide view. You can also hover over the peptide and Skyline will present more information in a tip, including the delta-mass of each modification specified in brackets in a field labeled “Modified”.
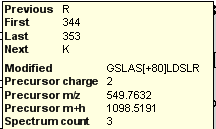
The MS/MS spectrum is interactive and one can zoom into the spectrum, using the mouse scroll wheel or by clicking and dragging a box around a region of interest, to see further fragmentation details.
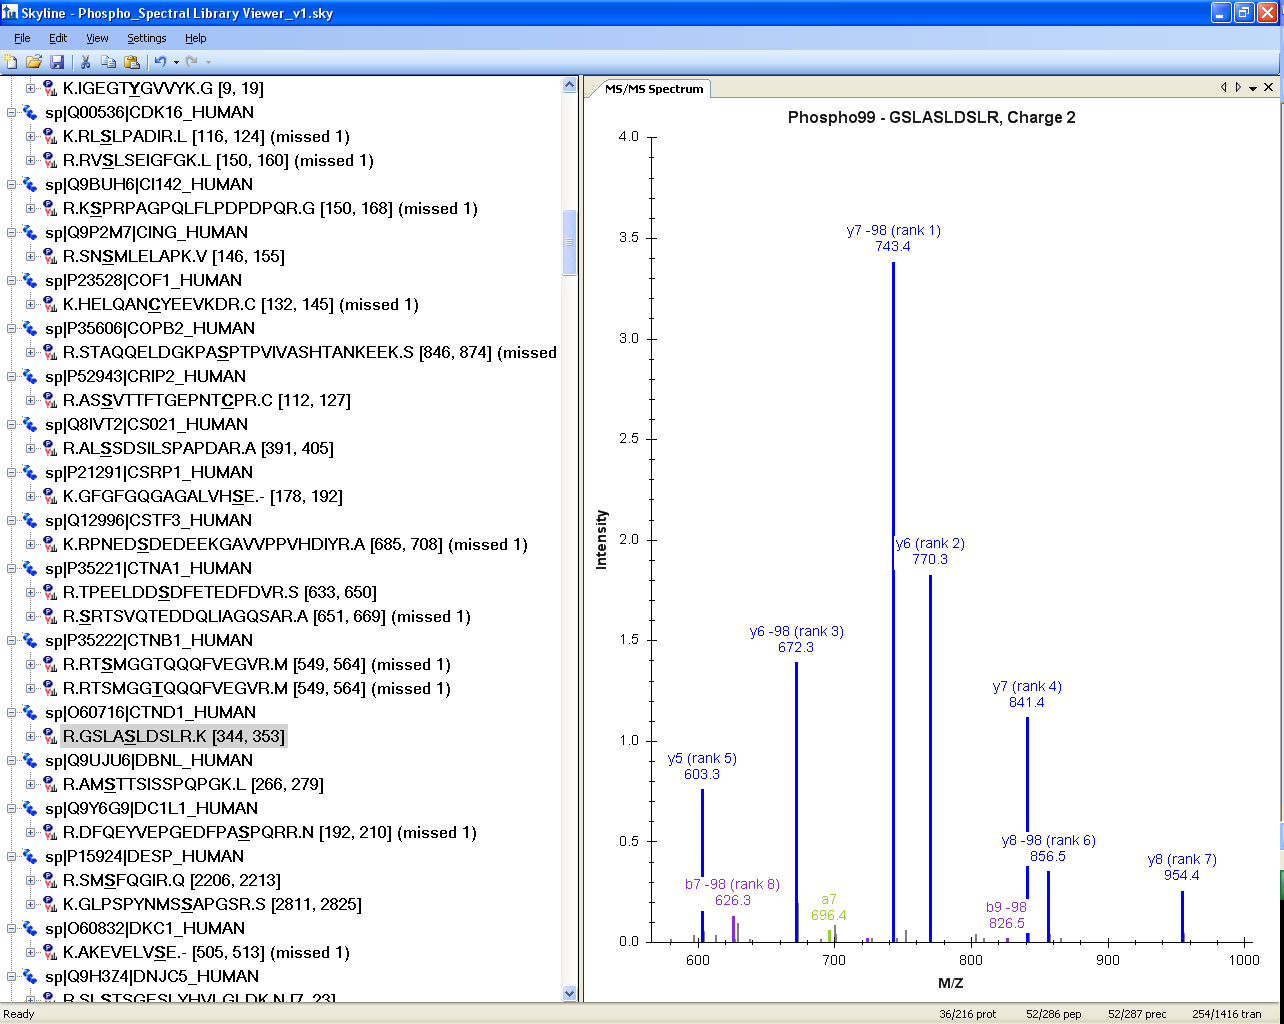
In the above case of MS/MS for GSLAS348LDSLR [344, 353], zooming in clearly shows that Ser-348 is phoshorylated, and that there is no site ambiguity as the y5 ion and the y6/y6-98 ions clearly determine the position of the phospho group on Ser-348.
If there is phosphorylation site ambiguity, and the PTM site is indistinguishable, Skyline can be used to simulate both peptide isoforms and to easily indicate site ambiguity:
Such as the peptide
R.GEPNVSYICSR.Y [272, 282], phosphorylation simulated at Ser-277
and the isoform
R.GEPNVSYICSR.Y [272, 282], phosphorylation simulated at Ser-281
In the Skyline document shown below, both isoforms have a pink triangle in the upper right corner of the peptide label. This triangle indicates an annotation on the peptide.
To view the peptide annotation, right-click on the peptide sequence in the Peptide View and click Edit Node to view a form like the one displayed below. (In version 1.2 and later, these annotations are shown in the peptide details tip mentioned above, and also by themselves if you hover the mouse over the colored triangle.)
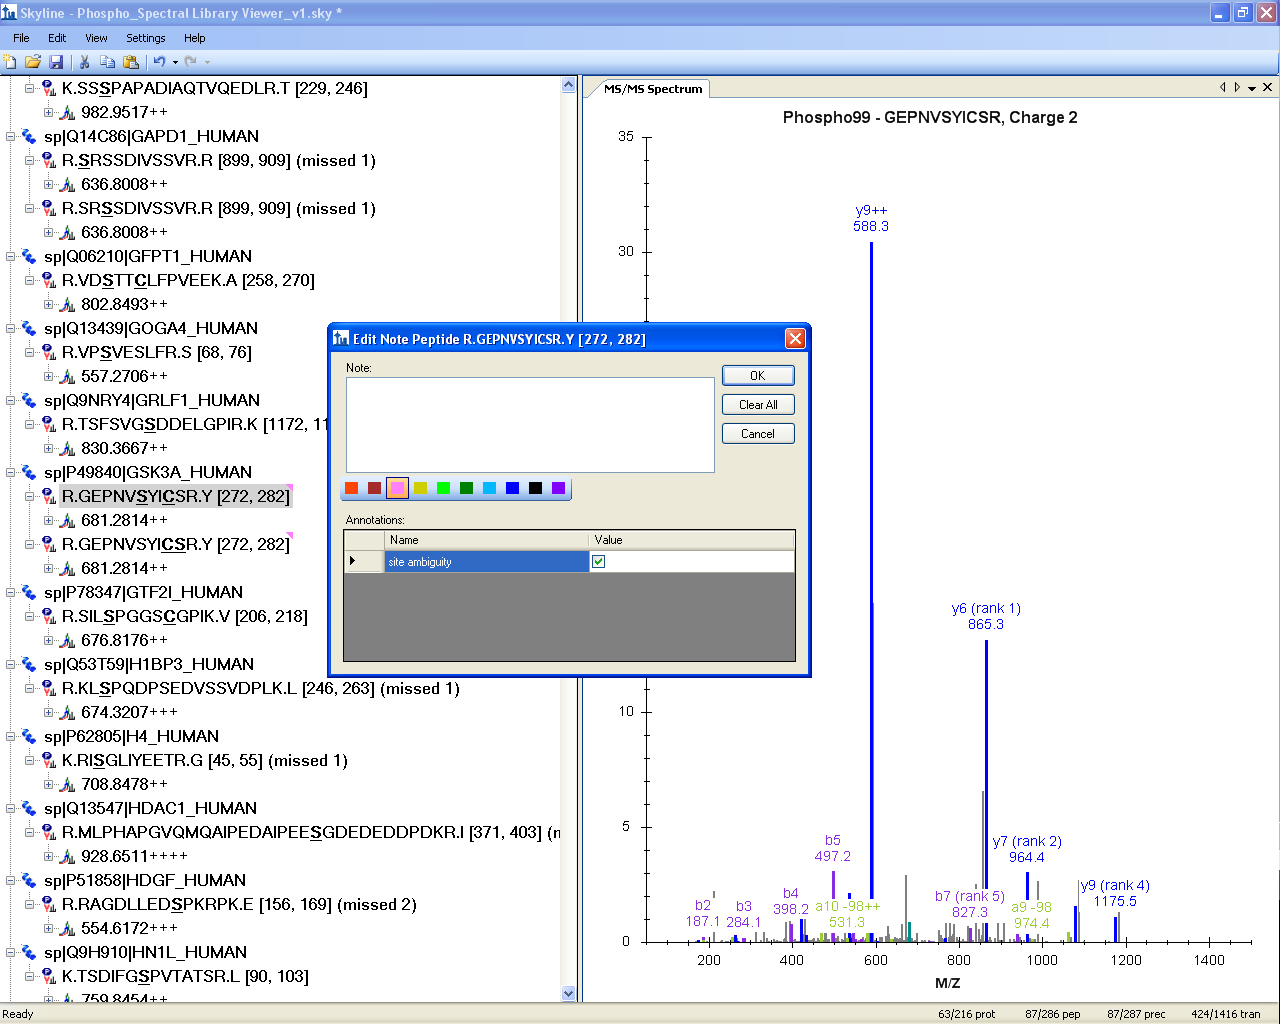
Skyline Custom Annotation can be used to indicate the site ambiguity as demonstrated above with the “TRUE/FALSE” check mark within the peptide note. These Annotations can easily be exported into custom Skyline reports (csv files). For more information on annotations and reports, consult the Skyline Custom Reports & Results Grid tutorial.
Publishing a Skyline document for MS/MS spectrum viewing as part of manuscript submission allows the reader to interactively view MS/MS spectra. Skyline can help with assessment of site ambiguity and allow you to indicate, using custom annotation, cases where site ambiguity of PTMs exists.
These Skyline spectral libraries can be further used to design targeted assays and may provide a valuable resource for researchers interested in a certain data set.
For manuscript submission, Skyline spectral libraries can easily be generated from many common peptide identification search engine outputs, for further details see the Skyline Spectral Library Explorer tutorial.
Miscellaneous
ExD ion types
Overview
Skyline supports commonly used a, b, c, x, y, z ion types with masses calculated according to the Biemann classification [1]. While sufficient for most proteomics experiments, EAD (electron assisted dissociation) and related ionization methods produce some unusual ions that were impossible to track, specifically, z+1 radical ion and z+2 even electron ion[2]. Skyline now supports these ion types starting from version 21.2.1.404.
According to the de-facto standard in the literature, the z• and z’ notation is used for the z+1 radical ion and z+2 ion accordingly. Skyline uses it consistently across the UI in the chromatogram, mass-spectra and the targets tree. The library and full scan spectrum viewers have menu items to enable corresponding peak annotations.
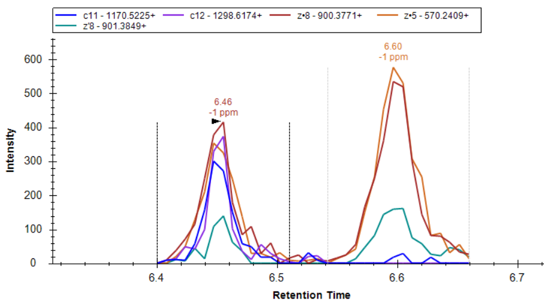 |
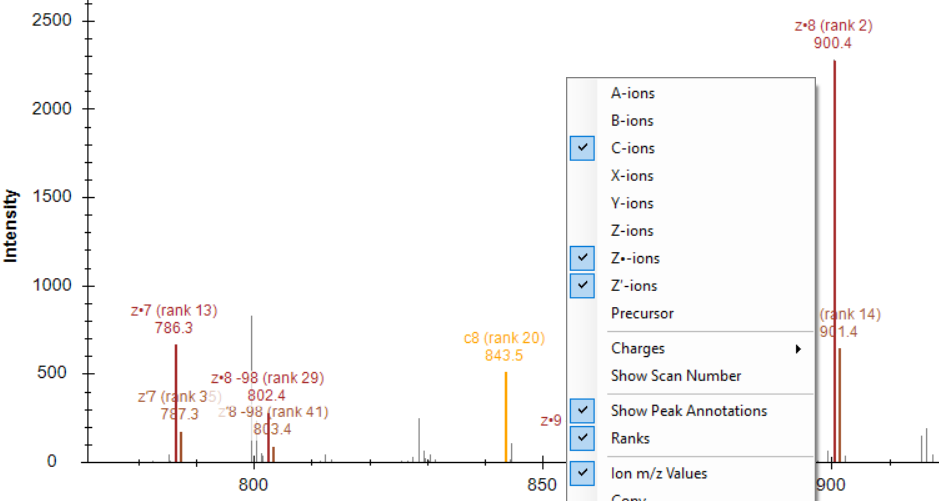 |
Since the • in z• is not a character that is easy to type on a standard keyboard, aliases were introduced to facilitate user input. A couple of places where the aliases are used are the Find function of the ion picker list and the Filter tab of the Transition Settings dialog. z. or z* can be used for z• ions and z’ or z” for z’ ions.
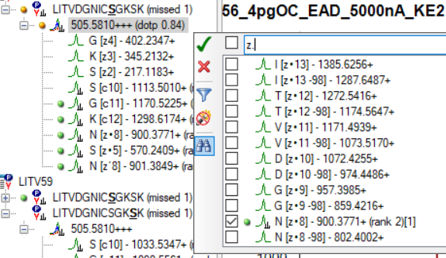 |
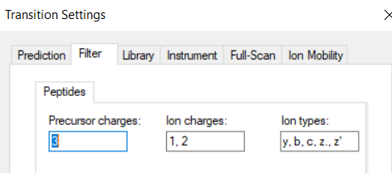 |
References:
1. K. Biemann, Methods in Enzymology, 193, 886-887 (1990)
2. K.O. Zhurov et al., Chem. Soc. Rev., 42, 5014-5030 (2013)
Peak Area Dotp Line Plot
Peak Area Dotp Line Plot
|
Dotp is short for Dot Product. Skyline can calculate following measures of spectral similarity:
While the actual dot product(covariance) was the initial similarity metric used by Skyline, most recent versions actually use normalized spectral contrast angle. Since dot products are calculated using the peak areas they are graphically represented in the Peak Area Replicate Comparison plot. They are also available in the Document Grid reports. Previous versions of Skyline presented dotp as labels in the peak area bar chart. Starting from the version 21.2.1.424 it can also be represented as an interactive line plot. Unlike the labels, the plot is visible in both bar chart and line chart modes. | |
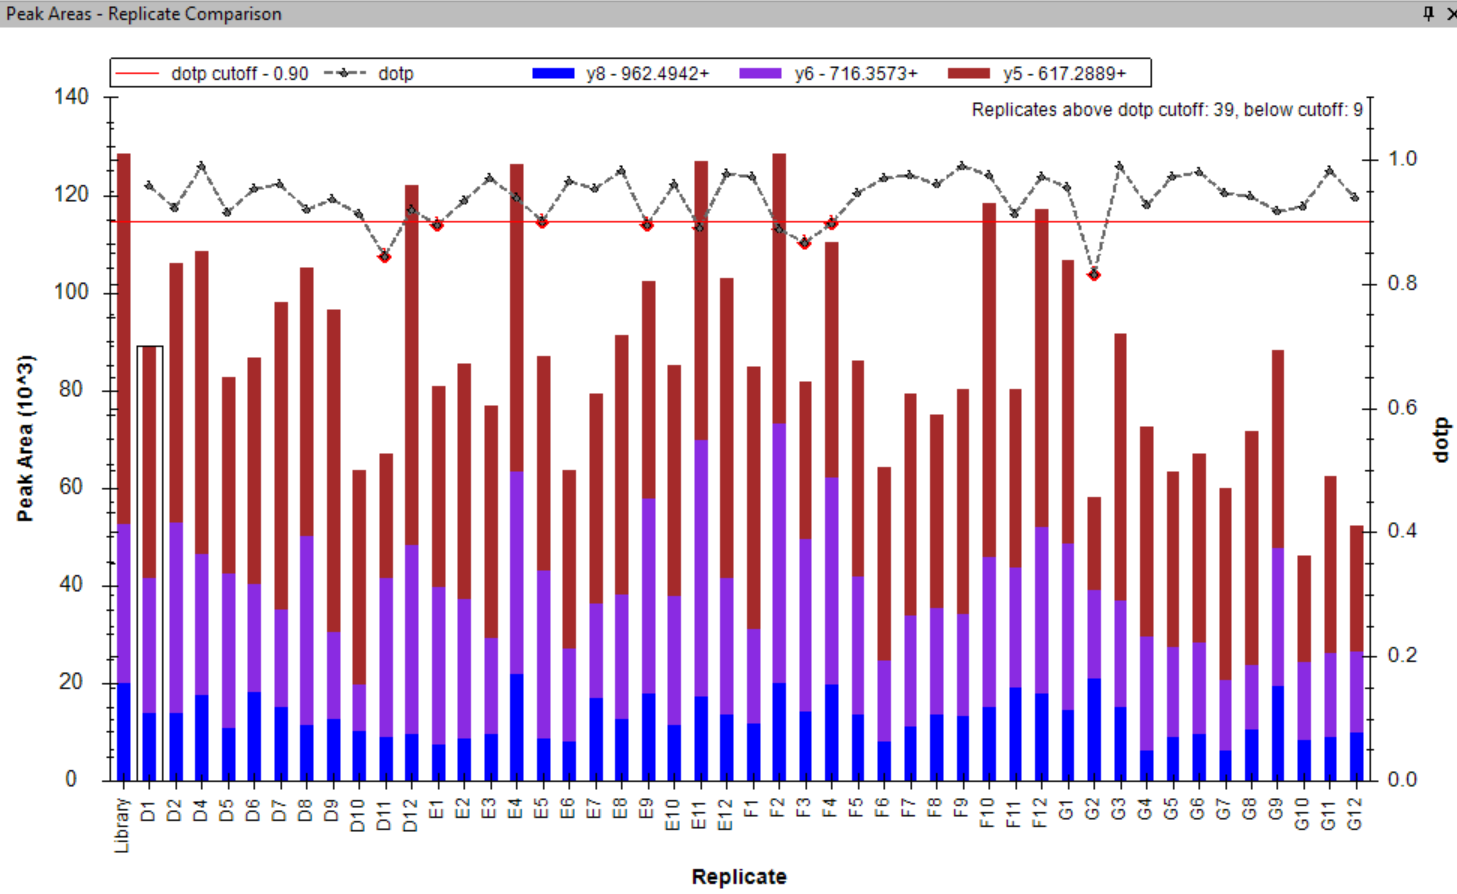 |
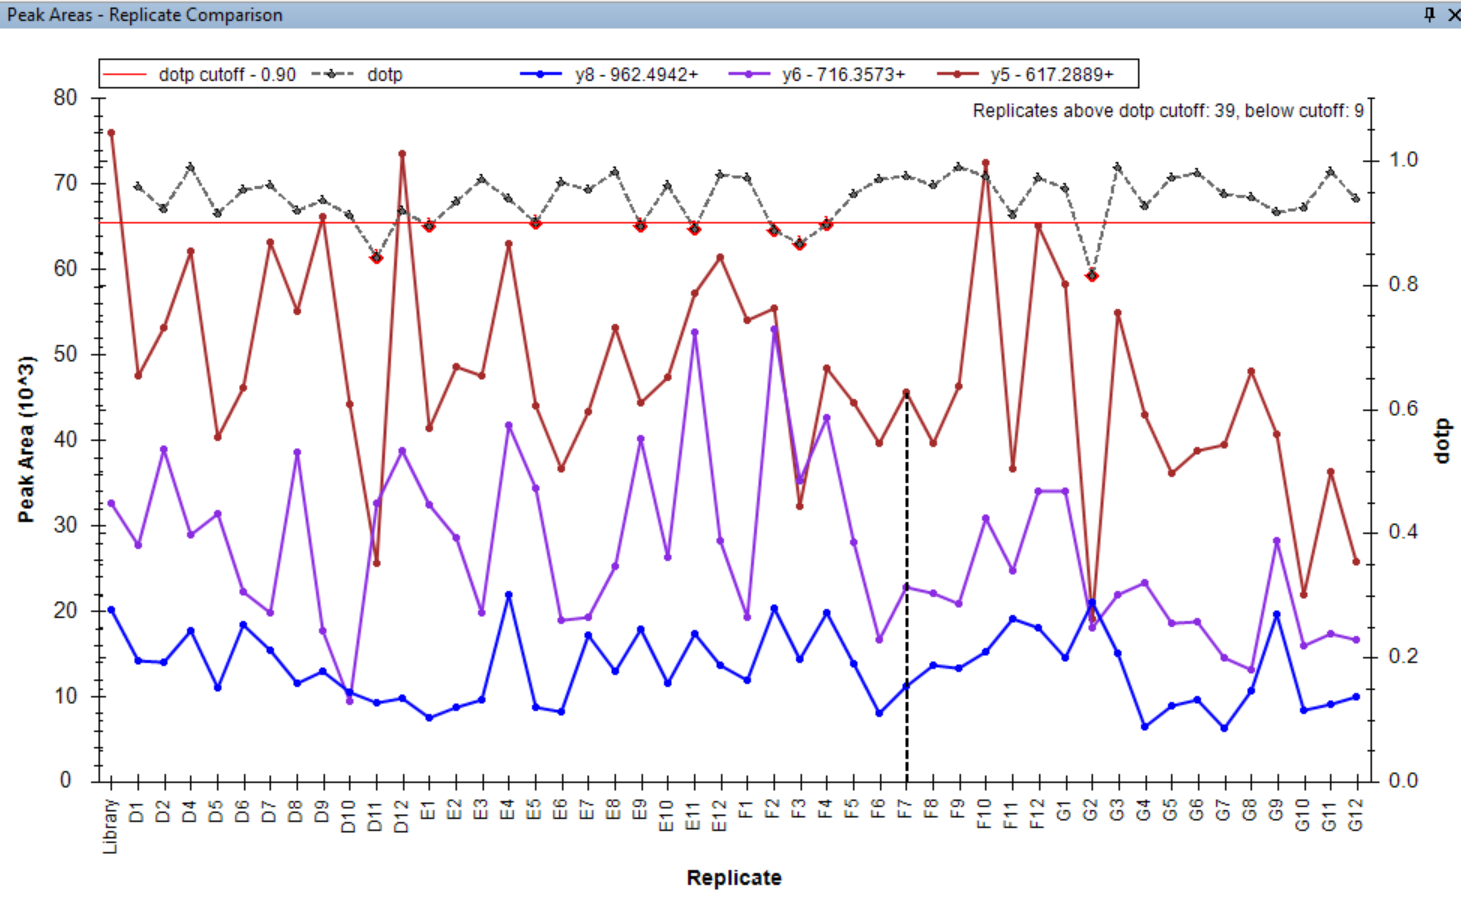 |
 |
The line uses the right Y axis for scale. Presentation mode is controlled through the context menu or the properties dialog, so it is possible to revert to the old presentation as labels or turn it off completely. |
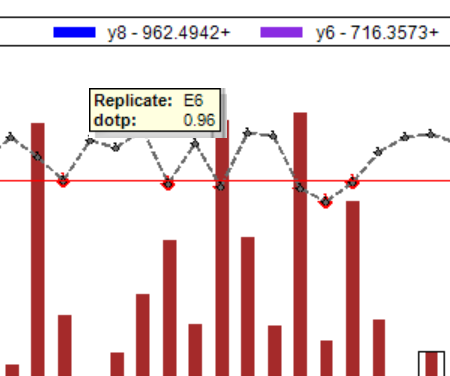 |
Mouse hover over a point in the plot shows a tooltip with replicate name and numeric value of dotp for that replicate. |
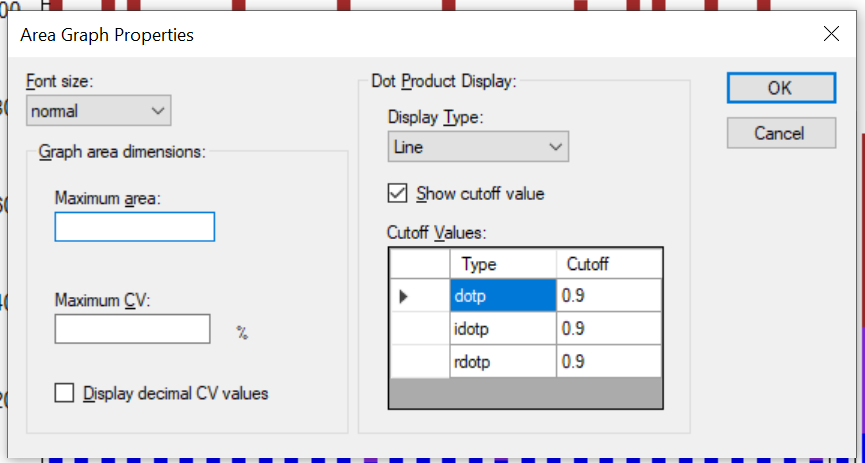 |
User can specify a dotp cutoff value individually for each type of dot product in the properties dialog. If the cutoff line is enabled, the cutoff value is shown in the plot and the points below the line are highlighted red. |
Synchronized Integration
Synchronized integration is an option in Skyline that allows integration in a single replicate to be applied to others. It can be accessed either by right-clicking on a chromatogram to bring up the context menu or through Edit > Integration > Synchronize Integration.
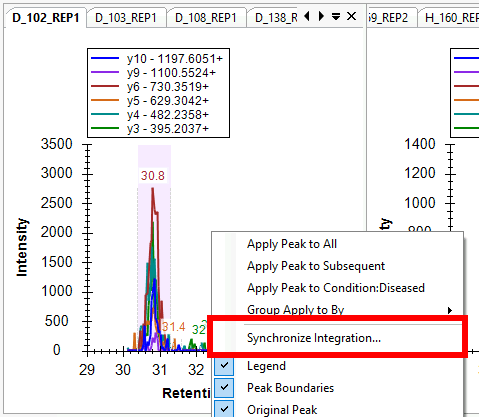
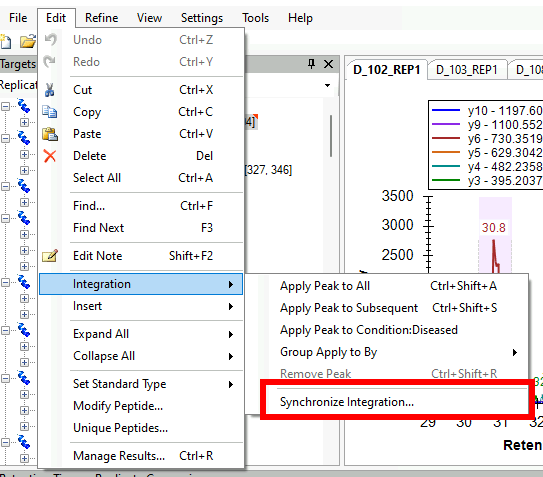
This will bring up the Synchronized Integration dialog, which allows you to select which replicates should be synchronized.
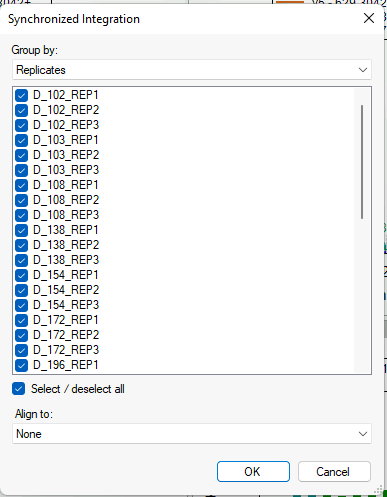
If annotations are available in the document, groups of replicates to be synchronized can also be chosen.
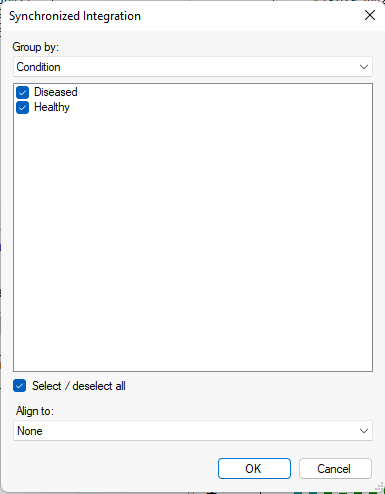
If predicted retention times are auto-calculated, you may align times to the predicted retention times. Similarly, if retention time alignments are available for a data file, you may align times to that file. (This is the same as selecting "Show <retention time predictor> Score" or "Align Times to <file>" from the chromatogram context menu)
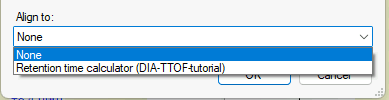
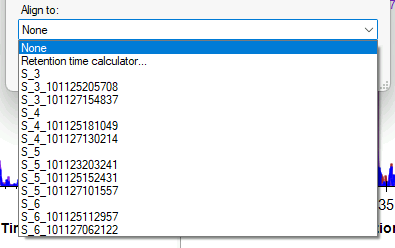
Once synchronized integration is enabled, any integration change (manual integration, clicking a peak, removing a peak) will be applied to the selected set.
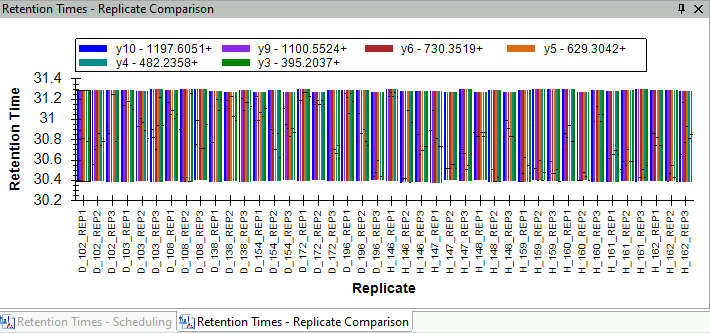
Note that the retention times may not be exactly the same across synchronized replicates if there are not peaks at the same times. The nearest peaks are used in this case.
Skyline and Java
Occasionally we get questions about Skyline and Java, especially when a new Java security flaw is announced. Here is what you need to know:
- Skyline is written in C#, so Java library vulnerabilities are not an issue.
- The Skyline informational website (https://skyline.ms/) and related Panorama website (https://panoramaweb.org/) do use Java, and are professionally maintained by the University of Washington Genome Sciences IT group who are extremely proactive in addressing security vulnerabilities.
Skyline Protein Association
Parsimonious Protein Inference
1. Protein association
After matching peptides in the Skyline document to proteins in a FASTA or background proteome, a bipartite graph is created with edges between peptides and their matching proteins.
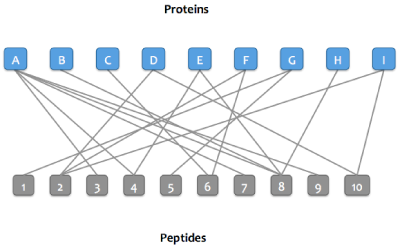
2. Protein grouping
Proteins that match the same set of peptides may optionally be merged into a single node in the graph. These proteins are referred to as an indistinguishable protein group (or just protein group). After this step, the word "protein" may refer to either a protein or a protein group.
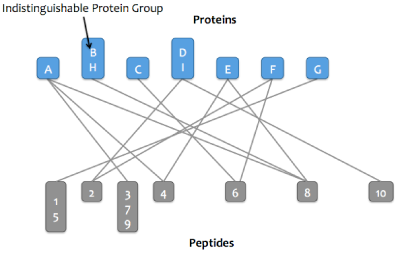
3. Sharing peptides between proteins
Many peptides are contained in more than one protein in a FASTA or background proteome. Skyline can optionally assign these peptides to just one protein, or even remove shared peptides entirely. Shared peptides can be:
- Duplicated between proteins
- Assigned to the first protein (that was read in from a FASTA or background proteome)
- Assigned to the protein with the most peptides (in case of ties, all tied proteins will be accepted)
- Removed (peptides must be unique to a protein or protein group)
Before Skyline 22.1, the only two options were "Remove duplicate peptides" and "Remove repeated peptides". Those are still available but have been renamed to "Removed" and "Assigned to first protein".
If neither "Remove subset proteins" nor "Find minimal protein list" are selected, then no more steps are run. Otherwise, step 4 is run next.
4. Protein clustering
To simplify computation and also make it easier for users to understand, the graph is separated into clusters (connected components): these are sets of proteins and peptides that are directly or indirectly connected.
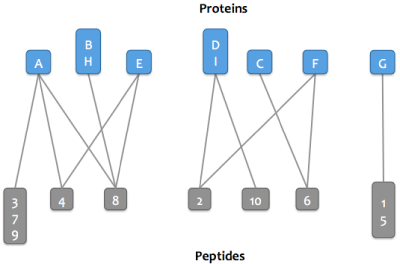
Then either step 4a or step 4b is run depending on which parsimony option is selected.
4a. Finding minimal protein list that explains all peptides
For each cluster, a greedy algorithm is applied that attempts to find the smallest set of proteins that explains all the cluster's peptides. The proteins in the resulting "minimal list" are marked as parsimonious.
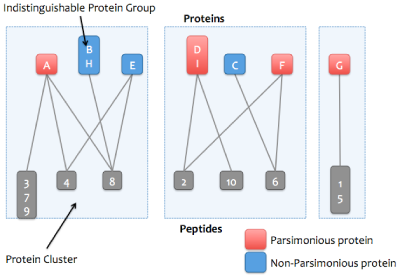
Greedy algorithm:
The algorithm works iteratively. For each iteration, the protein that explains the most peptides (that have not previously been explained) is taken out of the cluster and counted as explained. That protein's peptides are also removed from the other proteins that have not yet been considered. When there are no more remaining unexplained peptides, the algorithm is done and the proteins that have not been considered are marked as non-parsimonious. If two or more proteins explain the same number of peptides, then all tied proteins will be accepted into the minimal list. This prevents the parsimony algorithm from arbitrarily excluding proteins due to the order they were enumerated from the FASTA file. The greedy algorithm does not always find the true minimal list, but it's usually pretty close.
4b. Removing subset proteins
If the "Find minimal protein list that explains all peptides" option is not selected, then Skyline can instead remove only subset proteins. Non-parsimonious, non-subset proteins can be retained (proteins which are not strict subsets of any other protein, but all of their peptides are entirely explained by other parsimonious proteins). To illustrate, consider the following examples:
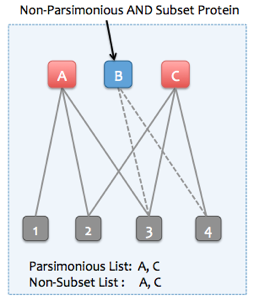
Example of a subset protein (all subset proteins are also non-parsimonious)
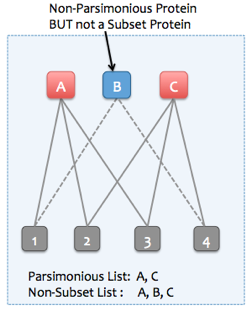
Example of a non-parsimonious but non-subset protein
Spectrum Filters
As of Skyline version 23.1 you can tell Skyline that the chromatograms for a particular precursor should be extracted from a subset of the available spectra.
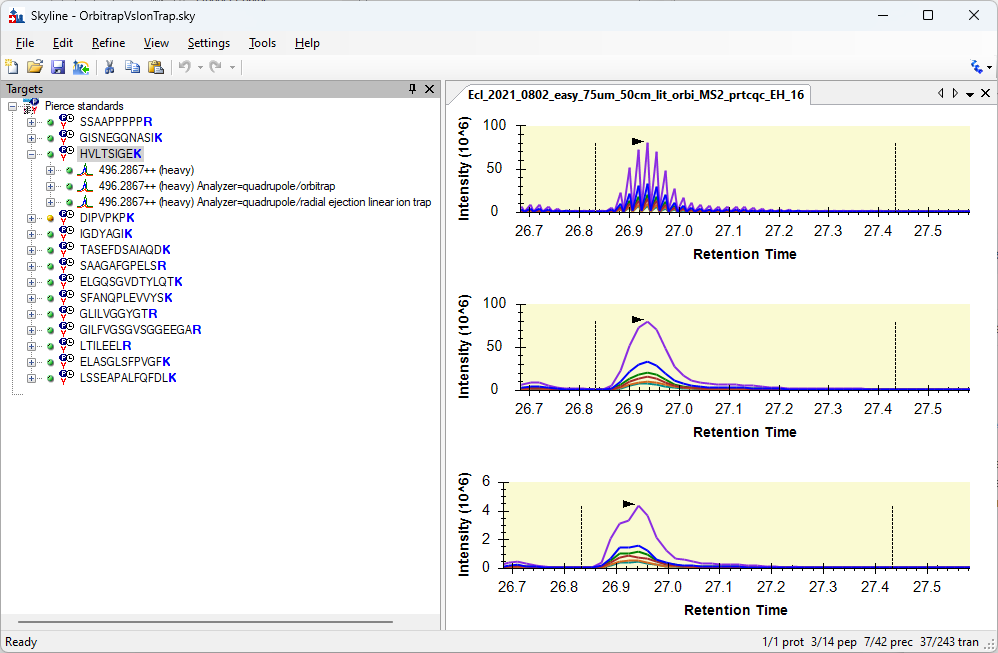
You can right-click on something in the Targets tree and choose "Edit Spectrum Filter..." to bring up the "Edit Spectrum Filter" dialog.
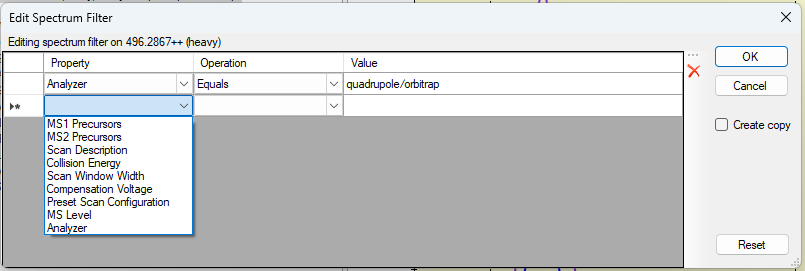
The Edit Spectrum Filter dialog can be brought up when multiple items are selected in the Targets tree.
If all of the selected items in the Targets tree already have exactly the same Spectrum Filter on them, then the Edit Spectrum Filter will enable editing those filters, and the "Create Copy" checkbox can be used to control whether the current filter will be changed (unchecked) or something new will be added with the new set of filter clauses.
If the selected items have different filters on them, then the Edit Spectrum Filter will be shown with no clauses in it, and the "Create copy" checkbox will be checked and disabled since the only option will be to add new things with the new set of filter clauses.
New in Skyline 25.1
Skyline version 25.1 will allow you to specify a filter that is applied to everything in the document. On the "Instrument" tab in the Transition Settings, click the "Edit" button next to "Advanced Filtering".
This feature can be used to tell Skyline to ignore all spectra matching a particular criteria, such as MS2 spectra with wider isolation windows that were only acquired for the purpose of retention time alignment and which should not be used for chromatogram extraction.

EncyclopeDIA Search from Skyline 23.1
Skyline 23.1 has an import wizard to let you easily run a library-free EncyclopeDIA search on your gas-phase fractionated (narrow window) and single injection (wide window) DIA results. You choose a FASTA and Skyline generates a Prosit library from it and uses that to seed the EncyclopeDIA search. After the search, Skyline automatically imports the chromatogram and quantification libraries that were created.
1. Start the wizard
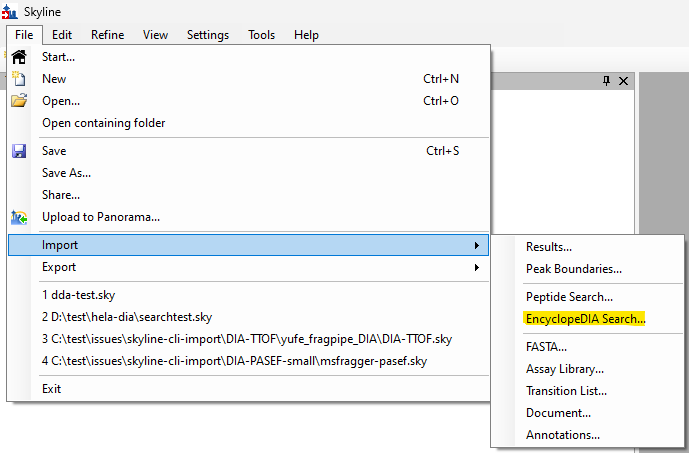
2. Choose FASTA
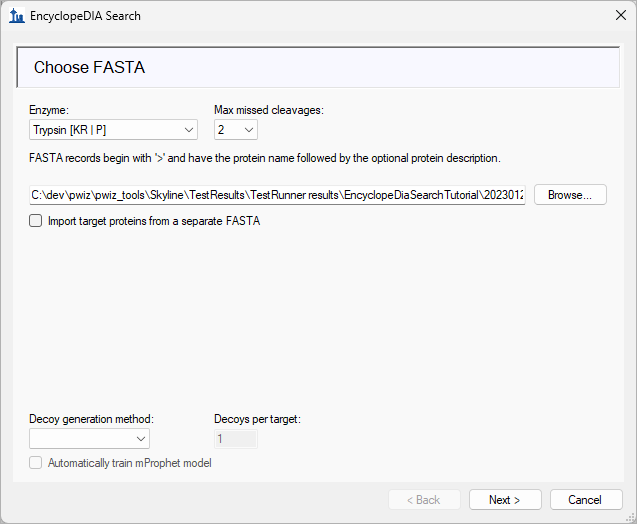
- Enzyme and missed cleavages determine which peptides will be predicted
- Prosit prediction on a whole proteome can take a while so for a quick test choose a targeted FASTA
3. Pick Prosit settings
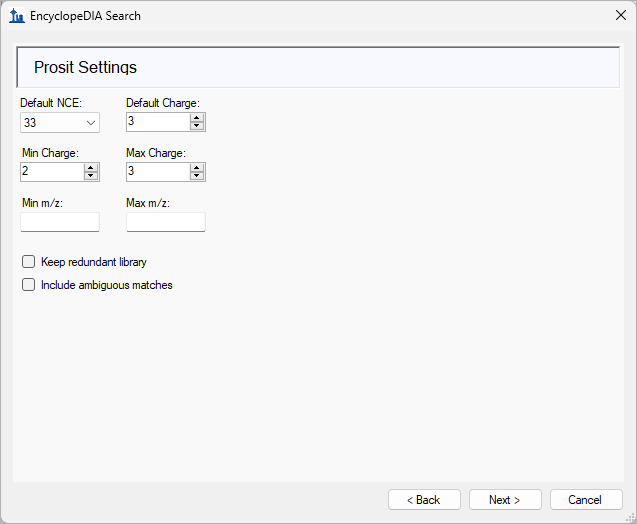
- m/z min/max can be set to filter peptide predictions on m/z
- Precursor charges between 1 and 6
- Default NCE is the NCE at the default charge
4. Pick GPF (narrow window) DIA results
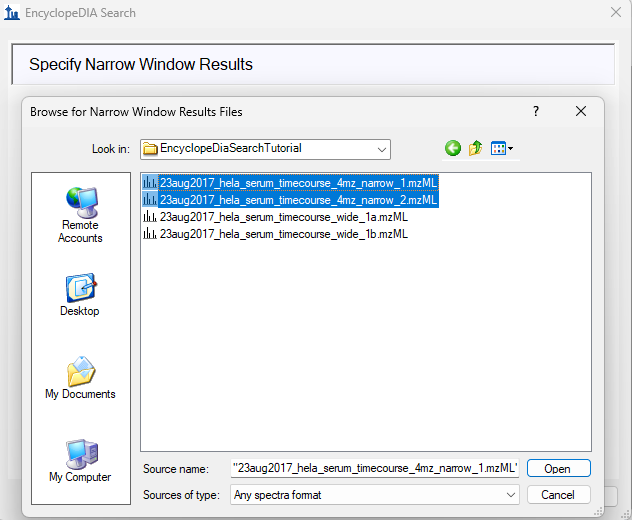
- EncyclopeDIA searches these to build chromatogram library
5. Pick single injection (wide window) DIA results
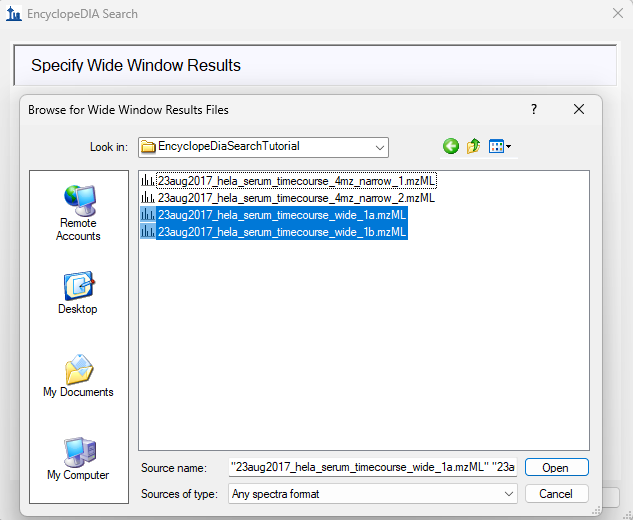
- EncyclopeDIA searches these to build quantification library
6. Pick EncyclopeDIA settings
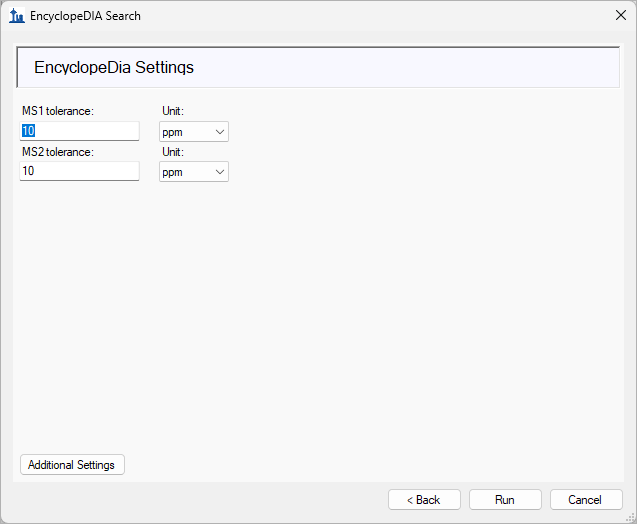
- Wizard page currently only exposes peak tolerances
- All EncyclopeDIA settings can be edited in “Additional Settings”
7. Watch progress
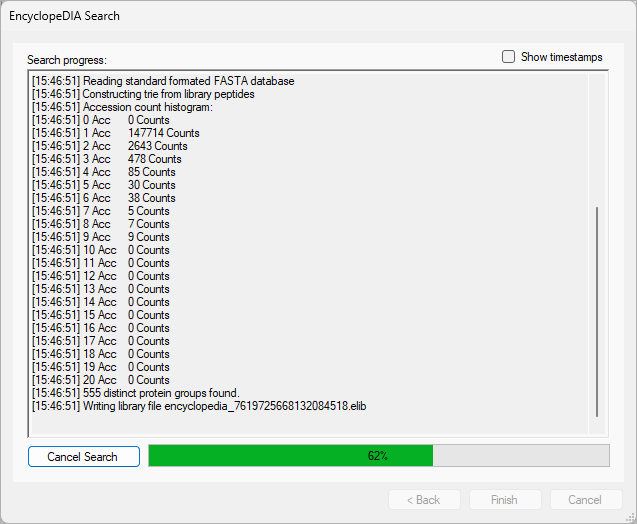
8. After search finishes, import proceeds with the import peptide search wizard where the EncyclopeDIA libraries have been preselected
Automated labels layout
Automated labels layout
Skyline’s Relative Abundance and Volcano Plot graphs have ability to label the graph points and automatically layout the labels to avoid overlaps with data points and other labels.
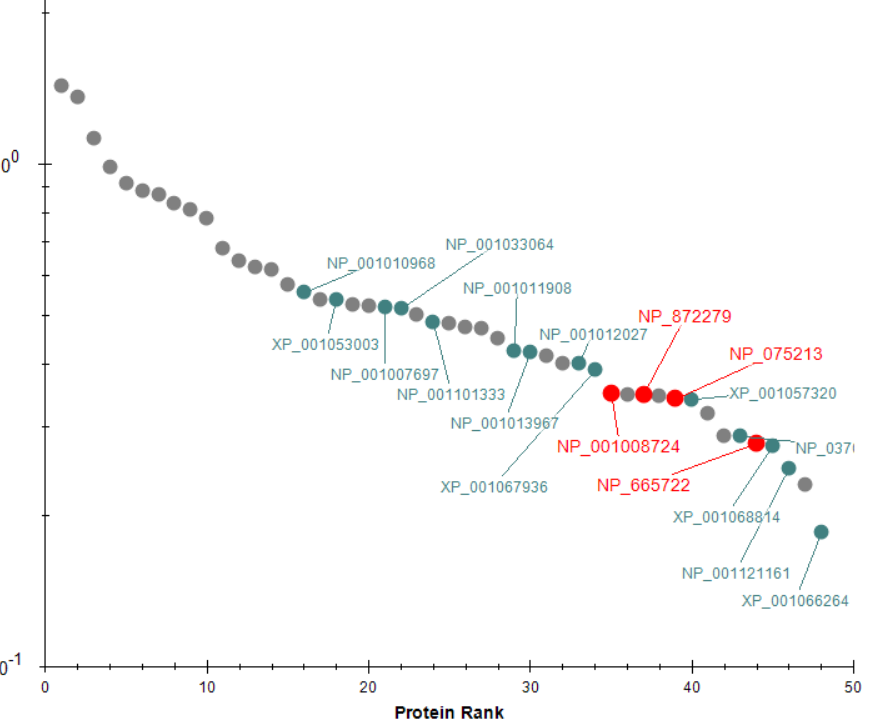
User can use Formatting dialog to format and label series of peptide/protein points according to user-specified criteria. See DIA/SWATH data analysis tutorial (p. 27) for information on using the Volcano Plot formatting options. Also, selected peptides/proteins are labeled by default (the red color on the picture above).
The user can control label layout settings using graph’s context menu.
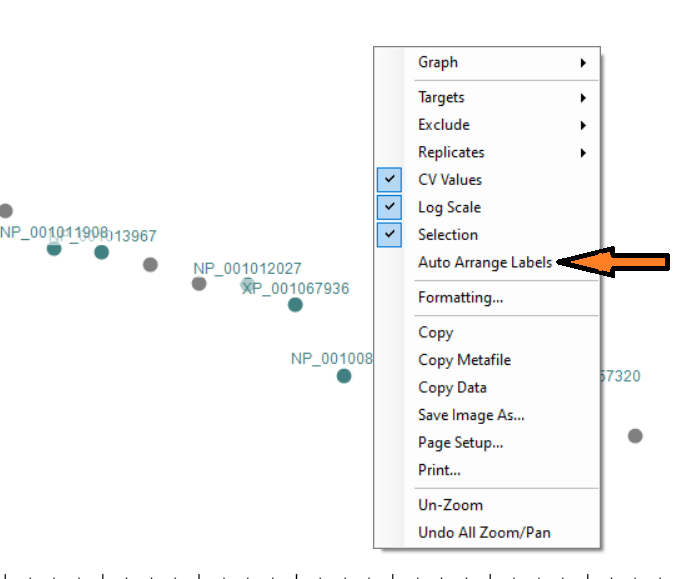 |
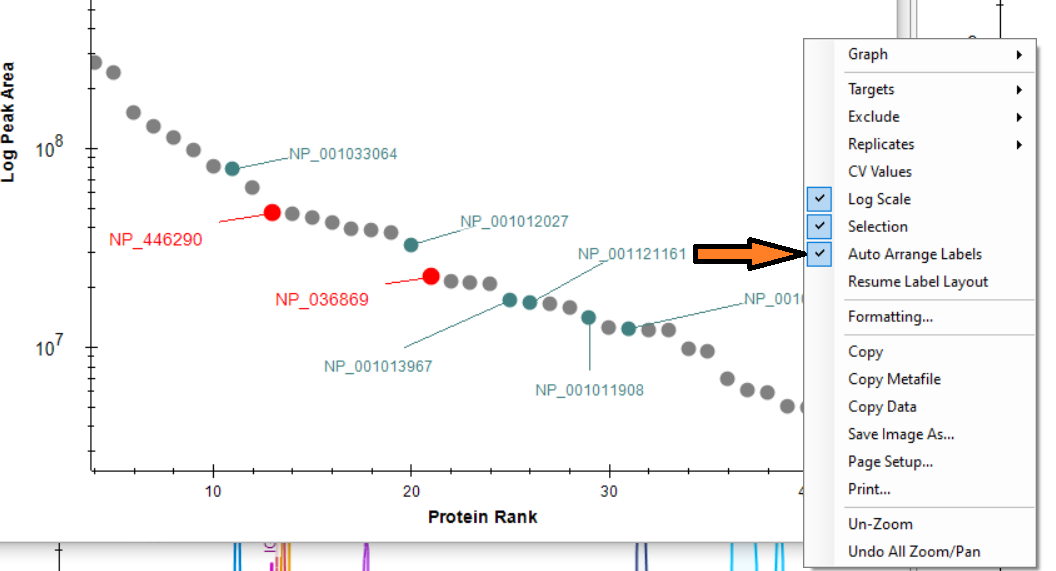 |
The Auto Arrange Labels menu item allows to turn automated label layout off (it is on by default). In this case the labels will be positioned immediately above the corresponding points disregarding possible overlaps, as shown on the image above.
When Auto Arrange Label is on, user can move the labels around to fine-tune the automatically generated layout. In Skyline version 24.1 label drag is enabled by moving the mouse over the label you want to move and pressing and holding Alt key. The mouse cursor will change to  indicating the drag mode. In the later versions when the mouse is moved over a label, a label border box shows. When the mouse pointer is positioned over the border box it changes to and the label can be dragged.
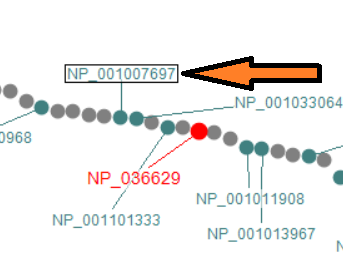
By default the label layout is recalculated every time the graph is zoomed or panned, or the Skyline document is modified. This might make the graph a bit jumpy and hard to manage, especially when there is a lot of points/labels. Also any manual label re-positioning is lost. To avoid that you can use Suspend Label Layout context menu item. When the layout is suspended, Skyline would not recalculate the layout every time you zoom/pan the graph, but document edits, like peptide/protein addition/removal will still trigger it. So you might want to postpone the final fine-tuning until your document is stable.
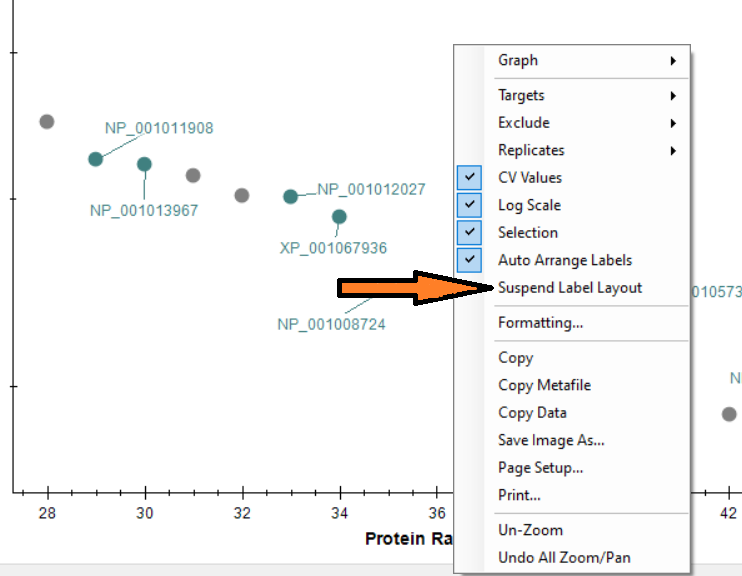
The layout is saved in the *.sky.view file when you explicitly save the document. If you modify the labels layout without modifying the document structure and exit Skyline the layout changes will not be saved. Use Save toolbar button or menu item.
Carafe Options Help
Carafe Options
The parameter options are divided into three sections. These are related to the three modules of Carafe as described in the Carafe manuscript: https://www.biorxiv.org/content/biorxiv/early/2024/10/18/2024.10.15.618504/F1.large.jpg
A: Training Data Generation Options
Search Engine
-se
search engine used to generate the identification result: dia-nn or skyline (default is dia-nn)
False Discovery Rate
-fdr
minimum FDR cutoff to consider (default is 0.01)
PTM Site Probability
-ptm_site_qvalue
minimum PTM-site localization probability used to filter PSMs included for PTM model training (default is 0.75)
PTM Site Qvalue
-ptm_site_qvalue
maximum PTM-site qvalue used to filter PSMs included for PTM model training (default is 0.01)
Fragment Ion Mass Tolerance
-itol
fragment ion tolerance used during fragment ion matching and XIC extraction (default is 20.0)
Fragment Ion Mass Tolerance Units
-itolu
ppm or da (default is ppm)
Refine Peak Detection
-rf
refine peak boundary flag when using DIA data for fine-tuning (disabled by default)
Retention Time Window
-rf_rt_win
retention time window, in minutes, used when refining peak detection is enabled for refining peak boundaries (default is 3 minutes)
Minimum XIC Correlation
-cor
minimum correlation cutoff to consider in determining shared fragments, default is 0.75 (default is 0.75).
Minimum Fragment Ion M/Z
-min_mz
minimum fragment ion m/z to consider (default is 200.0)
B: Model Training
Model Type
-model
model type: general or phosphorylation (default is general)
Normalized Collision Energy
-nce
normalized collision energy will be automatically extracted from the mzML, unless specified with this parameter
MS Instrument
-ms_instrument
mass-spectrometer instrument type used to generate the training data will be automatically extracted from the mzML unless specified with this parameter
Device
-device
computation device: cpu or gpu - used for model training and prediction, if gpu is specified but not available, it will fall-back to using the cpu
C: Library Generation
Enzyme
-enzyme
enzyme used for protein digestion, from one of the following (default is 1)
0:No enzyme, 1:Trypsin, 2:Trypsin (no P rule), 3:Arg-C, 4:Arg-C (no P rule), 5:Arg-N, 6:Glu-C, 7:Lys-C.
Enzyme Missed Cleavages
-miss_c
maximum number of missed cleavages allowed (default is 1)
Fixed Modifications
-fixMod
fixed modifications to consider when generating a library
Variable Modifications
-varMod
variable modification to consider when generating a library
Maximum Allowed Variable Modifications
-maxVar
maximum number of variable modifications (default is 1)
Clip N-Terminus Methionine
-clip_n_m
when digesting a protein starting with amino acid M, two copies of the leading peptides (with and without the N-terminal M) will be considered or not (default is not)
Minimum Peptide Length
-minLength
minimum length of peptide to consider (default is 7)
Maximum Peptide Length
-maxLength
maximum length of peptide to consider (default is 35)
Minimum Peptide M/Z
-min_pep_mz
minimum mz of peptide to consider (default is 400)
Maximum Peptide M/Z
-max_pep_mz
maximum mz of peptide to consider (default is 1000)
Minimum Peptide Charge
-min_pep_charge
minimum precursor charge to consider (default is 2)
Maximum Peptide Charge
-max_pep_charge
maximum precursor charge to consider (default is 4)
Minimum Fragment Ion M/Z
-lf_frag_mz_min
minimum mz of fragment to consider for library generation (default is 200)
Maximum Fragment Ion M/Z
-lf_frag_mz_max
minimum mz of fragment to consider for library generation (default is 1800)
Top N Fragments
-lf_top_n_frag
maximum number of fragment ions to consider for library generation (default is 20)
Spectral Library Format
-lf_type
Skyline, EncyclopeDIA, or DIA-NN (default is Skyline)
Peak Imputation in Skyline 25.2
Skyline 25.2 will have a new feature "Peak Imputation" which will improve several scenarios where Skyline has traditionally chosen incorrect peaks.
As of June 26, 2025, this feature is not yet part of Skyline-daily, but can be used in a special build:
https://proteome.gs.washington.edu/~nicksh/SpecialSkylines/PeakImputation/
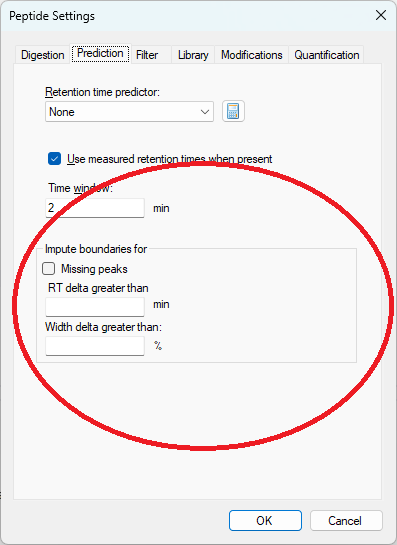
The new peak imputation settings can be found on the "Prediction" tab in Peptide Settings
The peak imputation settings tell Skyline that in certain circumstances, the peak boundaries should be chosen instead based on the peak boundaries in the best-scoring replicate for that peptide or molecule.
Skyline has two different ways of choosing peak boundaries:
Skyline's peak detection and scoring
When Skyline is doing its own peak detection and scoring, the peak imputation feature must be invoked as a separate step after all results have been imported.
After the peak imputation settings have been specified on the "Prediction" tab in Peptide Settings, the menu item "Refine > Reintegrate" must be used to tell Skyline to re-pick peaks using Skyline's peak scoring model combined with the peak imputation settings
When Skyline is performing this reintegration, if Skyline sees that the peak boundaries in a particular Replicate are more than the "RT delta greater than" setting away from the best-scoring replicate, or the peak width is more different than the "Width delta greater than" setting, then Skyline will move the peak boundaries of the lower-scoring replicate so that they exactly match the best-scoring replicate.
When using boundaries from libraries
Some types of libraries, including DIA-NN and EncyclopeDIA, specify start and end times of peak integration boundaries which Skyline uses instead of Skyline's own peak detection and scoring algorithms.
When Skyline is using the peak boundaries from the library, Skyline will apply the peak imputation settings when chromatograms are first extracted. It is not necessary to do the separate step of "Refine > Reintegrate" (also, "Refine > Reintegrate" does not do anything in a document which used peak boundaries from the library because there is only one candidate peak to choose from in any particular replicate).
Seeing the peak boundaries from the best-scoring replicate on the chromatogram graph
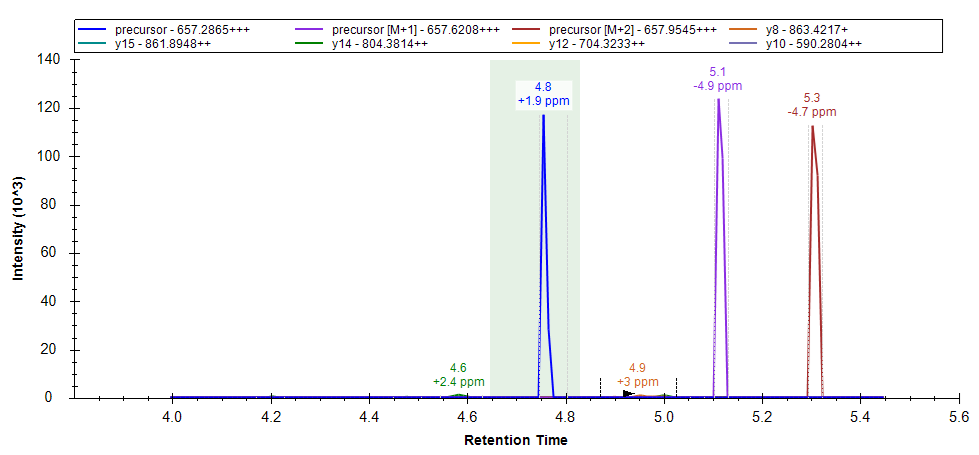
The chromatogram graph displays as a green-shaded rectangle, the peak boundaries from the best-scoring replicate
Retention time normalization
Instead of using the exact peak boundaries from the best-scoring replicate, Skyline performs a retention time alignment to map the times from the best-scoring replicate to the target replicate. If there is an iRT calculator in the document, then the iRT calculator is used to do the alignment. If there is no iRT calculator, but there is exactly one spectral library in the document, then runs are aligned using a lowess regression against the median retention time values from that spectral library.
Skyline Batch
| Skyline Batch is an application that automates a common Skyline workflow for batch processing Skyline documents. It interacts with Skyline through the command-line, allowing it to import data into a template document, export reports, and run R scripts on those reports without bringing up the Skyline user interface. |
Install Skyline Batch for Skyline 20.2 or later, or Skyline-daily (20.2.1 or later)
Skyline Batch Webinar
A hands-on demonstration displaying the depth of Skyline Batch as well as new features:
Webinar 20: Using Skyline Batch for Large-Scale DIA
Skyline Batch Tutorials
Learn how to use Skyline Batch by completing the supplementary tutorials on the Webinar 14 and 15 pages:
Webinar 14: Large Scale DIA with Skyline
Webinar 15: Optimizing Large Scale DIA with Skyline
Skyline Batch Release Notes
Skyline Batch 21.1.0.306 (Nov. 2nd, 2021)
- Remote file sources make downloading files from similar locations easier
- Added undo/redo functionality for changes to the configuration list
- Bug fixes for adding R scripts and downloading files from Panorama
Skyline Batch 21.1.0.187 (July 6th, 2021)
- Skyline template files, annotation files, data files, and R scripts can now be downloaded from Panorama
- New download data files dialog that includes an interactive list of the files to be downloaded
- Improved Skyline Batch configuration files that are more easily readable in a text editor
- Updated run button options
Skyline Batch 21.1.0.146 (May 26th, 2021)
- Added a "download files only" run option
- Allow waiting configurations to be unchecked and removed from the current batch run
- Log improvements
- Data download bug fixes
Skyline Batch 20.2.0.475 (Apr. 20th, 2021)
- Can download data files from an FTP server
- Added support for different number formats
Skyline Batch 20.2.0.464 (Apr. 9th, 2021)
- Import configurations by double-clicking a Skyline Batch Configuration file
- No longer requires a Skyline report file for reports that already exist in the template document
- Improved file detection for sharing configurations across computers
Skyline Batch 20.2.0.453 (Mar. 29th, 2021)
- New option for Skyline file refinement
- Supports using refined files as templates for other configurations
- Added ability to import annotations
- Bug fixes for finding R installations, logging, and more
Skyline Batch 20.2.0.398 (Feb. 2nd, 2021)
- Runs multiple Skyline workflows sequentially
- Displays log of current run
- Allows different configurations to use different Skyline installations
- Supports running R scripts with any version of R
Skyline File Types and Extensions
Here is a complete list of Skyline file types:
- .sky - the main Skyline document file
- .sky.view - contains state information about the Skyline UI when the .sky file was last saved, e.g. selection and window layout - can be deleted
- .skyd - contains all the chromatograms and the complete set of peak statistics (generally 10 per chromatogram) considered by Skyline
- .skyl - the Skyline audit log file
- .blib - a Skyline native spectral library
- .slc - a "spectral library cache" created to improve initial spectral library load performance - can be deleted and Skyline will simply recreate it
- .irtdb - a Skyline iRT library file
- .optdb - a Skyline optimization library for CE and CoV optimization values
- .protdb - a background proteome file
- .imsdb - and ion mobility library (coming in 20.2) which stores ion mobility and CCS values
- .midas - a spectral library file for spectra from SCIEX MIDAS runs
External library types:
- .hlf - X! Hunter spectral library from theGPM
- .sptxt - SpectraST spectral library from the TPP
- .msp - NIST spectral library
But don't try to understand all of the above just to share a complete Skyline document/project with others, instead use File > Share or Upload to Panorama to create a:
- .sky.zip - a compressed ZIP archive which contains the full set of files required to share your document/project
Exported files not associated with the .sky file:
- .skys - a Skyline settings file which can be imported into a menu item on the Skyline Settings menu
- .skyr - a Skyline report template file which can be imported back into Skyline to add report templates to the available set
- .skyp - a new Skyline "pointer" file that can be downloaded from Panorama very quickly and will then initiate a full download inside Skyline when opened
Waters SONAR Calibration
Waters SONAR support has recently been improved in Skyline. SONAR users should consult this information provided by Waters: https://support.waters.com/KB_Inf/MassLynx/WKB202040_How_to_create_post-acquisition_a_SONAR_calibration_file
Audit Logging
(This tip applies to Skyline-Daily 4.1.1.18257 and later.)
When enabled, the audit log will keep track of all changes that are made to the current document. The audit log is stored as a separate file (.skyl), alongside with the skyline document.
The audit log can be accessed from the View menu. The audit log is displayed in a grid, similar to the document grid. In the top right corner audit logging can be enabled or disabled.
For new documents, audit logging is enabled by default.
Reasons to enable Audit Logging
Full details can be found here (PDF).
Crosslinking
Support for crosslinked peptides was first added to Skyline version 20.2.
Skyline 21.1 improved this feature by making it much easier to link more than two peptides together.
Skyline 23.1 will have support for cleavable crosslinks
New in Skyline 4.1
Attached are a collection of slides created by the developers as they added new features in Skyline 4.1 which required a bit of explanation:
- Small molecule spectral libraries, improved adducts, and identifier (InChiKey, InChi, CAS, and HMDB)
- Document Grid and Live Report pivot and layout support
- Group comparison volcano plot with formatting
- Peak Area CV histogram plots
- Quantitative property for transitions
- Points across the peak visualization in chromatogram plots
How to Display Multiple Peptides
Skyline allows you to compare chromatograms of different peptides by selecting them in the Targets panel shown by default on the left side of the Skyline window.
For example, to see all the peptides belonging to a particular protein, click on the protein name in the Targets panel:
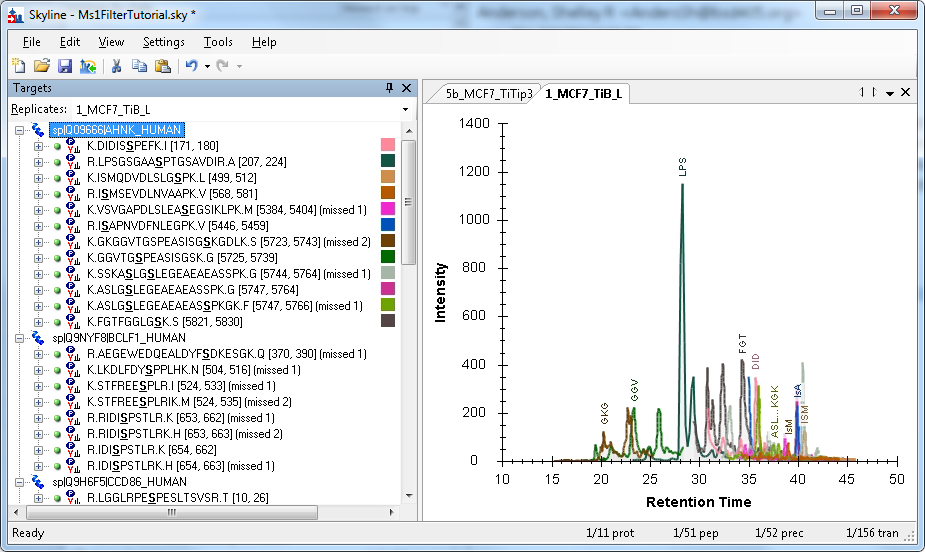
Skyline generates a color for each peptide based on the peptide sequence and modifications. This provides a quick way to identify the matching chromatogram in the graph. A peptide will always have the same color, even in different Skyline documents, unless there is another peptide within the same protein that generates the same color. That doesn’t happen too often, but when it does, Skyline picks one of the conflicting peptides and assigns it a new color that is easier to differentiate.
Color swatches are shown in the Targets panel next to only those peptides which are shown in the graph. In the example above, only the peptides under the selected protein are shown in the graph.
The peptides are also labeled in the graph with a unique abbreviation. If the first three letters of the peptide’s name are unique (among the peptides being graphed), then only three letters will be used in the abbreviation. If the first three and last three letters together are unique, the abbreviation will use those (see ASL…KGK in the example above). More complicated abbreviation schemes are used if the first and last three letters are not unique. Note that a peptide’s abbreviation can change depending on what other peptides are being displayed at the same time.
Graphing peptide subsets
The Targets panel allows you to select any subset of peptides you want. You can select just a few peptides (from one protein, or across different proteins) by clicking on the first, and then holding the CTRL key down while clicking on additional peptides. You can toggle a peptide by clicking on it multiple times with the CTRL key depressed.
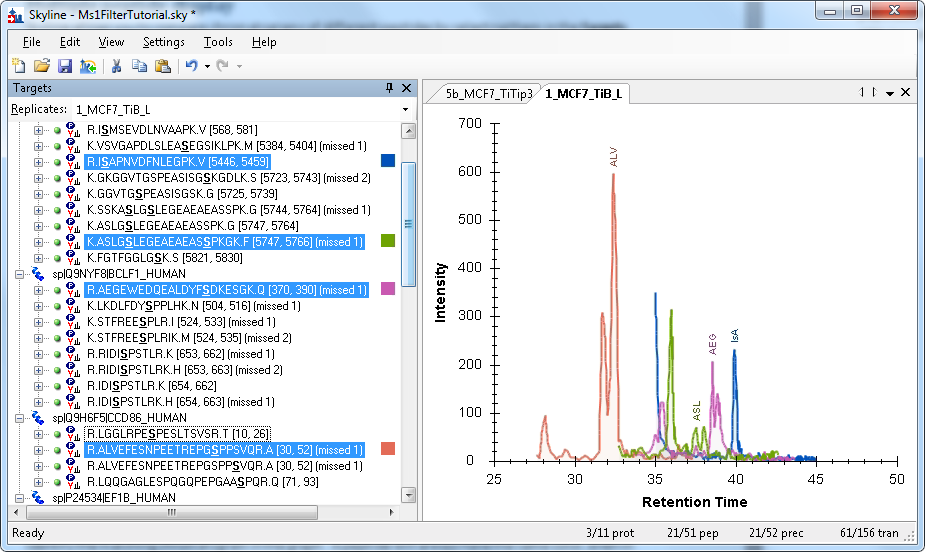
You can select individual peptides by clicking on their names, or you can select all the peptides belonging to a protein by clicking on the protein name.
All peptides
To see every peptide in the document graphed, click somewhere in the Targets panel to transfer focus there, then type CTRL-A (or choose Select All from the Edit menu):
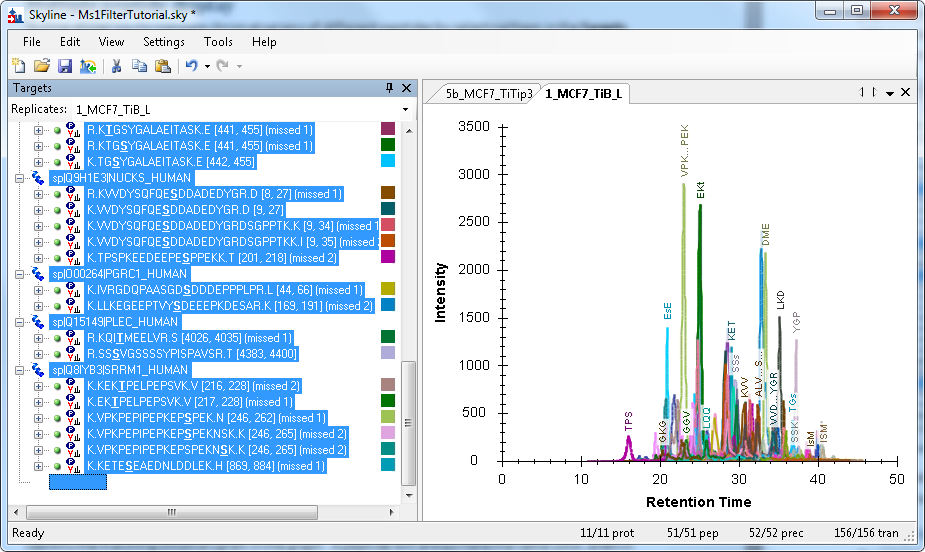
Note that this can take some time to display if your document contains a large number of peptides.
Displaying all the peptides will produce a graph that looks similar to the progress displayed during data import:
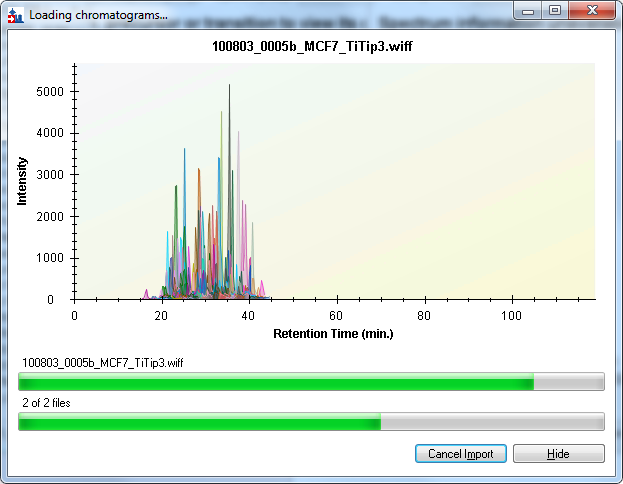
But you can see differences between this graph and the one above. Peptide colors will usually match, but occasionally they don’t if a different color is needed to disambiguate two peptides in the same protein. Peak values can also differ, because different summation criteria are used during import than later when more processing has been done on the raw data.
Ion Mobility Separation (IMS) Data
Skyline supports IMS data for Waters, Agilent, Thermo (FAIMS) and Bruker instruments. By specifying the ion mobility for each precursor ion of interest you can tell Skyline to ignore scans that might contribute noise, and thus improve the quality of extracted chromatograms. The Ion Mobility Spectrum Filtering tutorial provides examples and more detail.
Ion mobility values may be specified in Ion Mobility libraries, or defined explicitly in transition list imports, and may also be found in spectral libraries (for the latter, make sure to check the "Use spectral library ion mobility values when present" box in the Ion Mobility tab of the Transition Settings dialog). The order of precedence is: explicit values, Ion Mobility Library values, Spectral Library values.
You will notice that an ion mobility is commonly expressed as a Collision Cross Section (CCS) value and an ion mobility value. (Except for FAIMS, where ion mobility is expressed as Compensation Voltage, and CCS is not a factor.) It's important to understand that the CCS value takes priority: different raw data files may contain different CCS->mobility calibrations, so the actual ion mobility filter value for a chromatogram extraction is always derived from the CCS value when available. Thus, if you want to experiment with adjusting ion mobility values for chromatogram extraction, it's necessary to either adjust CCS rather than ion mobility, or to clear the CCS setting so that your adjusted ion mobility value is the one that gets used.
To add or modify an ion mobility library, use the Settings|Transition Settings menu item and select the Ion Mobility tab, then use the "Ion Mobility Library" drop down menu to bring up the Ion Mobility Library editor.
The easiest way to set up an ion mobility library is to start with a Skyline document with imported results, then use the "Use Results" button in the Ion Mobility Library editor. This simply scans the existing un-IM-filtered chromatograms and determines the ion mobility value that yields the best peak in the RT dimension, where "best" takes resulting peak area and isotope envelope fit into consideration. Once you have that, you can reimport the data and Skyline can ignore scans at the proper retention time but wrong ion mobility.
There is a risk, of course, that the most intense peak at a given retention time isn't actually that of the precursor you are interested in, in which case you will be making the noise situation worse instead of better. The ideal way to use this training feature is with simple training sets that elute one precursor at a time. If you do not have that capability then you should go through and verify the ion mobility selections manually using the Full Scan chromatogram viewer's intensity heat map of mz vs ion mobility.
You can also set explicit ion mobility values for small molecule precursors using the right-click menu in the Targets window. This can also be done in the Document Grid, so it's possible for peptide precursors as well. Again, it's necessary to re-import the raw data to obtain the revised chromatograms.
Skyline Source Code
The Skyline project is developed in open source, under Apache 2.0 License, though released under a modified Apache 2.0 License, due to the inclusion of third party libraries with licensing restrictions.
The source code for Skyline is made available through the ProteoWizard GitHub Repository. The main Skyline project can be found under:
If you are interested in working with the Skyline source code, follow the "How to build Skyline" instructions.
How to build Skyline
How to Build Skyline
Follow these steps to configure your PC to build Skyline:
GitHub
The Skyline source code is part of the ProteoWizard project, and is hosted at GitHub.
- You will need a GitHub account
- You will need to configure it to use two factor authentication.
Don't go down any rabbit holes about SSH keys yet. See the next step for that. - You will also need to set up an SSH key and add it to your GitHub account.
You can ignore the stuff about GitLab, it's GitHub we're interested in.
In the step where you create the .ssh directory, you may have to use the windows command line "mkdir" rather than Windows Explorer (some systems don't like a folder name that starts with ".").
TortoiseGit
You can use this or any Git client you like, as long as it provides C:\Program Files\Git\cmd\git.exe - the Skyline team uses TortoiseGit and Git For Windows.
-
Download from https://tortoisegit.org/download
-
Just accept the defaults during the installation.
-
If you don't already have a git.exe, let TortoiseGit help you download and install Git For Windows.
-
If you're installing Git For Windows, just accept the defaults. If it asks you for your GitHub login, provide that if you have one, or tell it you'll do that later.
-
It's recommended to edit your settings so that some commonly used operations are promoted to the main right click menu:
Create Branch, Log, Diff, Check for modifications, Add, and Switch/checkout -
It's also recommended that you run this git command to set your CRLF defaults: "git config --global core.autocrlf true". This gives you Windows-style line endings in your editor, but saves the standard Unix line endings on GitHub.
-
If you're planning on making commits to the codebase, a ProteoWizard owner can grant access to the organization here
Visual Studio 2022 Community Edition
- Download Visual Studio 2022 Community Edition from https://visualstudio.microsoft.com/vs/.
- When you install, select ".Net Desktop Development" and "Desktop Development with C++" so you get C#, C++, and dotNet developer tools.
- This error means C++ is not installed:
- 'cl' is not recognized as an internal or external command, operable program or batch file.
- This error means C++ is not installed:
- You may be asked to reboot, or Visual Studio 2022 may be launched. If you do reboot, you will need to launch Visual Studio 2022 yourself to continue.
- On first launch VS2022 will ask you to sign in - It is not necessary to sign in. You can just choose "maybe later" or similar when asked to sign in.
- Check the "Apply customizations from previous version" box if you're upgrading. Choose the "Visual C#" option.
- You'll need the current .Net developer pack at https://www.microsoft.com/net/download/thank-you/net472-developer-pack, or VS2022 may prompt you for it when you first try to build Skyline.
ReSharper Ultimate
We highly recommended this set of Visual Studio extensions and develop Skyline to be warning-free under its static analysis. Students with a .edu email address can get a free license.
- Download and install Resharper from this link https://www.jetbrains.com/resharper/download/
- Install ReSharper, dotTrace, dotMemory, dotCover and anything else available that interests you.
- Most Skyline developers choose the IntelliJ keyboard setup.
- In VS 2022:
- Extensions > Customize Menu - Uncheck ReSharper and click Save and Restart
Anti-virus Exemptions
You will need to exclude the ProteoWizard source code tree from antivirus inspection. If you don't, Skyline's "AaantivirusTestExclusion" test will fail, and other tests will run inefficiently. How this is done depends on your choice of antivirus software.
Checking out the ProteoWizard source code with TortoiseGit
- Create a ‘Proteowizard’ folder somewhere (e.g. under I:\proj)
- Right-click in the folder and select Git Clone (if that's not there, you skipped TortoiseGit install)
- For "URL:" enter git@github.com:ProteoWizard/pwiz.git
- Check the "Load Putty Key" box, and enter the path to the .ppk file that you created earlier (it's in your .ssh directory).
- Click OK.
- The first time you do this, you'll get a message from the Pageant program (part of Putty) asking for the keyphrase you gave when you created your .ppk file. You'll also get a security alert about an uncached key, respond "Yes".
- Once the project is checked out, if you do not see TortoiseGit overlay icons in the Windows File Explorer, consult this helpful tip.
To Build Skyline and ProteoWizard
This step builds the ProteoWizard core library used by Skyline to read mass spec data, as well as Skyline itself, and runs tests on both. Once you've done this, as a Skyline developer you'll mostly work in the Visual Studio IDE. If you need to work on the ProteoWizard core, it's back to the bjam-based build system (though you can follow the debugger from Skyline into the pwiz core, if pwiz is built with the "debug" option).
In these instructions, <root> refers to that umbrella directory you set up earlier as an antivirus exclusion.
- In a command prompt window, change directory to the root of the project that you cloned from github
-
Create a batch file named "b64.bat" in this directory by creating a new file text file with a single line like this:
pwiz_tools\build-apps.bat 64 --i-agree-to-the-vendor-licenses toolset=msvc-14.3 %*
- Type b64.bat in the command-line.
- Skyline will build, along with ProteoWizard tools like msconvert and SeeMS. You'll see lots of Skyline windows flashing by as the tests are run.
- Regrettably, there are a handful of "errors" flagged in this initial build step which are alarming but don't actually matter for our purposes. But if your build doesn't seem to be working out, have a look in the file build64.log for clues.
For the quickest possible build (quick because it skips tests), create a batch file bs64.bat containing the line "call b64.bat pwiz_tools\Skyline//Skyline.exe" and use that instead.
Test and Begin Skyline Development
Note that the first time you open Skyline.sln, you are likely to be asked to download and install an updated dotNet package - do that.
-
In Windows Explorer navigate to <root>\proj\Proteowizard\pwiz\pwiz_tools\Skyline
-
Double-click Skyline.sln
- Be sure that your build configuration (Release x64) is set correctly. (Since VS 2022, Debug x64 is a better choice for debugging work.)
- Make sure your test settings match your build configuration:
Test > Configure Run Settings > Select Solution Wide runsettings File
and browser for either TestSettings_x64.runsettings in the Skyline folder - On the Tools menu, click Options, select Debugging, select General, and uncheck the 'Enable Just My Code (Managed only)' option.
- On the ReSharper menu, if you have one, click Options, under Tools, select Unit Testing
- Select Test Runner, and in 'Shadow-copy assemblies being tested' choose 'None'.
- Select Test Frameworks > MSTest, choose 'Use specific test settings file', and enter the path to TestSettings_x64.runsettings as above.
- In the Test menu, choose Run and click All Tests in Solution
- Once all of the tests have passed, you are ready to explore the code and implement new features.
Common Errors
Build Failure "NU1101 Unable to find package NetMQ. No packages exist with this id in source(s): Microsoft Visual Studio Offline Packages"
This build failure means Visual Studio does not have NuGet remote repository as a source and therefore not able to download the NetMQ when it is missing locally. To fix this:
-
Click on Tools menu
- Select NuGet Package Manager
- Select Package Manager Settings, this opens the Options menu for NuGet Package Manger and auto select the General settings
- Select Package Sources settings (below General)
- Click on the "+" sign to the top right conner.
- In the Name text box, enter nuget.org
- In the Source text box, enter https://api.nuget.org/v3/index.json
- Click on OK
- Then go to Build menu and select Build Solution
- Now the build should succeed or at least not show the "Unable to find package NetMQ" error.
Documentation
Most of the existing Skyline user documentation can be found in the Videos, Tutorials, Webinars, and Tips sections. Here, however, are a few documents which do not fit into those categories, but still provide useful information on advanced topics in using Skyline for targeted proteomics data analysis:
Skyline Command-Line Interface - Learn about SkylineRunner.exe and how you can use it to run certain Skyline operations from a command-line.
NOTE: for the most current command-line documentation, run SkylineRunner.exe or SkylineCmd.exe without any command-line arguments. The same information can be found in the Skyline user interface at Help > Documentation > Command Line.- Skyline External Tools Documentation - Learn how to integrate with Skyline statistical and bioinformatics tools you are developing.
- Skyline Interactive Tools Documentation - Learn how to integrate with Skyline interactive tools written with .NET which can request data from Skyline and respond to document changes on the fly.
Users Meetings
Since 2012, the Skyline team has been holding an annual User Group Meeting the Sunday before the annual ASMS conference. Made possible by the generosity of our vendor sponsors, the User Group Meeting has showcased the creative and innovative ways that Skyline has been used in mass spectrometry research over the many years that it has been freely available.
2024 | 2023 | 2022 | 2021 | 2020 | 2019 | 2018 | 2017 | 2016 | 2015 | 2014 | 2013 | 2012
June 2, 2024
Michael J. MacCoss, Ph.D. (University of Washington):
Introduction and event host
Brendan MacLean (MacCoss Lab, University of Washington):
Status of the Skyline open-source software project 16 years after its inception
Emma Doud (Indiana University School of Medicine):
Fit for purpose high-throughput absolute quantitation of chimeric aducanumab in mouse cortex and plasma
Amie M. Solosky (Baker Lab, University of North Carolina at Chapel Hill):
Developing and Applying a Multidimensional Lipid Database Containing Liquid Chromatography, Ion Mobility Spectrometry, and Mass Spectrometry Separation Characteristics in Skyline
Mike Riffle (Dept. of BioChem, University of Washington):
From RAW to Skyline: an automated DIA data analysis workflow written in Nextflow that emphasizes ease of use, data reproducibility, and open science
Will Thompson Ph.D, (908 Devices):
Enhancing Skyline for MicroChip CE-HRMS Metabolomics with a Novel Software Pipeline Including Automated System Suitability Testing, Data QC, and Metabolite Peak Quantification
Fengchao Yu Ph.D, (Alexey Nesvizhskii group, University of Michigan):
Integration of Skyline into FragPipe for Streamlined Visualization
Lightning Talks
Michel Batista Ph.D., (Fiocruz-Brazil):
A method based on LC-MS/MS that targets specific peptides of sepsis-causing microorganisms.
Tanveer Batth Ph.D., (Novo Nordisk Foundation Center for Protein Research):
Identification of a fungal N-terminal histidine methyltransferase using targeted proteomics [video]
The fungal kingdom is a source of diverse set of novel enzymes capable of performing various biochemical reactions. Consequently, fungal enzymes have been crucial biocatalysts for industrial and research purposes. However, fungal post-translational modifications have not been extensively explored. (More info...)
Dragana Noe Ph.D., (Precision Biomarker Lab, Cedars-Sinai Medical Center):
Comparative Analysis of Skyline and SmartPeak Performance in Quantifying a 60-Biomarker Panel in Plasma from Inflammatory Bowel Disease Patients
Lauren Royer (MOBILion Systems):
Leveraging CCS and Mobility Aligned Fragmentation for Ion Mobility Enhanced Analysis of Lipids
Yiying Zhu Ph.D., (Tsinghua University):
In-silico methods for distinguishing the glycan structural isomers by the isotope substitution
June 4, 2023
Michael J. MacCoss, Ph.D. (University of Washington):
Introduction and event host
Brendan MacLean (MacCoss Lab, University of Washington):
Status of the Skyline open-source software project 15 years after its inception
Abigail Burrows Franco Ph.D., (University of Kentucky):
Efficient generation of highly multiplexed serum biomarker panels using gas phase fractionation and DIA libraries
Philip Remes Ph.D., (Thermo Fisher Scientific):
A Skyline Tool for Creating Robust Large Scale Targeted MS/MS Assays
Julia Robbins, (Talus Bio):
How sweet it is: Leveraging the nuclear envelope glycome for the automated extraction of proteins from cell nuclei
Stoyan Stoychev Ph.D., (Evosep and ReSyn Biosciences):
Mag-Net: Bead based capture of membrane particles from plasma enables liquid biopsy measurements for >4,500 proteins
Gary Siuzdak Ph.D., (The Scripps Research Institute):
METLIN Ion Mobility: How to Analyze a Million Molecular Standards and Stay Sane
Lightning Talks
Ellen Casavant, Ph.D., (Genetech):
AutoQC enables efficient and reproducible LC-MS/MS chromatography and instrumentation
Gunnar Dittmar Ph.D., (Luxembourg Institute of Health):
Quantification of 782 Plasma Peptides by Multiplexed Targeted Proteomics
Jeroen Demmers Ph.D., (Erasmus MC Proteomics):
Targeted mass spectrometry reveals that USP7 regulates the ncPRC1 Polycomb axis
Tom Lin Ph.D., (Washington University in St. Louis):
An Unbiased Proteomics Method to Discover Posttranslational Arginylation Sites from Whole Proteomes
Eduard Sabido Ph.D., (Center for Genomics Regulation and the University Pompeu Fabra):
High-collision energy data-independent acquisition enables targeted and discovery identification of modified ribonucleotides by mass spectrometry
Ariana Shannon, (Ohio State University):
Generating fit-for-purpose targeted assays from a catalog of pre-screened peptides using data-independent acquisition (DIA) based figures of merit
June 5, 2022
Michael J. MacCoss, Ph.D. (University of Washington): Introduction and event host
Brendan MacLean (MacCoss Lab, University of Washington):
Status of the Skyline open-source software project 14 years after its inception
Nathan Basisty, Ph.D. (NIH):
Accurate Calculation of Protein Half-Lives with the TurnoveR External Tool in Skyline
James Dodds, Ph.D., (North Carolina Statue University):
Improving the Speed and Selectivity of Newborn Screening using Ion Mobility Spectrometry – Mass Spectrometry (IMS-MS) analyzed via Skyline.
Evan Hubbard (University of California - Riverside):
Finding and Quantifying Amino Acid Isomers in Data-independent Acquisition Data to Achieve Isomer Proteomics
Yishai Levin, (Weizmann Institute of Science ):
How Skyline Saved Us From Publishing Erroneous Data
Florence Roux-Dalvai, (CHU de Québec - Université Laval, Québec, Canada ):
Comparative analysis of library-based and library-free DIA strategies using Skyline software
Lightning Talks
Joanna Bons, Ph.D., (Buck Institute)
ZenoTOF 7600 Acquisitions with Electron Activated Dissociation and Novel Skyline Features for Quantification of Protein Post-translational Modifications
Lilian Heil, (University of Washington):
Automating Transition Refinement for Unit Resolution PRM
Alison Porter (University of Kentucky College of Medicine):
Identifying and Validating Bisphosphonate Protein Biomarkers in Equine Sera Using Mass Spectrometry Methods
Yixuan (Axe) Xie, Ph.D., (Washington University in St. Louis):
Development of data-independent acquisition (DIA-MS) methods for Glycan and RNA modification analysis
October 27 - 28, 2021
Michael J. MacCoss, Ph.D. (University of Washington): Introduction and event host
Brendan MacLean (MacCoss Lab, University of Washington):
Status of the Skyline Open-source Software Project 13 Years after its Inception
Chris Ashwood, Ph.D., (Glycomics Core, BIDMC):
High-throughput Glycan Composition Profiling Enabled by MALDISkyLink and the Skyline Ecosystem
Natan Basisty, Ph.D., (NIH):
Analysis of Protein Turnover Rates in Skyline with the TurnoveR External Tool
Michelle Kennedy, (Cristea Lab, Princeton University):
Leveraging Skyline to Develop and Analyze Data from a Targeted Mass Spectrometry Assay for Pan-herpesvirus Protein Detection
Bini Ramachandran, Ph.D., (FARRP, University of Nebraska-Lincoln):
Matrix-independent Calibration: A Consensus Strategy to Quantify an Analyte from Different Types of Matrices.
Juan Rojas,, (University of Leipzig - Hoffmann Lab):
Skyline for the Parallel Analysis of LC-TWIMS-MS/MS DDA and DIA Data
Lightning Talks
Robert Ahrends, Ph.D., (University of Vienna):
Targeting the Lipid Metabolism with LipidCreator and STAMPS to Investigate Fat Cell Differentiation of Mesenchymal Stem Cells
Elena Barletta, (University of Zurich):
Mass Spectrometry-based Identification of Allergen Proteins Involved in Seafood-related Allergic Reactions
Muluneh Fashe, Ph.D., (University of North Carolina - Lee Lab):
Using Skyline to Quantify Drug Metabolizing Enzyme and Transport Protein Concentrations in Sandwich-Cultured Primary Human Hepatocytes
MaKayla Foster, (North Carolina State University)
Utilizing Skyline for the Evaluation and Quantitation of Per- and Polyfluoroalkyl Substances
Virag Sagi-Kiss, Ph.D., (Imperial College London):
Rapid Sample Preprocessing of a Large Number of Targeted Metabolites with Skyline
Nikunj Tanna, (Waters Corporation):
MassLynx Skyline Interface - Enabling automated MRM method development for targeted proteomics and peptide bioanalysis workflows
May 27 - 28, 2020
Michael J. MacCoss, Ph.D. (University of Washington): Introduction and event host
Full Talks
Brendan MacLean (MacCoss Lab, University of Washington):
Status of the Skyline Open-source Software Project 12 Years after its Inception
Josue Baeza, Ph.D., (Garcia Lab, University of Pennsylvania):
> Applications of Skyline for Method Development and Quantification of Histone Marks
Viktoria Dorfer, Ph.D., (University of Applied Sciences - Upper Austria):
MS Amanda goes West: Integrating a Search Engine into Skyline
Todd Greco, Ph.D., (Cristea Lab, Princeton University):
Unbiased and Targeted Mass Spectrometry Provides Insight into Huntington’s Disease Pathogenesis
Kaylie Kirkwood, Ph.D., (Baker Lab, North Carolina State University):
Developing Multidimensional Small Molecule Spectral Libraries for Rapid Lipid Detection and Quantitation
Roman Sakson,, (Heidelberg Molecular Biology Center):
Unleashing Versatile Skyline Features for the Everyday Needs of a Proteomics Core Facility
Lightning Talks
Karine Bagramyan, Ph.D., (Kalkum Lab, Diabetes and Metabolism Research Institute):
Using Skyline to Quantify Botulinum Neurotoxin Activity in Complex Biological Samples
Aivett Bilbao, Ph.D., (PNNL):
Metabolite Profiling for Synthetic Biology using Ion Mobility-Mass Spectrometry and Data-Independent Acquisition with Improved Targeted Data Extraction Software
Sebastien Gallien, Ph.D., (Thermo Fisher Scientific):
Towards Turnkey Targeted Proteomics Solutions Using SureQuant Internal Standard Triggered Acquisition on Orbitrap Mass Spectrometers
Benjamin Orsburn, Ph.D., (Johns Hopkins Medical School):
> Skyline -- A Comprehensive Package for Cannabis Testing Labs
Tobias Schmidt (Kuster Lab, Technical University Munich):
Real-time Spectrum Prediction in Skyline via ProteomicsDB’s gRPC Interface to Prosit
June 2, 2019
Michael J. MacCoss, Ph.D. (University of Washington): Introduction and event host
Full Talks
Brendan MacLean (MacCoss Lab, University of Washington):
Status of the Skyline open-source software project 10 years after its inception
Birgit Schilling, Ph.D. (Buck Insitute) and Susan Abbatiello, Ph.D. (Northeastern):
Skyline: 10-year Retrospective: Part 1; Part 2
Pawel Sadowski, Ph.D. (Queensland University of Technology):
Teaching Old Dog New Tricks: Adaptation of Skyline to Analyze Untargeted Metabolomics Data Collected on GCMS Instrument
Tobias Schmidt, (Technical University Munich):
Using Prosit for PRM assay development and optimization
Selene Swanson, (Stowers Institute):
Absolute quantitative analysis of modified ribonucleosides in tRNA and mRNA using Skyline
Sebastian Vaca, Ph.D. (Broad Institute):
Avant-garde: A Skyline External Tool for automated data-driven DIA data curation.
Lightning Talks
Matthew MacDonald, Ph.D. (University of Pittsburgh):
Multi-omics Approach Identifies Pathological Phosphorylation Events Driving Synapse Loss in Schizophrenia
Sarah Michaud, (University of Victoria):
Development of Quantitative MRM Assays for the Measurement of 3,000 Proteins across 20 Mouse Tissues
Bhavin Patel, MD (Thermo Fisher Scientific):
Targeted Mass Spectrometry Assays for Absolute Quantitation of AKT/mTOR Signaling Pathway Proteins
June 3, 2018
Michael J. MacCoss, Ph.D. (University of Washington): Introduction and event host
Brendan MacLean, (MacCoss Lab, University of Washington):
Status of the Skyline open-source software project 9 years after its inception
Christopher Ashwood, (Macquarie University):
Applications of Skyline for automated profiling of cellular protein glycosylation
Paul Auger, (Genentech):
Automated quality control and system suitability in Panorama for peptide and small molecule analysis
Yao Chen, Ph.D., (Catalent Biologics):
Independent Digestion with Two Protease Enzymes Combining LC-HRMS Data Independent Acquisition (DIA)
Kristin Geddes, (Merck):
Implementation of Panorama into Daily Workflows and Quantitative Protein PK Analysis in the Pharmaceutical Setting
Lindsay Pino, (University of Washington):
Signal Calibration for Quantitative Proteomic
Lightning Talks
Robert Ahrends, Ph.D., (ISAS):
LipidCreator: A new skyline plugin for targeted LC-MS/MS-based lipidomics
Buyun Chen, (Genentech):
Important considerations for LC-MS based drug transporter quantitation
Don Davis, (Vanderbilt University):
The Development, Validation and Clinical Application of a LC – MS/MS Method for Absolute Quantification of Anti-Epileptic Drugs in Serum
June 4, 2017
Michael J. MacCoss, Ph.D. (University of Washington):
Introduction and event host
Matt Rardin Ph.D.(Amgen):
Improved Quality Control Workflows and Other Panorama Updates
Eralp Dogu, Ph.D. (Mugla Sitki Kocman University):
MSstatsQC: An R-based Tool to Monitor System Suitability and Quality Control Results for Targeted Proteomic Experiments
Michael Schirm, Ph.D., (Caprion):
Analysis of Large Scale MRM Studies Using Skyline
Simone Sidoli, Ph.D., (University of Pennsylvania):
DIA for Differential Quantification of Isobaric Phosphopeptides and Other Protein Post-translational Modifications
Adam Officer, (Broad Institute):
Skyline Metadata Annotation and Automation of Robust Data Processing via Panorama Allows for Facile Analysis of High Throughput Targeted Proteomics Data
Brendan MacLean, (MacCoss Lab, University of Washington):
Status of the Skyline open-source software project 9 years after its inception
Lightning Talks
Shadi Eshghi, Ph.D., (Genentech):
A Workflow for Quality Assessment, Quantitation and Statistical Inference of Targeted Proteomics Data using Skyline and Panorama
Matt Foster, Ph.D., (Duke University):
A Targeted Proteomic Assay Quantifies the Periodic Expression of Cell-cycle Regulators in Yeast S. Cerevisae.
Tania Auchynnikava, Ph.D., (University of Edenburgh):
Deciphering Mechanisms of Epigenetic Inheritance with MSX-DIA
Juan Chavez, Ph.D., (Univerity of Washington):
A General Method for Targeted Quantitative Cross-Linking Mass Spectrometry
Yang Zhang, Ph.D., (Amyris):
High Throughput Small Molecule Detection Using Automated Skyline Targeted Workflow
June 5, 2016
Michael J. MacCoss, Ph.D. (University of Washington):
Introduction and event host
Josh Eckels (LabKey):
Improved Quality Control Workflows and Other Panorama Updates
Jay Kirkwood, Ph.D. (Colorado State University):
The Flux Capacitor: Using Skyline for efficient processing of LC-MS/MS metabolic flux data
Brendan MacLean, (MacCoss Lab, University of Washington):
Status of the Skyline open-source software project 8 years after its inception
Diana A.T. Nijholt, Ph.D. (Erasmus MC):
Validating PZP as a biomarker for presymptomatic Alzheimer’s disease using targeted proteomics approaches
Lindsay Pino, (University of Washington):
Applying lessons learned from targeted mass spectrometry to data-independent acquisition (DIA) assays
Thierry Schmidlin, (Utrecht University):
Extending Selected Reaction Monitoring to Monitor Diet-Induced Neuropeptide Signaling
Lightning Talks
Matthew MacDonald, Ph.D. (University of Pittsburgh):
Synaptic Protein Networks in Neuropsychiatric Disease
Bing Peng, (ISAS):
Adaptation of Skyline for Targeted Lipidomics
Chris Petzold, Ph.D. (Lawrence Berkeley National Lab):
A Skyline-based workflow for rapid development of high-throughput quantitative proteomic assays
Qi Tang, (ProteinT Biotech):
Edited transition and RT information in Skyline library improves DIA quantification of cerebral spinal fluid (CSF) proteomes
May 31, 2015
Michael MacCoss, Ph.D. (University of Washington):
Introduction
Tom Dunkley, Ph.D., (Roche Innovation Center):
Targeted Proteomics (and Skyline) to Characterize an In Vitro Model of Human Neuronal Development
Martin Soste, M.Sc. (Picotti Lab, ETH Zurich):
A Sentinel Protein Assay for Simultaneously Quantifying Cellular Processes
Jim Bollinger, Ph.D. (MacCoss Lab, University of Washington):
Multiplexing Clinical Protein Targets in Dried Blood Spots
Sam Payne, Ph.D. (Pacific Northwest National Lab):
Viewing and Interpreting Data within a Biological Context
Chris Shuford, Ph.D. (LabCorp):
Real-world Application of Skyline in the Development of a Clinically Actionable Protein Measurement
Erin Baker, Ph.D. (Pacific Northwest National Lab):
Utilizing Skyline to Analyze Multidimensional LC-IMS(CID)-MS Data
Laura G. Dubois (Moseley Lab, Duke University):
Expanding Skyline’s Capabilities to Small Molecule Data Analysis
Sonia Ting (MacCoss Lab, University of Washington):
Application of PECAN for confident peptide detection directly from data-independent acquisition (DIA) MS/MS data
Bruno Domon, Ph.D. (Luxembourg Clinical Proteomics Center):
Development and Implementation of Parallel Reaction Monitoring Assays
Brendan MacLean (MacCoss Lab, University of Washington):
Status of the Skyline project seven years after its inception
June 15, 2014
Michael MacCoss, Ph.D. (University of Washington):
Introduction
Christopher Kinsinger, Ph.D. (National Cancer Institute):
The Skyline software project for clinical proteomics: lessons learned
Richard C. King, Ph. D. (PharmaCadence Analytical Services):
Skyline: Everyday tool for protein quantification
Michael Bereman, Ph. D. (North Carolina State University):
Statistical Process Control for Accessing Data Quality Throughout an LC MS/MS Experiment
Meena Choi (Vitek Lab, Purdue University):
MSstats as an external tool in Skyline – an R package for statistical analysis of quantitative mass spectrometry-based proteomic experiments
Stephen Pennington, Ph. D. (University College Dublin):
Label-free LC-MS and MRM assay development for discovery and verification of biomarkers for organ confined prostate cancer
Dario Amodei, Ph. D. (Mallick Lab, Stanford University):
Multi-Instrument, Skyline-Based Comparison of DIA Peptide Detection and Statistical Confidence Tools
Kristin R. Wildsmith, Ph. D. (Genentech):
Skyline & Panorama Case Study: Targeted proteomics enables Alzheimer’s disease biomarker development
Christopher M. Colangelo, Ph. D. (Yale University):
The Integration of Skyline, Panorama, and LabKey Server Interface for R to Analyze the 2013-2014 ABRF sPRG Research Group Study
Jeffrey Whiteaker, Ph. D. (Paulovich Lab, Fred Hutchinson Cancer Research Center):
CPTAC Assay Portal: a community web-based repository for well-characterized quantitative targeted proteomics assays
Brendan MacLean (MacCoss Lab, University of Washington):
Status of the Skyline open-source software project five years after its inception
June 9, 2013
Joseph Brown, Ph. D. (Smith Lab, Pacific Northwest National Laboratory):
Effective design and analysis of multiplexed quantitative SRM data with Skyline
Christine Carapito, Ph. D. (IPHC/CNRS/University of Strasbourg, France):
Developing, transferring, sharing, combining, and bridging global and targeted quantitative methods and data in a platform-independent manner with Skyline
Josh Eckels (LabKey Software):
Panorama: targeted proteomics repository software for Skyline
Jarrett D. Egertson (MacCoss Lab, University of Washington):
Application of data independent acquisition techniques optimized for improved precursor specificity
Andy Hoofnagle, MD, Ph. D. (University of Washington):
Using Skyline for Lipidomics
Jacob D. Jaffe, Ph. D. (Carr Lab, The Broad Institute):
Discovery to Targets for a Phosphoproteomic Signature Assay: One-stop shopping in Skyline
Brendan MacLean (MacCoss Lab, University of Washington):
Status of the Skyline open-source software project five years after its inception
Brett Phinney, Ph. D. (UC Davis Genome Center):
Using Skyline to analyze the SPRG2013-2014 Targeted Proteomics Standard
Matthew J. Rardin, Ph.D. (Buck Institute for Research on Aging):
Label free quantitation of proteomic data using MS1 Filtering and MS/MSALL with SWATH acquisition
Olga Shubert (Institute of Molecular Systems Biology, ETH Zürich):
Development and application of assays for targeted mass spectrometric analysis of the complete proteome of Mycobacterium tuberculosis
May 20, 2012
Jeffrey Whiteaker, Ph.D. (Fred Hutchinson Cancer Research Center)
Developing quantitative assays for biomarker development
Andrew B. Stergachis (University of Washington)
Rapid empirical identification of optimal peptides for targeted proteomics
Christina Ludwig, Ph.D. (ETH Zürich)
Pinpointing phosphorylation sites using Selected Reaction Monitoring and Skyline
Susan E. Abbatiello, Ph.D. (Proteomics Platform at the Broad Institute of MIT and Harvard)
Effectively Dealing with Transition Selection and Data Analysis for Multiplexed Quantitative SRM-MS Assays across Multiple Vendor Instruments
J. Will Thompson, Ph.D. (Duke Proteomics Core)
Using Skyline to Monitor Long-Term Performance Metrics of High-Resolution Mass Spectrometers
Birgit Schilling, Ph.D. (Buck Institute)
Platform Independent and Label-free Quantitation of Protein Acetylation and phosphorylation using MS1 Extracted Ion Chromatograms in Skyline
Jarrett D. Egertson (University of Washington)
Multiplexed Data Independent Acquisition for Comparative Proteomics
Brendan MacLean (University of Washington)
Status of the Skyline open-source software project four years after its inception
Publications
If you use Skyline in your experiments, please cite our Bioinformatics 2010 application note, or the more recent and comprehensive Pino, Mass Spectrometry Reviews 2017 paper, listed below.
If you use Skyline for small molecule research, please cite our Journal of Proteome Research 2020 paper, listed below.
If you use Skyline for calibrated quantification, please cite our Clinical Chemistry 2017 letter, listed below.
If you use Skyline MS1 filtering, please cite our Mollecular Cellular Proteomics 2012 paper, listed below.
If you use Skyline for collision energy optimization, please cite our Analytical Chemistry 2010 paper, listed below.
Citation counts below as of April 8, 2025.
Please feel free to download the Skyline logo vector graphics and use them in your papers to illustrate your use of Skyline for data analysis.
Peer reviewed manuscripts:
- MacLean, Bioinformatics 2010 paper (cited by 4,918)
Skyline: An Open Source Document Editor for Creating and Analyzing Targeted Proteomics Experiments
[abstract][pdf] - Pino, Mass Spectrometry Reviews 2017 paper (cited by 697)
The Skyline ecosystem: Informatics for quantitative mass spectrometry proteomics
[abstract][full-text] - Tsantilas, Journal of Proteome Research 2024 paper (cited by 10)
A Framework for Quality Control in Quantitative Proteomics
[abstract][full-text] - Marsh, Journal of Proteome Research 2022 paper (cited by 7)
Skyline Batch: An Intuitive User Interface for Batch Processing with Skyline
[abstract][full-text] - Adams, Journal of Proteome Research 2020 paper (cited by 399)
Skyline for Small Molecules: A Unifying Software Package for Quantitative Metabolomics
[abstract][full-text] - Rohde, Bioinformatics 2020 paper (cited by 6)
Audit Logs to enforce document integrity in Skyline & Panorama
[abstract][full-text] - MacLean, JASMS 2018 paper (cited by 83)
Using Skyline to Analyze Data-Containing Liquid Chromatography, Ion Mobility Spectrometry, and Mass Spectrometry Dimensions
[abstract][pdf] - Henderson, Clinical Chemistry 2017 letter (cited by 52)
Skyline Performs as Well as Vendor Software in the Quantitative Analysis of Serum 25-Hydroxy Vitamin D and Vitamin D Binding Globulin
[abstract][full-text] - Bereman, Journal of Proteome Research 2016 paper (cited by 65)
An Automated Pipeline to Monitor System Performance in Liquid Chromatography Tandem Mass Spectrometry Proteomic Experiments
[article] - Sharma, Journal of Proteome Research 2014 paper (cited by 231)
Panorama: A Targeted Proteomics Knowledge Base
[article] - Sharma, Mollecular & Cellular Proteomics 2018 paper (cited by 230)
Panorama Public: A public repository for quantitative data sets processed in Skyline
[article] - Broudy, Killeen, Bioinformatics 2014 paper (cited by 42)
A framework for installable external tools in Skyline
[abstract] - Schilling, Analytical Chemistry 2015 paper (cited by 110)
Multiplexed, Scheduled, High-Resolution Parallel Reaction Monitoring on a Full Scan QqTOF Instrument with Integrated Data-Dependent and Targeted Mass Spectrometric Workflows.
[abstract] - Egertson, Nature Protocols 2015 paper (cited by 248)
Multiplexed peptide analysis using data-independent acquisition and Skyline
[abstract] - Abbatiello, Mollecular Cellular Proteomics 2015 paper (cited by 202)
Large-scale inter-laboratory study to develop, analytically validate and apply highly multiplexed, quantitative peptide assays to measure cancer-relevant proteins in plasma
[abstract] - Egertson, Nature Methods 2013 paper (cited by 360)
Multiplexed MS/MS for improved data-independent acquisition
[abstract] - Abbatiello, Mollecular Cellular Proteomics 2013 paper (cited by 131)
Design, Implementation, and Multi-Site Evaluation of a System Suitability Protocol for the Quantitative Assessment of Instrument Performance in LC-MRM-MS
[abstract] - Schilling, Mollecular Cellular Proteomics 2012 paper (cited by 508)
Platform independent and label-free quantitation of proteomic data using MS1 extracted ion chromatograms in Skyline. Application to protein acetylation and phosphorylation
[abstract] - Choi, Journal of Proteome Research 2017 paper (cited by 39)
ABRF Proteome Informatics Research Group (iPRG) 2015 Study: Detection of Differentially Abundant Proteins in Label-Free Quantitative LC-MS/MS Experiments.
[abstract] - Sherrod, Journal of Proteome Research 2012 paper (cited by 81)
Label-Free Quantitation of Protein Modifications by Pseudo-Selected Reaction Monitoring with Internal Reference Peptides
[abstract] - Escher, Proteomics 2012 paper (cited by 656)
Using iRT, a normalized retention time for more targeted measurement of peptides
[abstract] - Bereman, Proteomics 2012 paper (cited by 139)
The development of selected reaction monitoring methods for targeted proteomics via empirical refinement
[abstract] - Stergachis, Nature Methods 2011 paper (cited by 148)
Rapid empirical discovery of optimal peptides for targeted proteomics
[abstract] - MacLean, Analytical Chemistry 2010 paper (cited by 271)
Effect of Collision Energy Optimization on the Measurement of Peptides by Selected Reaction Monitoring (SRM) Mass Spectrometry
[abstract] - Prakash, Journal of Proteome Research 2009 paper (cited by 181)
Expediting the Development of Targeted SRM Assays: Using Data from Shotgun Proteomics to Automate Method Development
[abstract]
Publications featuring Panorama:
- PanoramaWeb Publications Page
[link]
Presentations and posters:
- Shteynberg, ASMS 2025 Poster
Automated Library Building Using AlphaPeptDeep and Carafe AI Tools in Skyline
[pdf] - Chambers, ASMS 2025 Poster
Skyline and msconvert on Docker
[pdf] - Shulman, ASMS 2025 Poster
Conditional use of search-engine-determined integration boundaries in Skyline 25.2
[pdf] - Shulman, ASMS 2024 Poster
Run-to-run retention time alignment improves peak picking in Skyline
[pdf] - Shulman, ASMS 2023 Poster
Optimizing lower limits of quantification and detection by choosing transitions in Skyline
[pdf] - Shulman, ASMS 2022 Poster
Improving Selectivity in Quantitative Proteomics Using Targeted MS/MS/MS
[pdf] - MacLean, ASMS 2020 Presentation
Skyline integrates the Prosit prediction server for proteome-wide DIA data analysis using on-demand fragment intensity and iRT prediction
[pdf] [video] - Pratt, ... MacLean, ASMS 2020
Skyline Support for Proteome-wide Data Analysis of Bruker timsTOF dia-PASEF Acquisition
[pdf] - Rohde, ASBMB 2019, Poster
Integration of the deep learning prediction tool Prosit into Skyline for high-accuracy, on-demand fragment intensity and iRT prediction
[pdf] - Rohde, Chupalov, ASMS 2019, Poster
Audit Logs to enforce document integrity in Skyline and Panorama
[pdf] - Pratt, ASMS 2019 Poster
Metabolomic Profiling of Small Molecule Ion Mobility Assisted Data Independent Acquisition Data Using Skyline
[pdf] - Pratt, ASMS 2017 Poster
Recent Advances in Skyline: Further Improvements in Small Molecule Targets and Ion Mobility
[pdf] - Pratt, ASMS 2015 Poster
Recent Advances in Skyline: Small Molecule Targets and Ion Mobility Filtering
[pdf] - Thompson, MSACL 2015 Poster
Skyline for small molecules: a flexible tool for cross-platform LC-MS/MS method creation and data analysis for metabolomics
[pdf] - MacLean, ASMS 2014 Presentation
Rapid Processing of Large Scale Quantitative Proteomics Projects: Integration of Skyline with the CHORUS Cloud
[pdf] - Amodei, ASMS 2014 Poster
A multi-site, Skyline-based comparison of DIA peptide detection and statistical confidence tools
[pdf] - MacLean, ASMS 2013 Poster
Integration of mProphet chromatogram peak identification probability model into Skyline
[pdf] - Amodei, ASMS 2013 Poster
An Instrument-Independent Demultiplexing Method for Computationally Improving the Specificity of Data-Independent Acquisition
[pdf] - Eckels, ASMS 2013 Poster
Sharing targeted proteomics assays using Skyline and Panorama
[pdf] - MacLean, ASMS 2012 Presentation
Targeted Proteomics Quantitative Analysis of Data Independent Acquisition MS/MS in Skyline
[pdf] [PowerPoint] [video] - Sharma, ASMS 2012 Poster
Panorama: A private repository of targeted proteomics assays for Skyline
[pdf] - Egertson, ASMS 2012 Poster
Multiplexed Data Independent Acquisition for Comparative Proteomics
[pdf] - MacLean, ASMS 2011 Poster
Skyline: Targeted Proteomics with Extracted Ion Chromatograms from Full-Scan Mass Spectra
[pdf] - Tomazela, ASMS 2011 Poster
Developing system suitability criteria and evaluation methods for proteomics experiments
[pdf] - MacLean, ASMS 2010 Presentation
Skyline: Sharing SRM/MRM Method Creation and Results Analysis Across Laboratories and Instrument Platforms
[pdf] - Tomazela, ASMS 2010 Poster
Effect of Collision Energy Optimization on the Measurement of Peptides by Selected Reaction Monitoring (SRM) Mass Spectrometry
[pdf] - MacLean, ASMS 2009 Poster
Automated Creation and Refinement of Complex Scheduled SRM Methods for Targeted Proteomics
[pdf]
Invited reviews:
- US HUPO News 2011 TechTalk - Skyline: A Bridge Between Discovery and Targeted Proteomics
[article]
ASMS 2012 WOA am MacLean Presentation
Watch the video recording of Brendan MacLean's ASMS 2012 presentation Targeted Proteomics Quantitative Analysis of Data Independent Acquisition MS/MS in Skyline
ASMS 2020 WOA am MacLean Presentation
Watch the video recording of Brendan MacLean's ASMS 2020 presentation Skyline integrates the Prosit prediction server for proteome-wide DIA data analysis using on-demand fragment intensity and iRT prediction
[slides]
Press
- Journal of the American Society for Mass Spectrometry (Volume 27, Number 11) lead front page story about Michael MacCoss receiving the 2015 ASMS Biemann Award from his work in bioinformatics and software for "omics" researchers (Skyline and Panorama).
[html] [cover pdf] - NCI eProtein feature
Viewing the Targeted Proteomics Horizon with Skyline
[html] - Nature Methods chooses targeted proteomics as Method of the Year in 2012
Targeted proteomics
[html] - NCI eProtein feature
Open Source Software Tool Skyline Reaches Key Agreement with Mass Spectrometer Vendors
[html] - PROTEOMICS article
Free computational resources for designing selected reaction monitoring transitions
[abstract] - Q-MOP Symposium review
Quantitative proteomics: A central technology for systems biology
[html] - NCI eProtein spotlight
Skyline: Building a Bigger Net for Targeted Proteomics
[pdf]
Awards
2016
-
Mike wins HUPO award Professor Mike MacCoss awarded the HUPO Discovery in Proteomic Sciences Award for his developments in methodology and software for the quantitative analysis of complex protein mixtures. The focus of his lab is the development of high-throughput quantitative proteomic methods and their application to model organisms. To enable this research, Mike and his research team have developed a software program Skyline -- a free, openly available software package for the design and interpretation of targeted proteomics experiments -- which as had a remarkable impact and is widely adopted within the proteomics community. This has placed Mike as a leader in the field of quantitative proteomics. [pdf]
-
Brendan MacLean wins inaugural Gilbert S. Omenn Computational Proteomics Award - In 2016, US HUPO announced the Gilbert S. Omenn Award for computational proteomics and the first recipient was no other than the MacCoss Lab's own Skyline Principal Developer, Brendan MacLean. The Omenn award recognizes the specific achievements of scientists that have developed bioinformatics, computational, statistical methods and/or software used by the proteomics community.
2015
- Dr. Mike MacCoss wins ASMS Biemann Award for 2015 Professor Michael MacCoss received the 2015 American Society for Mass Spectrometry (ASMS) Biemann Award, in part, from the creation of software for "omics" researchers. In their award announcement, ASMS cited Mike's philosophy on making high quality, freely available software -- Skyline and Panorama -- and providing for their long term support. This has enables many others to greatly benefit and has advanced the field of proteomic sciences, ASMS stated.
[html]
License Agreement
ADDENDUM TO APACHE LICENSE
To the best of our ability we deliver this software to you under the Apache 2.0 License listed below (the source code is available in the ProteoWizard project). This software does, however, depend on other software libraries which place further restrictions on its use and redistribution. By accepting the license terms for this software, you agree to comply with the restrictions imposed on you by the license agreements of the software libraries on which it depends:
Agilent MHDAC and MIDAC Libraries
ALGLIB numerical analysis and data processing library
Bruker Baf2Sql and TDF Development Kit Libraries
SCIEX WIFF File Reader Library
Shimadzu DataReader and IoModule Libraries
Thermo Scientific RawFileReader Library
Waters MassLynxRaw Library
Mascot Parser
NOTE: If you do not plan to redistribute this software yourself, then you are the "end-user" in the above agreements.
TERMS AND CONDITIONS FOR USE, REPRODUCTION, AND DISTRIBUTION
1. Definitions.
"License" shall mean the terms and conditions for use, reproduction, and distribution as defined by Sections 1 through 9 of this document.
"Licensor" shall mean the copyright owner or entity authorized by the copyright owner that is granting the License.
"Legal Entity" shall mean the union of the acting entity and all other entities that control, are controlled by, or are under common control with that entity. For the purposes of this definition, "control" means (i) the power, direct or indirect, to cause the direction or management of such entity, whether by contract or otherwise, or (ii) ownership of fifty percent (50%) or more of the outstanding shares, or (iii) beneficial ownership of such entity.
"You" (or "Your") shall mean an individual or Legal Entity exercising permissions granted by this License.
"Source" form shall mean the preferred form for making modifications, including but not limited to software source code, documentation source, and configuration files.
"Object" form shall mean any form resulting from mechanical transformation or translation of a Source form, including but not limited to compiled object code, generated documentation, and conversions to other media types.
"Work" shall mean the work of authorship, whether in Source or Object form, made available under the License, as indicated by a copyright notice that is included in or attached to the work (an example is provided in the Appendix below).
"Derivative Works" shall mean any work, whether in Source or Object form, that is based on (or derived from) the Work and for which the editorial revisions, annotations, elaborations, or other modifications represent, as a whole, an original work of authorship. For the purposes of this License, Derivative Works shall not include works that remain separable from, or merely link (or bind by name) to the interfaces of, the Work and Derivative Works thereof.
"Contribution" shall mean any work of authorship, including the original version of the Work and any modifications or additions to that Work or Derivative Works thereof, that is intentionally submitted to Licensor for inclusion in the Work by the copyright owner or by an individual or Legal Entity authorized to submit on behalf of the copyright owner. For the purposes of this definition, "submitted" means any form of electronic, verbal, or written communication sent to the Licensor or its representatives, including but not limited to communication on electronic mailing lists, source code control systems, and issue tracking systems that are managed by, or on behalf of, the Licensor for the purpose of discussing and improving the Work, but excluding communication that is conspicuously marked or otherwise designated in writing by the copyright owner as "Not a Contribution."
"Contributor" shall mean Licensor and any individual or Legal Entity on behalf of whom a Contribution has been received by Licensor and subsequently incorporated within the Work.
2. Grant of Copyright License. Subject to the terms and conditions of this License, each Contributor hereby grants to You a perpetual, worldwide, non-exclusive, no-charge, royalty-free, irrevocable copyright license to reproduce, prepare Derivative Works of, publicly display, publicly perform, sublicense, and distribute the Work and such Derivative Works in Source or Object form.
3. Grant of Patent License. Subject to the terms and conditions of this License, each Contributor hereby grants to You a perpetual, worldwide, non-exclusive, no-charge, royalty-free, irrevocable (except as stated in this section) patent license to make, have made, use, offer to sell, sell, import, and otherwise transfer the Work, where such license applies only to those patent claims licensable by such Contributor that are necessarily infringed by their Contribution(s) alone or by combination of their Contribution(s) with the Work to which such Contribution(s) was submitted. If You institute patent litigation against any entity (including a cross-claim or counterclaim in a lawsuit) alleging that the Work or a Contribution incorporated within the Work constitutes direct or contributory patent infringement, then any patent licenses granted to You under this License for that Work shall terminate as of the date such litigation is filed.
4. Redistribution. You may reproduce and distribute copies of the Work or Derivative Works thereof in any medium, with or without modifications, and in Source or Object form, provided that You meet the following conditions:
a. You must give any other recipients of the Work or Derivative Works a copy of this License; and
b. You must cause any modified files to carry prominent notices stating that You changed the files; and
c. You must retain, in the Source form of any Derivative Works that You distribute, all copyright, patent, trademark, and attribution notices from the Source form of the Work, excluding those notices that do not pertain to any part of the Derivative Works; and
d. If the Work includes a "NOTICE" text file as part of its distribution, then any Derivative Works that You distribute must include a readable copy of the attribution notices contained within such NOTICE file, excluding those notices that do not pertain to any part of the Derivative Works, in at least one of the following places: within a NOTICE text file distributed as part of the Derivative Works; within the Source form or documentation, if provided along with the Derivative Works; or, within a display generated by the Derivative Works, if and wherever such third-party notices normally appear. The contents of the NOTICE file are for informational purposes only and do not modify the License. You may add Your own attribution notices within Derivative Works that You distribute, alongside or as an addendum to the NOTICE text from the Work, provided that such additional attribution notices cannot be construed as modifying the License.
You may add Your own copyright statement to Your modifications and may provide additional or different license terms and conditions for use, reproduction, or distribution of Your modifications, or for any such Derivative Works as a whole, provided Your use, reproduction, and distribution of the Work otherwise complies with the conditions stated in this License.
5. Submission of Contributions. Unless You explicitly state otherwise, any Contribution intentionally submitted for inclusion in the Work by You to the Licensor shall be under the terms and conditions of this License, without any additional terms or conditions. Notwithstanding the above, nothing herein shall supersede or modify the terms of any separate license agreement you may have executed with Licensor regarding such Contributions.
6. Trademarks. This License does not grant permission to use the trade names, trademarks, service marks, or product names of the Licensor, except as required for reasonable and customary use in describing the origin of the Work and reproducing the content of the NOTICE file.
7. Disclaimer of Warranty. Unless required by applicable law or agreed to in writing, Licensor provides the Work (and each Contributor provides its Contributions) on an "AS IS" BASIS, WITHOUT WARRANTIES OR CONDITIONS OF ANY KIND, either express or implied, including, without limitation, any warranties or conditions of TITLE, NON-INFRINGEMENT, MERCHANTABILITY, or FITNESS FOR A PARTICULAR PURPOSE. You are solely responsible for determining the appropriateness of using or redistributing the Work and assume any risks associated with Your exercise of permissions under this License.
8. Limitation of Liability. In no event and under no legal theory, whether in tort (including negligence), contract, or otherwise, unless required by applicable law (such as deliberate and grossly negligent acts) or agreed to in writing, shall any Contributor be liable to You for damages, including any direct, indirect, special, incidental, or consequential damages of any character arising as a result of this License or out of the use or inability to use the Work (including but not limited to damages for loss of goodwill, work stoppage, computer failure or malfunction, or any and all other commercial damages or losses), even if such Contributor has been advised of the possibility of such damages.
9. Accepting Warranty or Additional Liability. While redistributing the Work or Derivative Works thereof, You may choose to offer, and charge a fee for, acceptance of support, warranty, indemnity, or other liability obligations and/or rights consistent with this License. However, in accepting such obligations, You may act only on Your own behalf and on Your sole responsibility, not on behalf of any other Contributor, and only if You agree to indemnify, defend, and hold each Contributor harmless for any liability incurred by, or claims asserted against, such Contributor by reason of your accepting any such warranty or additional liability.
END OF TERMS AND CONDITIONS
Other
Other topics that may be of interest:
How You Can Help
At the MacCoss Lab, we believe that a strong community around an open source software project can produce world-class software. Examples abound: Firefox, Linux and projects of the Apache Software Foundation. We are working hard to see Skyline and its parent project, ProteoWizard, live up to the standard set by these examples. Already our efforts have been greatly aided by others inspired by our initial work. We encourage anyone who feels they benefit from the Skyline project to consider helping improve and sustain it in any of the following ways:
- Sign up as a registered user of the software to help us prove the broad appeal of our software and keep development and support funded.
- Post a statement explaining how your work has benefitted from using Skyline to encourage further growth in the project community.
- Publish or present your targeted proteomics work citing the Skyline manuscript, using Skyline graphs in your figures, and/or making your Skyline documents publicly available.
- Help a friend or collaborator get started using Skyline.
- Post to the support board your questions and comments.
- Take the time to work through an issue with the Skyline team and explain how the software might be improved to avoid others encountering it.
- Contribute a tutorial or tip. Follow the example of existing tutorials and tips, and explain how to use features that are important to you.
- Contribute development time to the open source project, if you are a programmer.
Join the growing community of contributors that have helped to make Skyline what it is today.
Get Involved
Jobs
The Skyline jobs board helps employers and job seekers interested in Skyline, Panorama and targeted mass spectrometry connect.
Contribute
Make a tax-deductible contribution to the Skyline project this year through the University of Washington Foundation

Comment
See what the community is saying about Skyline - and add your statement!
3rd-Party Software
Software Support:
 |
 |
||||
 |
 |
||||
|
|||||


Related
Dashboard
Skyline adoption and use information
Panorama
Create a new project for your lab or group on PanoramaWeb hosted by the University of Washington

Or, host your own Panorama installation by joining the Panorama Partners Program
ProteoWizard
Skyline source code is available under Apache 2.0 License and part of the ProteoWizard project (mzML and mzXML conversion)

Spectral Library Links
NIST
PeptideAtlas
SWATHAtlas
Prosit
Funding
Current Financial Support:
|
||
|
Title: Support of Agilent Mass Spectrometers within the Skyline and Panorama Software Projects |
||
|
Title: Support of Bruker Mass Spectrometers within the Skyline and Panorama Software Projects |
||
|
Title: Support of Shimadzu Mass Spectrometers within the Skyline and Panorama Software Projects |
||
|
Title: Support of Thermo Fisher Mass Spectrometers within the Skyline and Panorama Software Projects |
||
|
Title: Support of Waters Mass Spectrometers within the Skyline and Panorama Software Projects |
||
Prior Financial Support: |
||
|
Title: Support of SCIEX Mass Spectrometers within the Skyline and Panorama Software Projects |
||
|
Title: Skyline Targeted Proteomics Environment |
||
|
Title: The Chorus Project: A Sustainable Cloud Solution for Mass Spectrometry Data |
||
|
Title: Comprehensive Biology: Exploiting the Yeast Genome |
||
|
Title: Library of Integrated Network-Based Cellular Signatures |
||
|
Title: Self Correcting Nanoflow LC-MS for Clinical Proteomics |
||
|
Title: Data Acquisition and Analysis Strategies for Improving the Analysis of Peptide Mixtures Using Thermo Fisher Mass Spectrometers |
||
|
Title: Validating Protein Pathway Information – Integrating Proteomic Data with Transcriptomic or Metabolomic Data Sets |
||
|
Title: Genetic Regulation of Surfactant Deficiency |
||
|
Title: Label Free Differential Protein Analysis |
||
|
Title: Clinical Proteomic Technology Assessment for Cancer (CPTAC) |
Seattle Quant: A Resource for the Skyline Software Ecosystem

 Development on Skyline started in 2008 to fill a critical need for a software tool to enable targeted proteomics experiments. The development of Skyline grew into an entire ecosystem of tools and has since expanded beyond targeted proteomics to support a variety of acquisition methods (e.g. DDA, DIA, PRM, and PASEF) and other molecule types. The Skyline software ecosystem is one of the most widely used software platforms in all of mass spectrometry. The current software and its thriving community create exciting new opportunities for quantitative mass spectrometry. The Skyline project has grown beyond the bounds of a single tool. There are now 17 Skyline external tools that rely on a formalized framework in Skyline, with more in development. Some of these tools have been installed >10,000 times. We have also created the Panorama Knowledgebase and Panorama Public, a platform allowing Skyline users to organize, share, and disseminate processed quantitative proteomics data, as well as tools like AutoQC and Skyline Batch that take advantage of the Skyline command-line interface for automated bulk processing. In this grant, we propose creating a resource that will enable the continued development, maintenance, and support of these community tools and their dissemination within the community. These tools support 1000s of registered users in their basic science, pre-clinical, and translational research. Seattle Quant is a resource funded by the National Institute for General Medical Sciences (R24 GM141156) with the goal to support this community, maintain the tools, and expand the capabilities of the ecosystem of tools. Specifically, Seattle Quant has four aims. 1) Expand our test infrastructure to improve the robustness, stress test the software, confirm compatibility across computer systems, and track performance over time. 2) Improve support for both proteomics and non- proteomics workflows. 3) Improve the collection, sharing, annotation and dissemination of mass spectrometry data and Skyline documents. 4) Provide continued support and training for the Skyline ecosystem.
|
Dashboard
Learn more about the adoption and growth of Skyline use for targeted mass spectrometry around the world.
View the Skyline 500 Report to see how the cities of the world rank for visits to the Skyline web site. The Skyline web site has seen over 39,500 users over the past 6 months, 38% of which came from the United States
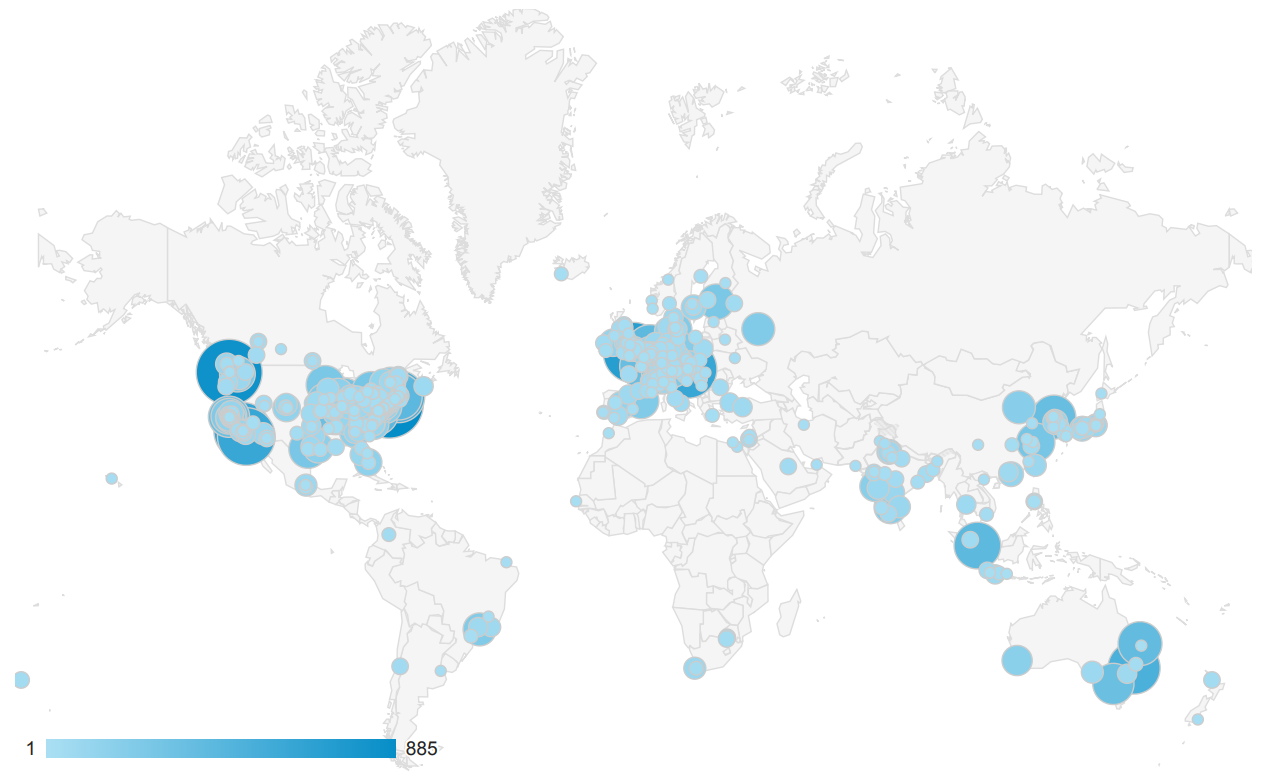
There have been over 199,000 new installations of Skyline since it was first publicly released at ASMS 2009, with 1700 installations on average each month over the past 6 months.
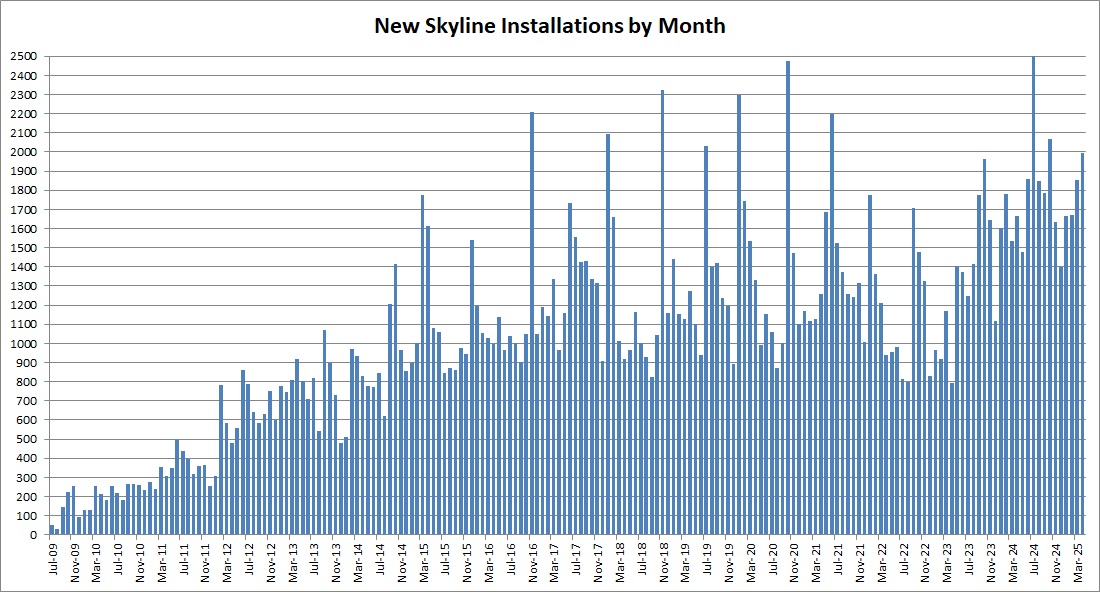
* - Individuals may have installed more than once or to multiple computers in this time
Skyline version 24.1 was released to great interest (over 19,000 instances in 7 days).
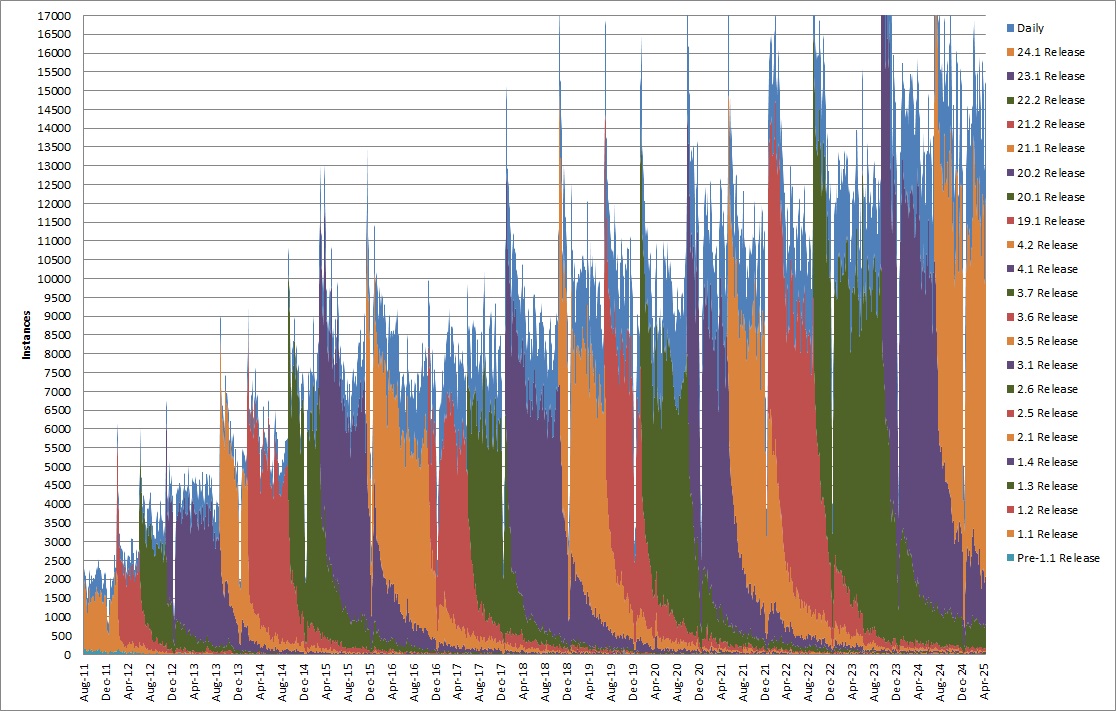
* - Individuals may start multiple instances of Skyline in a day or use a single instance for longer than a week
Team
The following team members have made invaluable, direct contributions to the effort to build Skyline:
 |
Brendan MacLean - principal developer Brendan worked at Microsoft for 8 years in the 1990s where he was a lead developer and development manager for the Visual C++/Developer Studio Project. Since leaving Microsoft, Brendan has been the Vice President of Engineering for Westside Corporation, Director of Engineering for BEA Systems, Inc., Sr. Software Engineer at the Fred Hutchinson Cancer Research Center, and a founding partner of LabKey Software. In this last position he was one of the key programmers responsible for the Computational Proteomics Analysis System (CPAS), made significant contributions to the development of X!Tandem and the Trans Proteomic Pipeline, and created the LabKey Enterprise Pipeline. Since August, 2008 he has worked as a Sr. Software Engineer within the MacCoss lab and been responsible for all aspects of design, development and support in creating the Skyline Targeted Mass Spec Environment and its growing worldwide user community. |
|
 |
Eduardo Armendariz - development Eduardo began his software career in 2013 at Mirth, where he supported and developed the open-source clinical and administrative health data messaging engine, Mirth Connect. In 2016, he joined Amazon, contributing to the launch of Prime Now 3P services and later working on AWS Lambda. Most recently, Eduardo has been at Microsoft, where he designed and developed services to advance Chaos engineering within the Office infrastructure. |
|
 |
Matthew Chambers - development (ProteoWizard) Matt has worked in mass spectrometry informatics (mostly proteomics) since 2005; the first ten years he worked for David Tabb and Bing Zhang at Vanderbilt University Medical Center, and since then he has continued working as an independent consultant. He has worked in many subfields within MS, including shotgun proteomics database search, sequence tagging, spectral library search, and protein assembly. Along with Darren Kessner (director: Parag Mallick), Matt developed ProteoWizard, a free open-source library for mass spectrometry data processing. Since 2009, he has been its principal developer. The ProteoWizard tool msconvert is widely used for converting mass spectrometry data by users all over the world. For Skyline, he has focused on being able to read data directly from vendor proprietary data formats. |
|
 |
Rita Chupalov
development Rita’s experience with software and computers goes back to a Russian clone of DEC’s PDP-11 in 1991. She finished her degree in Organic Chemistry from Saint-Petersburg State University in 1996 where she wrote her first mass-spectrometry software: identification of halogen isotopic multiplets in low-resolution mass-spectra. Since then she worked for multiple software development companies specializing on database-centric applications, analytics and data warehousing. Her most recent job was with Amazon where she learned big data and cloud technologies. |
|
 |
Brian Connolly - IT Over the years Brian has worked for a number of companies in the Seattle area including Microsoft, BEA Systems and Cray. In 2007 Brian joined LabKey where he wore a number of hats. He helped LabKey's customers design and operate their LabKey Servers and pipelines. He architected and operated all of LabKey's Servers running in the public cloud (AWS and other cloud vendors) and became an expert in FISMA and HIPAA regulations. As part of the Skyline Team, Brian is responsible for managing growth of the PanoramaWeb.org and Skyline.ms servers and helping the team grow its use of the AWS cloud. |
|
 |
Eddie O'Neil - development Eddie started his career in the 90s working with Prof. Charles M. Grisham at the University of Virginia (UVa) on software for teaching biochemistry. Since then, he built products and cross-functional teams in a variety of engineering and product management roles at Meta, Salesforce, BEA Systems, and a startup. He holds degrees in computer science from UVa. |
|
 |
Brian Pratt
- development, support Brian's computing career extends all the way back to the days of the Apple II and TRS-80. Along the way there have been a couple of startups, with forays into robot-assisted surgery, circuit board manufacturing and test, internet firewalls, and, most recently, mass spec. Brian's proteomics work prior to joining the Skyline team included contributions to TPP, X!Tandem, LabKey's CPAS, and ProteoWizard. He's excited to be on a team of software professionals that value performance, reliability, and usability in the support of science. |
|
 |
Vagisha Sharma
- development, support, documentation (Panorama) Vagisha got involved with proteomics at UC San Diego where she worked with Prof. Vineet Bafna. During that time she built her first tools for visualizing Mass Spectrometry data while working at ActivX Biosciences. Since moving to Seattle Vagisha has worked on Mass Spectrometry pipelines for the Aebersold group at the Institute for Systems Biology, and developed a data management system while at the University of Washington Proteomics Resource and the Yeast Resource Center. She joined the Skyline team in October, 2011. Vagisha enjoys developing tools that help researchers get stuff done. |
|
 |
David Shteynberg
- development Before joining the Skyline team, David Shteynberg spent over 20 years at the Institute for Systems Biology. David started his scientific career developing microarray robotics technology in Dr. Leroy Hood Lab. By 2004, he shifted to computational mass spectrometry in Dr. Ruedi Aebersold and Dr. Robert Moritz Labs. Developing novel computational algorithms (e.g. iProphet and PTMProphet) and extending other commonly used proteomics classifiers and data-analysis tools, his contributions have become pivotal in the field of computational proteomics. Recently, he is advancing machine-learning AI for peptide spectrum prediction and for identifying peptides with adducts and PTMs in mass-spectrometry proteomics DIA data. |
|
 |
Nicholas Shulman
- development Nick worked from 1995-2000 at Microsoft on the Microsoft Access team, leaving to join Westside Corporation with Brendan to create browser-based database design tools. After Westside was acquired by BEA Systems, Nick created a new graphical JSP designer for Weblogic Workshop, an award winning Integrated Development Environment for enterprise Java applications. At LabKey Corporation, Nick created the flow cytometry module and the graphical query designer. Since March, 2009 he has worked in the Maccoss lab on Skyline and Topograph, a quantitative analysis tool for protein turnover experiments. |
|
 |
Mark Belanger - project manager - outreach & user education Mark had a full career in communications across a number of industries including travel, start-ups, games and more. During that time, he brought technology solutions to legacy businesses and cutting-edge enterprises alike. He implemented a range of web sites, from first-generation web presence to full ecommerce and social platforms, taking companies from the pre-digital era into the modern age. He established email and mobile communication programs, and managed outreach teams and projects. Mark has an MBA in Information Systems from Seattle University. As a project manager for the Skyline team, Mark is responsible for outreach programs, like webinars, courses, and user meetings, foreign language translation, and website presence. |
Previous contributors:
- Kaipo Tamura - development - (now LegalZoom)
- Susan E. Abbatiello, Ph.D. - software design, data acquisition, scientific consulting (Broad Institute, Thermo, NEU, now Waters)
- Dario Amodei, Ph.D. - development - Stanford (Baidu, Google, OpenAI, now Anthropic)
- Nat Brace - project manager - outreach & user education
- Jarrett Egertson, Ph.D. - development - UW (MSX and overlapped demux) (now Nautilus Biotech)
- Gregory Finney, Ph.D. - development - UW (Crawdad)
- Barbara Frewen - development - UW (BiblioSpec, Thermo BRIMS, now Zymergen)
- Tahmina Jahan, MD - development (now Seattle Children's)
- Randall Kern - development architecture consulting (Microsoft, now SalesForce.com)
- Don Marsh - development (now Olis Robotics)
- Birgit Schilling, Ph.D. - software design, data acquisition, scientific consulting, documentation (Buck Institute)
- Daniela Tomazela, Ph.D. - software design, data acquisition, scientific consulting (Merck, now Gilead)
- Yuval Boss - development intern - UW (NOAA, Amazon, now Fidler AI)
- Clark Brace - development intern - UPS
- Daniel Broudy - development intern - Harvard (now Google, Seattle)
- John Chilton - development intern - UW
- Henry Estberg - development intern - UC Santa Cruz (now HashiCorp)
- Mimi Fung - development intern - UW (now Microsoft)
- Max Horowitz-Gelb - development intern - U. Wisconsin (now Google, Seattle)
- Shannon Joyner - development intern - CMU (Cisco Meraki, Cornell, Afresh, now Google)
- Hanna Kidanemariam - development intern - Dartmouth College (now Microsoft)
- Alana Killeen - development intern - UW (Microsoft, Dropbox, Nautilus Biotech, now ACLU)
- Trevor Killeen - development intern - UW (Facebook, now Stripe)
- Aaron Igra - development intern - Brown (now ExodusPoint Capital Management)
- Alex MacLean - development intern - Roosevelt High School (Cal Poly CS, Dropbox intern, now NVIDIA)
- Surya Mani - development intern - Hamilton College (Talus Bio, now Broad Institute)
- Ali Marsh - development intern - MIT (now Tern)
- Nate Mercer-Garber - development intern - Northeastern University
- Rohith Mondavilli - web development intern - Dartmouth College (Apple intern, Facebook intern, now Rippling)
- Sophie Pallanck - development intern - Western Washington University (now Amazon)
- Tobias Rohde - development intern - UW (AI2 Incubator intern, now Amazon)
- Henry Sanford - development intern - UW (Regeneron intern, now Vinogradova lab at Rockefeller University)
- Pradyoth Vemulapati - development intern - UW (OpenMarket, now Uber)