|
Showing: limited to 100 requests
|
| Calibration Curve for different analytes |
| (4 responses) |
sophia_foehr |
2023-06-07 06:06 |
|
Hi,
Sorry for bothering again, we have 11 different acids and aim to have internal standards for each one of them. I was wondering, whether it would be possible, to have different analyte concentration for each of the acids in one document? Right now if we look at the calibration curve, it looks funny/wrong for some of the acids, due to the different values. Is there a way see for each acid the right concentration that we actually spike in?
Thanks very much,
Best Sophia
|
| view request |
| Multiple peaks view |
| (1 response) |
a majcher |
2025-11-04 02:34 |
|
Dear Skyline team,
First of all,
Thank you very much for making skyline great! Its fantastic and I am adapting more and more workflows in Skyline.
I have an issue when I am trying to overlay two peaks (DDA mode). The chromatograms are then not displayed correctly and are distorted.
Is there a way how to fix it? Am I doing something wrong?
I am sending corresponding chromatograms attached.
Best,
Adam
|
 Skyline.pdf Skyline.pdf |
| view request |
| Skyline to calculate LOD/LOQ from PRM data |
| (1 response) |
floriana |
2025-11-03 03:43 |
|
Hi Skyline team,
We are using Skyline to analyze PRM data to build a peptide calibration curve and calculate LOD and LOQ. We spiked a constant amount of heavy into serially diluted light peptide. We also acquired two blanks in which only the heavy peptide is present at the same amount as the serially diluted samples. Our quantification settings are as follows: Regression fit = Linear in log scale, MS2 level, LOD = blank + 2SD, LOQ: Max LOQ bias = 20%, Max LOQ CV =20%. We are using the ratio to heavy from the Peptide Ratio report to build calibration curves in R and calculate LOD and LOQ using blank and regression methods. The LOD/LOQ values that we obtain with our script differ from those calculated by Skyline. Is there a document we can refer to that describes the steps Skyline uses to build peptide calibration curves and assess LOD/LOQ (is skyline using all fragments, are the fragments used always the same in different samples, are ratio L/H ratio calculated first for each transition and then summed, etc)? In case LOD are negative values what is the recommended approach? Many thanks for your support, Floriana
|
| view request |
| Issue with importing Waters SONAR data to Skyline |
| (1 response) |
manohar8 |
2025-10-29 23:34 |
|
Hi Skyline team,
I am unable to import Waters SONAR file as a result file into Skyline. Attached is the message which pops up when import is initiated.
Please resolve.
Thanks.
|
 error with raw file import.txt Workflow.txt error with raw file import.txt Workflow.txt |
| view request |
| Feature request: Make the output from "Copy Data" from the Full Scan viewer more R/Python friendly |
| (1 response) |
mauraisa |
2025-10-28 13:38 |
|
I am trying use the "Copy Data" feature to copy the data from the "Full Scan" viewer that appears when you click on a chromotagram.
In general I think it is really useful to extract the underlying data from the visualizations in Skyline, however I am finding the way the output is formatted difficult to understand. What I would like to do is plot the data from the scan in R, but the format makes that difficult without moving a lot of things manually. At this point I am questioning whether the formatting is a feature or a bug.
I'm pretty sure the "Copy Data" feature is simply broken for scans with ion mobility data. I've attached a csv with the output that I am seeing when copying the data from a scan from a timsTOF .d file. The columns for m/z and 1/K0 (Vs/cm^2) are repeated multiple times. It looks like the values for intensity are there but it not clear which rows they apply to. In row 3, 1/K0 (Vs/cm^2) is repeated in 57 columns.
I would think the best way to format the output would be a simple table with a single header and 3 columns: m/z, 1/K0 (Vs/cm^2), and intensity.
The first thing I tried to do was to see what the output for a 2D scan without ion mobility data looks like. I think it a bit more comprehensible but still not very R/python friendly. There are 3 separate set of headers for each ion annotation.
Again I would think the best format would be a simple table with 3 columns: m/z, intensity, annotation.
Thanks,
Aaron Maurais
|
 IMS_scan_data.csv thermo_scan_data.csv thermo_scan_data_sugested_format.csv IMS_scan_data.csv thermo_scan_data.csv thermo_scan_data_sugested_format.csv |
| view request |
| Shimadzu 8060RX lcd contains no usable data |
| (19 responses) |
Wesley Vermaelen |
2024-10-22 22:39 |
|
Hi,
I've been using Skyline to process data from our Shimadzu 8060NX for a while now and everything works well.
Recently we acquired a new Shimadzu 8060RX but for some reason when I import the results from this machine an error occurs: "The sample contains no usable data".
When I use labsolutions from Shimadzu there is clearly data in the file.
When I use SeeMS from ProteoWizard there is also no data to be seen.
Do you have any idea what is going on here?
I have included two files, one from 8060NX that works and one from the 8060RX that doesn't work. These are similar analysis.
I am very grateful for your help.
Wesley.
|
 Shimadzu8060RX.lcd Shimadzu8060NX.lcd Shimadzu8060RX.lcd Shimadzu8060NX.lcd |
| view request |
| Reinclude already excluded transition. |
| (2 responses) |
HongSang Choi |
2025-10-28 13:30 |
|
Hello,
I'm doing the PRM analysis using the skyline.
If a specific transition is not clear, we are excluding that transition. (Rt. click -> remove peak: then the peptide turns to Red X mark)
My question is,
-
if I want to reinclude a transition I've excluded, can anyone tell me how to do that?
-
When removing a specific transition, it seems that the total ratio value (in the Export-Report-Peptide ratio results, not the total ratio in the screen view) is the same whether I remove only the transition of the light peptide or whether I remove only the heavy or both the light and heavy. Is that correct?
|
 screen capture.jpg screen capture.jpg |
| view request |
| Feature request: defining peptide modification isomers |
| (1 response) |
Juan C. Rojas E. |
2025-10-28 07:26 |
|
Hello there!
Would it be possible to define an additional attribute for modifications to define them as different isomers? This is applicable for glycoproteomics, but it should also be applicable to other modification types based on some of the talks I saw in Skyline Online 2025.
In glycoproteomics, you commonly see glycopeptide structural isomers due to different arrangements of the connectivity between glycan monomers. We can resolve these chromatographically in many instances and would like to quantify them independently.
We have found a workaround for this by creating multiple entries of modifications where the only different thing is the name of the modification. Example:
H6N5S3_a
H6N5S3_b
H6N5S3_c
Here the letter suffix just indicates the elution order. This allows us to create different targets separated by the "Peptide Modified Sequence Three Letter Codes" column in the Document Grid reports.
However, we are having issues with Skyline recognizing these modification isomers when it comes to re-importing peak boundaries and defining independent entries in an iRT library since modified peptides are written with respect to modification mass.
For example for the peak boundaries case, all boundaries of the isomers are fixed to the boundaries of only one isomer after importing a "Peak Boundaries" report.
I am not sure what is the best support for this in Skyline, but we thought maybe an additional attribute written in the Skyline XML files and displayed in the GUI indicating "Isomer = TRUE/FALSE" + choosing which (e.g. user defined as "a", "b", "c", etc.) could work?
We are happy to provide some example data if it would help.
Looking forward to hearing back from you.
Sincerely,
Juan C.
|
| GlycopeptidesIsomersExample.png |
| view request |
| Possibility to unlink the integration between light and heavy |
| (1 response) |
carolin huber |
2025-10-28 05:40 |
|
Their Skyline support team,
is there a possibility to apply different integrations (min and max rt for integration) for light and heavy without changing the transition list, that the quantification is performed with a surrogate?
Our department uses Skyline a lot for quantification, however, often different internal standards are used that require a different integration. We struggle with the use of the surrogate option, as this does not allow us a layout, where the peak can be shown in the same window together with the internal standard.
Thank you very much for your help,
Greetings from Zürich
|
| view request |
| ion mobility information missing in result export |
| (3 responses) |
haiyan |
2025-10-27 06:35 |
|
Hi Nick:
Thanks for your reply. I can see ion mobility information in library explorer. But when I export results, no matter what ion mobility items I choose, the value is always empty. I attached an example here.
I uploaded the file to the dropbox you mentioned. The name is "fragpipe_skylib-EGFR-DIA.sky.zip". Please have a look.
By the way, when I did search with MSfragger, there is an option to create a skyline document. So the skyline document was created in Fragpipe.
Haiyan
|
| view request |
| Skyline Small Molecules - Agilent NLS data import failing |
| (7 responses) |
mariacristina petrella |
2025-10-08 07:34 |
|
Dear Skyline team,
I am trying to import nucleosides NLS data from Agilent in Skyline, but Skyline gives me an error message Failed importing results file. The sample contains no usable data. It seems that the spectra is not read by ProteoWizard. I cannot upload here the data since they are not yet published, but I can send it to you if you need them to check, or look for a published equivalent to post here.
Thank you for any help you can provide!
Best regards,
Cristina
|
| view request |
| import of parquet spectral library from DIANN 2.0 and above into skyline |
| (20 responses) |
dkueltz |
2025-04-15 22:52 |
|
Since version 2.0 DIA-NN no longer generates speclib files for its spectral libraries but instead only parquet files. I used to be able to import the speclib libraries into Skyline but since they are no longer generated by DIA-NN I wonder how I can import the parquet libraries into Skyline. The direct link from DIA-NN to Skyline (Skyline button in DIA-NN) never worked for me but importing the DIA-NN generated spectral libraries worked well until DIA-NN version 2.0 when the speclib libraries are no longer generated. The DIA-NN developers told me that Skyline will soon have parquet import capability - is this already a function that is available in Skyline Daily? If, so where can I find it?
Thanks much,
Dietmar
|
| view request |
| Spectral library generation - is it needed |
| (2 responses) |
mvm35 |
2025-10-21 06:03 |
|
Dear Skyline support,
according to some opinions, in silico spectral library generation is good enough and experimentally generated spectral libraries are no longer needed.
Do you agree?
Mehul
|
| view request |
| No Collision Energy as deafult for isolation list export for Bruker timsTOF (+ request for a bonus feature) |
|
Daniel Fochtman |
2025-10-21 07:56 |
|
Dear Skyline team,
As the title of this request suggests, the default value that is set by Skyline for Collision Energy in an isolation list (“Export – Isolation List”) for Bruker timsTOF equals zero (i.e. 0eV). I believe that this behavior is unintended, since the timsControl software used for method generation for Bruker instruments interprets this value literally, meaning that there will be no fragmentation (though 'useless' MS2 scan will be present in the data file). To use appropriate collision energy as intended by Bruker, this CE value should default to a "-" hyphen symbol (ASCII 45). I have forgotten a few times by now to change this value in a spreadsheet manually, resulting in some wasted samples…
Since I'm already writing a post here, I would like to ask for a feature for timsTOF in Skyline specifically. It would be immensely useful if the "Retention Time - Scheduling" window would show the number of precursors per TIMS ramp and the separation of targets in RT and mobility dimensions, when ion mobility separation is utilized as selected by values in Transition Settings > Ion Mobility (I have attached a screenshot of this exact feature from Bruker software). Since ion mobility separation has an impact on the number of precursors that can be isolated and measured in a prmPASEF method, this would be much informative than a “Concurrent Precursor” plot. To illustrate for example, assuming two methods with the same number of Concurrent Precursors measured in unit time, their measurement will result in more points per chromatographic peak if the mobility of precursors is dissimilar and less points per peak if mobility of these precursors is nearly the same. That’s why this would be really helpful.
Thank you for your help in advance!
|
| example_scheduling_window.png |
| view request |
| Skyline Small Molecules - Relative Abundace for library transitions |
| (2 responses) |
guadalupe espadas |
2025-10-20 06:24 |
|
Dear Skyline team,
I'm creating libraries for nucleosides compound with different collision energies with Skyline. Could be nice to have the relative abundance information of the library and ideally have the option to remove noisy transitions, for example transition with Relative Abundance less than 5%.
Attached you’ll find an Skyline document with some nucleosides and the corresponding library, if you need something else just tell us.
Best regards,
Guadalupe
|
 Library_Exploris_DIA80_Mix1.sky.zip Library_Exploris_DIA80_Mix1.sky.zip |
| view request |
| Importing DIANN library |
| (4 responses) |
anirudhkashyap511 |
2025-08-29 10:10 |
|
Hi Skyline Team,
When I try to import the Skyline library, I get an error saying that the .parquet file is missing the column Global.Q.Value. I’ve attached a screenshot of the error message. Could you help me figure out what I might be doing wrong?
I have also attached the parquet file and the lib file. I used DIANN 1.9.1
|
| Chem2Samples.parquet |
| view request |
| Error uploading PRM .raw file |
| (2 responses) |
msalie41658 |
2025-10-20 09:31 |
|
Hello, I am having an issue uploading a .raw file containing PRM data to Skyline. The error states "A device attached to the system is not functioning. :iostream error". Can anyone give me a clue as to what this might mean?
|
| Error.png |
| view request |
| Using average mass for intact proteins |
| (1 response) |
soren |
2025-10-16 11:14 |
|
Dear Skyline Support Team,
I am trying to build a quantitation workflow for intact proteins, where I wish to obtain XICs for my "naked" protein, and the protein with a glycosylation.
My protein has an average mass of 76132 Da, and the most abundant charge states are between 50-55+. Following some other helpful advice, I defined my protein as a long peptide and created a modified and nonmodified version. My issue is, that I record the data with a Q-TOF and since I do not have isotopic resolution, I need to use the average mass to get Skyline to pick the correct peaks. However, when I navigate to Settings>Transition settings>Prediction and switch 'Precursor mass' to Average I am met with the following message: "High resolution MS1 filtering requires use of monoisotopic precursor masses". Does anybody know how to select average masses for this type of analysis? Thank for your help! Version is Skyline-daily (64-bit) 25.1.1.206
Best
Soren
|
| view request |
| Automation for peak picking for high sample number |
| (1 response) |
orsolya bilkei |
2025-10-15 23:39 |
|
Hello,
I am writing to ask whether there is a plug-in or other option that enables more reliable automated peak picking in Skyline for large datasets.
In our workflows, Skyline frequently selects the highest-intensity peak, which is often incorrect. Even when I manually select the correct peak and apply it to all subsequent the alignment remains inaccurate for a substantial number of cases. This is particularly challenging in degradation assays, where we need Skyline to prioritize peak selection at the expected retention time—even when the signal is weak or largely background. At present, this does not appear to be feasible with the available settings.
If there are recommended approaches, plug-ins, or configuration strategies that would improve automated peak selection and retention time adherence at scale, I would greatly appreciate your guidance. Reviewing hundreds of samples across multiple peptides individually is highly time-consuming, and a more robust one-click solution would significantly improve efficiency.
Thank you for your assistance.
|
| view request |
| Custom Collision Energy Equations defaulting to precursor m/z instead of intercept |
| (7 responses) |
Chris Ashwood |
2025-10-10 07:51 |
|
Dear Skyline team,
I hope you're doing well. I've previously performed a small molecule collision energy equation optimisation on an analyte in an older version of Skyline but now that I've tried to re-export the optimised CE values, they have used the precursor m/z as the intercept instead of the specified intercept in the equation itself (e.g. instead of the CE being 50, it's now 909.3 for my 909.3 m/z precursor). No matter what the intercept is, it defaults to the precursor m/z instead of the specified intercept. Maybe something has changed in how this is calculated?
This is the case in both standard Skyline (Skyline (64-bit) 25.1.0.237 (519d29babc)) and Skyline-daily (Skyline-daily (64-bit) 25.1.1.271 (67f3e15e7)). I've attached the Skyline document, and I'm using the custom CE equation of "Flat" as defined in the document.
Cheers,
Chris
|
| CF_CEOpt_OptimizationLib_2025.sky.zip |
| view request |
| Installation of Skyline in MacOS |
| (1 response) |
sismayilova22 |
2025-10-08 05:38 |
|
Hello,
I couldn't download Skyline software on MacOS. If there is a link for MacOS, can you please send?
Thank you in advance.
Best regards,
Sudaba Ismayilova.
|
| view request |
| Surrogate standard area display |
| (2 responses) |
zahall |
2025-09-05 08:16 |
|
Hello,
I am hoping to figure out the best column to add to my document grid to display the value of the surrogate standard area used in normalization for each replicate. If there is a simple way to display this unique value for each replicate that would be great.
Thank you,
Zach
|
| view request |
| Unable to import results files from waters_connect due to authentication error. |
| (10 responses) |
Matthew Daly |
2025-10-03 01:37 |
|
Hello,
I am attempting to import data from waters_connect using the remote account. I have set up the remote account and the connection tests OK. Then, when I click File - > Import -> Results -> Remote account, I can see the folders and data files within the waters_connect database. However, when I try to import/open those files I receive an authentication error (attached). Could you tell me please if there is a resolution for this or if there is a setting I am missing?
Thanks
|
| SkylineAuthenticationError.PNG SkylineRemoteAccount.PNG |
| view request |
| viewing iRT alignment bug in -daily |
| (6 responses) |
Will Thompson |
2025-09-29 13:19 |
|
Dear Skyline Team
Viewing the retention times as the alignment scores seems not to work in the latest -daily release. To reproduce:
- Open any skyline document with an iRT predictor enabled.
- Right-click in the View/Retention times (or chromatogram) view and select "Show [iRT predictor] Score"
Expected result:
The retention times (or chromatogram) is plotted in iRT dimension.
Observed result:
Skyline shows no data on the [iRT Predictor] Score version of the Replicate Comparison retention times plot, and does not update the chromatogram view to show indexed time (still just shows retention time)
Cheers
Will
|
| view request |
| Why does importing skyline from mzml format fail? How to solve it |
| (4 responses) |
z15839328872 |
2025-07-22 19:54 |
|
Hello,dear Skyline team
Since I targeted to do 4D before, so the generation of offline data is mzml, many attempts have failed, the attachment is my screenshot and data, I hope to solve this problem, thank you very much。
Zhou Yanan
|
| skyline1.png skyline2.png |
| view request |
| Unable to import Thermo Stellar SRM .raw: “chromatogram information unavailable” error |
| (3 responses) |
busra demirtas |
2025-09-29 08:43 |
|
Dear Skyline support team,
We recently equiped with a Thermo Stellar triple-quadrupole LC-MS instrument and ran our first batch (SRM) this week. The ".raw" files open normally in Thermo FreeStyle and chromatograms are visible there, but when importing the same .raw files into Skyline (latest version) we get “chromatogram information unavailable” and no XICs/SRM traces appear.
What we have already tried is conversion of .raww to mzML with MSConvert, but MS convert noted that input contains only chromatogram data. Also, tried to convert it to .mzML with ThermoRawFileParser v1.5.0-alpha.2 (with .NET8); conversion completed but import to Skyline failed with "invalid cvParam accession (1003409)" and conversion log contains many WARN Spectrum #... has no m/z data lines.
Verified transitions/polarity/RT settings, method is a standard SRM and worked previously on Waters TQ Absolute (with same transition list on Skyline).
The mzML contains a cvParam line MS:1003409 (name:"Stellar") that appears to be a new PSI-MS cv entry. It seems the Stellar vendor chromatogram stream/new cvParam is not being interpreted by our conversion tools or by Skyline’s reader, so, Skyline ends up with no usable chromatogram traces.
Does Skyline currently support Thermo Stellar SRM vendor chromatogram stream (MS:1003409) ? If yes, which Skyline build and which Thermo RawFileReader / RawFileReader SDK / ThermoRawFileParser version do you recommend for correct import?
We can provide a small example .raw, the mzML produced by ThermoRawFileParser, or the Skyline audit log.
Please advise which one would be useful.
Thanks in advance, any guidance will be very helpful.
My email address:
busra.demirtas@istinye.edu.tr
Best regards,
Büşra
|
| Ekran görüntüsü 2025-09-26 144515.png |
| view request |
| Issue with Calibration Curve in Skyline |
| (1 response) |
angela peralbo |
2025-09-29 01:01 |
|
Dear Skyline Team,
I am experiencing an issue with the calibration curve in Skyline. It seems that the program is using peak area values instead of the total area when generating the calibration curve. As a result, the regression line is counterintuitive: the signal decreases as the concentration of the standard increases, even though the total area is actually larger for higher concentrations.
Could you please confirm whether this behavior is expected, or if there is a setting I should adjust to ensure the calibration curve is based on total area values?
Thank you very much for your support.
Best regards,
|
| view request |
| SkylineRunner Command? |
| (22 responses) |
lubwen |
2025-09-16 16:46 |
|
Dear Skyline Team,
I am wondering whether there is a SkylineRunner command to set the RT boundaries for a peptide across all my 96 runs?
Basically I am asking for a CLI version of this right click UI option of "Apply Peak to All", as shown in the attached screenshot.
(By supplying my own low-RT and high-RT boundaries to the CLI)
Thanks a lot. Kind regards,
Bingwen
|
| Picture3.png |
| view request |
| how to export spectronaut generated spectral library in to skyline |
| (1 response) |
gupta |
2025-09-26 05:31 |
|
Hey people,
I know there are a few posts regarding some suggestions and ideas to export spectronaut generated spectral library in to skyline. Briefly, I generated DIA dataset using samples where heavy labeled peptides (Lys8 or Arg 10) from EGFR protein were spiked-in in Hela peptides (Pierce Hela digests) on Bruker's timsTOF machine (30SPD/44min). I used spectronaut 20 to generate spectral library for me (attached here in .csv format) and I would like to like to import this library into skyline. I am unable to find the best and easy way to do so as Skyline errors out with the message "score types not loaded" (attached). It would be great if someone has experience with this and help me to import that library for downstream analysis
Thank you,
Rajat
|
| spike-in library_EGFR_skyline.csv Skyline Error Message.txt |
| view request |
| Peptide Import Cutoff Score |
| (3 responses) |
pdev |
2025-09-25 12:09 |
|
When trying to do the peptide import for the tutorial, the box with "cutoff score" is not showing up on my screen, so I am unable to import the peptides and continue the tutorial. I was wondering how to get that box to show up.
|
| Screenshot 2025-09-25 150842.png |
| view request |
| Difference between "Normalise to Total Ion Current" and Normalise to "Total" |
| (2 responses) |
s subramaniam |
2025-09-18 07:20 |
|
Hello,
Please could you explain the difference between "Normalise to Total Ion Current" and Normalise to "Total" when viewing Peak Areas in replicate comparison view.
Couldn't seem to find this in your manual.
Many thanks!
Shaan
|
| view request |
| Application error when importing raw data |
| (3 responses) |
seabiscuit |
2025-09-17 18:20 |
|
Hi, I recently updated my Skyline to V25.1. It can open my old project or create new project with no issue. But when I tried to import raw MS data (from Thermo Quantiva MS). I got an application error and the program quits. Please see the attachment for the screenshot of the error message.
Thank you.
|
| application_error.png |
| view request |
| GC MS Agilent import |
| (28 responses) |
daria makeeva |
2024-11-25 07:48 |
|
Hello,
I am trying to set up Skyline for the analysis of GC-MS data from an Agilent single quadrupole instrument. I followed Pawel Sadowski's protocol for Shimadzu and also tried adapting the guidance provided here: https://skyline.ms/announcements/home/support/thread.view?rowId=43600. However, no matter what changes I make to the transition list, the files do not process correctly. Skyline identifies only the precursor ion and cannot detect the fragments.
That said, when I manually click on the chromatogram, I can see that the MS/MS spectra have been recorded and are readable from the files.
I have attached the Skyline file, the GC-MS data file, and the transition list to make it easier to review the data.
Thank you very much for your help.
Best regards,
Daria
|
| GC-MS_Skyline.zip |
| view request |
| eDR Full Scan Data |
| (3 responses) |
wes rogers |
2025-07-02 13:10 |
|
Hi Skyline team,
I am trying to extract MS1 information from an enhanced dynamic range (eDR) full scan on the Orbitrap Excedion Pro. This scan is multiplexed at the MS1 level and combines 2 Orbitrap subscans to form a single full scan. The ion packets have variable injection times. I am getting the following error when trying to import the data…
[SpectrumList_Thermo::spectrum()] Error retrieving spectrum "controllerType=0 controllerNumber=1 scan=1": [SpectrumList_Thermo::getMultiFillTImes()] Unexpected fill time format: IT=25;35;22;4;3.6;0.21;IT=28;28;28;7.2;0.96;0.72
I am using the latest version of Skyline daily (v. 25.1.1.174). Is this type of data, eDR full scan, data supported yet?
I will upload the .raw file. Please let me know if you need any more information. Thanks!
Thank you,
Wes
|
| view request |
| Number of significant figures exported via command line reports |
|
sstoychev23513 |
2025-09-16 21:52 |
|
Hi Skyline team,
Is it possible to export metrics such as FWHM as the full number rather than two significant figures when using the Skyline command line?
Also, is it possible to export FWHM, FWB and RT in seconds rather than minutes.
Thanks
|
| view request |
| Transitions in PRM PASEF |
| (6 responses) |
susmitaghosh191996 |
2025-09-11 04:55 |
|
Dear Skyline team,
I am trying to create a PRM PASEF method. For this, first i measured some samples on DDA and searched the raw file in Fragpipe. I uploaded that file to create library in Skyline and used the same result files to create mobility library . Now I want to filter the peptides, I saw most of them just have precursors ions no transition ions even though I have selected p, y, b ions in the settings.
Can you please have a look and let me know if I have done something wrong.
Best,
Susmita
|
| view request |
| Setting working dir |
| (1 response) |
niklas40639 |
2025-09-12 08:39 |
|
Hello,
Given that the software requires you to save a file before importing data, there should always be enough information to automatically set the working directory to whatever dir the file is saved in. I don't know how much effort this would require, but it would be very welcome. As is, every time I'm ready to export a report, the wd is set to the last directory I saved a report in, which is almost never where I want the file to be by default.
Thanks for you consideration!
Nik
|
| view request |
| Transitions in PRM PASEF |
|
susmitaghosh191996 |
2025-09-11 04:45 |
|
Dear Skyline team,
I am trying to create a PRM PASEF method. For this, first i measured some samples on DDA and searched the raw file in Fragpipe. I uploaded that file to create library in Skyline and used the same result files to create mobility library . Now I want to filter the peptides, I saw most of them just have precursors ions no transition ions even though I have selected p, y, b ions in the settings.
Can you please have a look and let me know if I have done something wrong.
Best,
Susmita
|
| view request |
| Pick integration with relative retention time |
| (2 responses) |
junyiqian |
2025-09-10 19:52 |
|
Hi all,
We are conducting targeted metabolomics analyses and have observed some expected retention time shifts in our data. I was wondering if Skyline includes functionality that utilizes relative retention time to assist with automated peak detection?
Thank you for your time and assistance.
Chloe
|
| view request |
| Unable to install Skyline |
| (3 responses) |
hudda khan63 |
2025-09-09 20:07 |
|
Hello,
I am trying to install the 64-bit Skyline setup, but I'm getting the "An error has occurred writing to the hard disk" message. Could you possibly help fix this issue? I'm using a 64-bit operating system. There is enough space on the hard disk (C), and write permissions are enabled. I have tried running it as an administrator, but it still gives the same error.
|
| error msg.jpg |
| view request |
| 安装时显示磁盘空间不足,应该需要多大的空间?怎么处理? |
|
656053951 |
2025-09-08 19:17 |
|
|
|
| view request |
| Can employee in R&D of a commercial company use Skyline? |
| (6 responses) |
george wang cal |
2019-09-03 15:27 |
|
Hello,
I could not find anywhere else to pose this question so if there is a person I should contact please let me know. I am an employee at a commercial biotech company and our team wishes to use Skyline as part of our R&D for proteomics development. Our legal team found two components that cannot be used commercially, thus right now it appears we can't legally use Skyline. These are part of the Apache license:
- Thermo-Scientific MSFileReader Library
- Waters Raw Data Access Component Library
I wanted to ask if there is any way to remove these components and use the remaining components of the Apache license?
Thanks,
George
|
| view request |
| Chromatogram Unavailable for TAG Features in SkylineCmd vs GUI |
| (9 responses) |
Harrison |
2025-09-01 02:15 |
|
Hi,
I’m currently setting up an automated pipeline for a small molecule MRM method using Skyline. I’ve encountered an issue where certain features—most notably TAGs—are reported as "chromatogram information unavailable" when processed via skylinecmd.exe, despite being clearly available when processed through the Skyline GUI. The majority of other feature classes are perfectly okay; it's almost as if the command line interface cuts the features after a certain amount.
To troubleshoot, I’ve ensured that:
The .mzML files used are identical.
The document settings, including transition settings and m/z tolerance thresholds, are matched between both workflows.
Run both workflows multiple times.
The transition list imports are consistent.
Validated the missing TAGs in external data
Despite these checks, the command-line run fails to detect chromatograms that are evidently visible in the GUI. Have you experienced anything similar, or could you provide guidance on resolving this discrepancy?
The .sky files used in both runs are attached for review.
Kind regards,
Harrison
|
| 2025-09-01_STXp012_SkylineGUI.sky 2025-09-01_STXp012_SkylineGUI.skyd 2025-09-01_STXp012_SkylineCmd.sky 2025-09-01_STXp012_SkylineCmd.skyd |
| view request |
| importing target and decoy libraries for crosslinked peptides |
| (3 responses) |
anzuki |
2025-08-14 08:56 |
|
Dear Skyline-Team,
I would like to analyse crosslinked peptides for quantitation using a spectral library that already contains all the necessary information, including decoy fragments. I have tried this using the assay library import. Unfortunately, I failed to import the csv file because the peptide mass difference was too much from the calculated one by the sequence. That would be expected since crosslinked peptides are larger (two peptides is one sequence) and the automated calculation would naturally fail. But how can I fix this issue? Is there a way to still import my library? Maybe by converting the sequence to strings like that: GQKNSR-GQKNSR-[PhoX@3,3]
Or is there another way to do it?
Thank you very much for your help.
Best wishes,
Franze
|
 example_input_file.xlsx example_input_file.xlsx |
| view request |
| tSIM IQ-X wavy Chromatogram |
| (4 responses) |
gerrit hermann |
2025-08-25 04:53 |
|
To reduce storage needs and speed up processing, we acquired data for seven small molecules in tSIM on an Orbitrap IQ-X.
Settings:
Multiplexing: Off
Isolation window: 1.2 m/z
Orbitrap resolution: 120,000
Data type: Profile
Polarity: Negative ionization
Two compounds are isomers, so we entered five precursor m/z values in the table.
When I load the data into Skyline (25.1.0.142), the extracted chromatograms look wavy compared with Thermo FreeStyle (see attached). I’ve spent several hours trying different filter options in Skyline and MSConvert but haven’t been able to fix it.
Has anyone run into this and found a solution?
Thanks in advance—cheers,
Gerrit Hermann
|
| Screenshot 2025-08-25 134356.png |
| view request |
| DIA NN Paquet lib issue |
|
haiyan |
2025-08-30 13:38 |
|
Hi
I am using DIA NN 2.0 to search a set of files and generated a file called Human-Serum.parquet.skyline.speclib, I also put the report file into the same folder, called Human-serum-report.parquet. Because from DIA NN 1.18. I know the report should have similar name to the speclib file. But when I tried to import to Skyline, I got an error "parquet file does not have a column called Global Q value). I was wondering if somebody can help me with this? I have not been able to import any spectral lib since I used DIANN 2.0 and everytime is because of the same error although I certainly can find Global Q value column myself.
|
| Skyline-DIANN-lib issue.png |
| view request |
| Import transition list from MRM assay |
| (6 responses) |
c frampas |
2025-08-27 04:06 |
|
Dear Skyline team,
I appreciate that there is probably a post/tutorial that could help me but I could not find one.
I have created a MRM method that contains 120 transitions, I have 12 different peptides and each peptide has 5 transitions. I also have heavy labeled peptide as internal standards.
I have tried to import the transition list using Edit>import>transition list. In there I copied the sequence of the peptide (i.e DYSLFSYATK), added the name of the protein associated with that peptide, the precursor ion, product ion, RT, collision energy etc... Hoewever, it does not import it as it says that the modified peptide sequence has not been found. Am I doing something wrong?
Also side note, for my heavy labeled peptides (I did add the isotope modifications in the settings) how can I name them? Or can I keep the same name and have it as "heavy" in my label type?
Thank you very much for your help,
Best wishes,
Cecile
|
| view request |
| Creating Library from Stellar GPF-DIA Fragpipe analysis Fails |
| (1 response) |
maithreyan kuppusamy |
2025-08-28 04:57 |
|
Hi,
I analyzed Stellar GPF-DIA runs in fragpipe. When I tried to create the library from the Fragpipe search results it failed. I have attached the error.
One more thing I noticed - Fragpie search of GPF-DIA with and without adaptiveRT results in very different ID numbers - I do not know why.
Thanks,
Maithy
|
| fragpipe_import_error.txt |
| view request |
| Altis and method exporting |
| (1 response) |
qin fu |
2025-08-27 10:37 |
|
Dear Skyline Team,
When generating a method for an Altis (Thermo) instrument in Skyline, which instrument type should I select: "Thermo" or "Thermo TSQ"? For future reference, what is the difference between these two options?
Thank you,
Qin Fu
|
| view request |
| Peptide Import DDA library from Fragpipe Spectrum id format and file id |
| (8 responses) |
naomi osullivan33127 |
2025-07-02 06:30 |
|
Dear Skyline team,
I am trying to import peptide search results from Fragpipe outputs but am encountering a format mismatch error between files.
My results are from Fragpipe v23 and am importing into Skyline (64-bit) 25.1.0.142 (7401c644b4).
I have tried multiple times with two different files to follow the Fragpipe tutorial on importing data into Skyline. During the first step, once I select the interact files and click next, I encounter the following warning (attached 1): "[SpectrumList::find] mismatch between spectrum id format of the file (scan=1) and the looked up id (controllerType=0 controllerNumber=1 scan=726)"
This warning seems to be there for every spectrum (attached 2) and thus nothing is imported into the Skyline document. If I click more info, the first line is "System.IO.IOException: WARNING: Could not find native id or title 'controllerType=0 controllerNumber=1 scan=759' in ../250128_Hela_100ng_DDA_3ms_R1_uncalibrated.mzML."
Based on the comments in the submission 'opening.d files on skyline' https://skyline.ms/announcements/home/support/thread.view?entityId=e28a2047-ead0-103d-b4e5-22f535560118&_docid=thread%3Ae28a2047-ead0-103d-b4e5-22f535560118 containing similar mismatch issue discussed in the comments, I tried moving either the raw, uncalibrated mzml or mzml into the folder but all produce the same error.
Is this a file formatting issue from Fragpipe or a Skyline issue?
Thanks for you work,
Best,
Naomi O'Sullivan
|
| Building spectral search library error 2.PNG Building spectral search library error 1.PNG |
| view request |
| PDResult import error |
| (10 responses) |
andrew williamson |
2025-08-15 05:47 |
|
Hello,
I am attempting to import a PDResult file generated from analysing Astral DIA files. I get the following error message:
---------------------------
Skyline
---------------------------
ERROR: no such table: MassSpectrumItems
Command-line: C:\Users\andrew.williamson\AppData\Local\Apps\2.0\TK8TBECA.7R5\5E0Q6O8J.JE3\skyl..tion_9286511f3362df93_0019.0001_31a2f7d2aa6cc5be\BlibBuild -s -A -H -o -c 0.95 -i MCF7_Essen_AJKW -S "C:\Temp raw file to analyse\Essen\Skyline_MCF7_IonOpticks_MKU_DIANN_Run.sky\MCF7_Essen_AJKW.redundant202508151237.stdin.txt" "C:\Temp raw file to analyse\Essen\Skyline_MCF7_IonOpticks_MKU_DIANN_Run.sky\MCF7_Essen_AJKW.redundant.blib"
Working directory: C:\Temp raw file to analyse\Essen\Skyline_MCF7_IonOpticks_MKU_DIANN_Run.sky
Exit code: 1
---------------------------
OK More Info
---------------------------
Skyline (64-bit) 25.1.0.142 (7401c644b4)
System.IO.IOException: ERROR: no such table: MassSpectrumItems
Command-line: C:\Users\andrew.williamson\AppData\Local\Apps\2.0\TK8TBECA.7R5\5E0Q6O8J.JE3\skyl..tion_9286511f3362df93_0019.0001_31a2f7d2aa6cc5be\BlibBuild -s -A -H -o -c 0.95 -i MCF7_Essen_AJKW -S "C:\Temp raw file to analyse\Essen\Skyline_MCF7_IonOpticks_MKU_DIANN_Run.sky\MCF7_Essen_AJKW.redundant202508151237.stdin.txt" "C:\Temp raw file to analyse\Essen\Skyline_MCF7_IonOpticks_MKU_DIANN_Run.sky\MCF7_Essen_AJKW.redundant.blib"
Working directory: C:\Temp raw file to analyse\Essen\Skyline_MCF7_IonOpticks_MKU_DIANN_Run.sky
Exit code: 1 ---> System.IO.IOException: ERROR: no such table: MassSpectrumItems
Command-line: C:\Users\andrew.williamson\AppData\Local\Apps\2.0\TK8TBECA.7R5\5E0Q6O8J.JE3\skyl..tion_9286511f3362df93_0019.0001_31a2f7d2aa6cc5be\BlibBuild -s -A -H -o -c 0.95 -i MCF7_Essen_AJKW -S "C:\Temp raw file to analyse\Essen\Skyline_MCF7_IonOpticks_MKU_DIANN_Run.sky\MCF7_Essen_AJKW.redundant202508151237.stdin.txt" "C:\Temp raw file to analyse\Essen\Skyline_MCF7_IonOpticks_MKU_DIANN_Run.sky\MCF7_Essen_AJKW.redundant.blib"
Working directory: C:\Temp raw file to analyse\Essen\Skyline_MCF7_IonOpticks_MKU_DIANN_Run.sky
Exit code: 1
Output:
Reading results from 20250709_Stellar_colab_Test_Sample1_400ng-(3).pdResult.
ERROR: no such table: MassSpectrumItems
100%
---> System.IO.IOException: ERROR: no such table: MassSpectrumItems
Command-line: C:\Users\andrew.williamson\AppData\Local\Apps\2.0\TK8TBECA.7R5\5E0Q6O8J.JE3\skyl..tion_9286511f3362df93_0019.0001_31a2f7d2aa6cc5be\BlibBuild -s -A -H -o -c 0.95 -i MCF7_Essen_AJKW -S "C:\Temp raw file to analyse\Essen\Skyline_MCF7_IonOpticks_MKU_DIANN_Run.sky\MCF7_Essen_AJKW.redundant202508151237.stdin.txt" "C:\Temp raw file to analyse\Essen\Skyline_MCF7_IonOpticks_MKU_DIANN_Run.sky\MCF7_Essen_AJKW.redundant.blib"
Working directory: C:\Temp raw file to analyse\Essen\Skyline_MCF7_IonOpticks_MKU_DIANN_Run.sky
Exit code: 1
at pwiz.Common.SystemUtil.ProcessRunner.Run(ProcessStartInfo psi, String stdin, IProgressMonitor progress, IProgressStatus& status, TextWriter writer, ProcessPriorityClass priorityClass, Boolean forceTempfilesCleanup, Func`3 outputAndExitCodeAreGoodFunc, Boolean updateProgressPercentage) in C:\proj\skyline_25_1\pwiz_tools\Shared\CommonUtil\SystemUtil\ProcessRunner.cs:line 206
--- End of inner exception stack trace ---
--- End of inner exception stack trace ---
at pwiz.Common.SystemUtil.ProcessRunner.ThrowExceptionWithOutput(Exception exception, String output) in C:\proj\skyline_25_1\pwiz_tools\Shared\CommonUtil\SystemUtil\ProcessRunner.cs:line 266
at pwiz.Common.SystemUtil.ProcessRunner.Run(ProcessStartInfo psi, String stdin, IProgressMonitor progress, IProgressStatus& status, TextWriter writer, ProcessPriorityClass priorityClass, Boolean forceTempfilesCleanup, Func`3 outputAndExitCodeAreGoodFunc, Boolean updateProgressPercentage) in C:\proj\skyline_25_1\pwiz_tools\Shared\CommonUtil\SystemUtil\ProcessRunner.cs:line 248
at pwiz.BiblioSpec.BlibBuild.BuildLibrary(LibraryBuildAction libraryBuildAction, IProgressMonitor progressMonitor, IProgressStatus& status, String& commandArgs, String& messageLog, String[]& ambiguous) in C:\proj\skyline_25_1\pwiz_tools\Shared\BiblioSpec\BlibBuild.cs:line 493
at pwiz.Skyline.Model.Lib.BiblioSpecLiteBuilder.BuildLibrary(IProgressMonitor progress) in C:\proj\skyline_25_1\pwiz_tools\Skyline\Model\Lib\BiblioSpecLiteBuilder.cs:line 152
---------------------------
Any help would be very much appreciated.
Best wishes
Andrew
PS I have uploaded the PDResult file
|
| view request |
| Unable to view the chromatogram on the results imported |
| (1 response) |
v veerappan |
2025-08-25 21:57 |
|
I am a PhD student at the University of Queensland, Brisbane. I am working with Phospholipids for my PhD study, and I uploaded the Wiff files from ScieX-Analyst software for analysing my results. I am unable to view the individual chromatogram of all the transitions that I had imported into Skyline. I cannot access the results from the software anymore.
Another issue was that I can't upload some of my transitions list as it was popping errors.
|
| view request |
| 为什么我安装不上这个软件啊 |
| (1 response) |
625276408 |
2025-08-23 00:41 |
|
下载的很慢,然后下着下着没影了,说是什么有问题,就继续重新下载,陷入循环!
|
| view request |
| Trying to export method into MassLynx Xevo TQ-Absolute method with error |
| (1 response) |
Susan Abbatiello |
2025-08-21 18:49 |
|
It's an unscheduled method with 294 transitions. Here is the message upon trying to export to a template method:
---------------------------
Skyline-daily
---------------------------
An error occurred attempting to export.
ERROR: Error parsing method template.
Command-line: Method\Waters\BuildWatersMethod -w 6.4 -m "C:\MassLynx\Default.pro\Acqudb\200SPD_Template.exp" "C:\MassLynx\Default.pro\Acqudb\1e0tu2fg.aa0\transitions.txt"
Working directory: C:\MassLynx\Default.pro\Acqudb\
Exit code: -1
---------------------------
OK More Info
---------------------------
Skyline-daily (64-bit) 25.1.1.206 (2ad5a87e4)
System.IO.IOException: ERROR: Error parsing method template.
Command-line: Method\Waters\BuildWatersMethod -w 6.4 -m "C:\MassLynx\Default.pro\Acqudb\200SPD_Template.exp" "C:\MassLynx\Default.pro\Acqudb\1e0tu2fg.aa0\transitions.txt"
Working directory: C:\MassLynx\Default.pro\Acqudb\
Exit code: -1 ---> System.IO.IOException: ERROR: Error parsing method template.
Command-line: Method\Waters\BuildWatersMethod -w 6.4 -m "C:\MassLynx\Default.pro\Acqudb\200SPD_Template.exp" "C:\MassLynx\Default.pro\Acqudb\1e0tu2fg.aa0\transitions.txt"
Working directory: C:\MassLynx\Default.pro\Acqudb\
Exit code: -1
Output:
MESSAGE: Exporting method 200SPD_PhosB_294trs_v01.exp
Void StringToNumber(System.String, System.Globalization.NumberStyles, NumberBuffer ByRef, System.Globalization.NumberFormatInfo, Boolean) (Exception Message='Input string was not in a correct format.') : Error parsing method template.
ERROR: Error parsing method template.
---> System.IO.IOException: ERROR: Error parsing method template.
Command-line: Method\Waters\BuildWatersMethod -w 6.4 -m "C:\MassLynx\Default.pro\Acqudb\200SPD_Template.exp" "C:\MassLynx\Default.pro\Acqudb\1e0tu2fg.aa0\transitions.txt"
Working directory: C:\MassLynx\Default.pro\Acqudb\
Exit code: -1
at pwiz.Common.SystemUtil.ProcessRunner.Run(ProcessStartInfo psi, String stdin, IProgressMonitor progress, IProgressStatus& status, TextWriter writer, ProcessPriorityClass priorityClass, Boolean forceTempfilesCleanup, Func`3 outputAndExitCodeAreGoodFunc, Boolean updateProgressPercentage) in C:\proj\pwiz\pwiz_tools\Shared\CommonUtil\SystemUtil\ProcessRunner.cs:line 234
--- End of inner exception stack trace ---
--- End of inner exception stack trace ---
at pwiz.Common.SystemUtil.ProcessRunner.ThrowExceptionWithOutput(Exception exception, String output) in C:\proj\pwiz\pwiz_tools\Shared\CommonUtil\SystemUtil\ProcessRunner.cs:line 294
at pwiz.Common.SystemUtil.ProcessRunner.Run(ProcessStartInfo psi, String stdin, IProgressMonitor progress, IProgressStatus& status, TextWriter writer, ProcessPriorityClass priorityClass, Boolean forceTempfilesCleanup, Func`3 outputAndExitCodeAreGoodFunc, Boolean updateProgressPercentage) in C:\proj\pwiz\pwiz_tools\Shared\CommonUtil\SystemUtil\ProcessRunner.cs:line 276
at pwiz.Skyline.Util.Extensions.UtilProcess.RunProcess(ProcessStartInfo psi, String stdin, String messagePrefix, IProgressMonitor progress, IProgressStatus& status) in C:\proj\pwiz\pwiz_tools\Skyline\Util\Extensions\UtilProcess.cs:line 45
at pwiz.Skyline.Model.MethodExporter.ExportMethod(String exeName, List`1 argv, String fileName, String templateName, Dictionary`2 dictTranLists, IProgressMonitor progressMonitor) in C:\proj\pwiz\pwiz_tools\Skyline\Model\Export.cs:line 5062
at pwiz.Skyline.Model.WatersMethodExporter.ExportMethod(String fileName, String templateName, IProgressMonitor progressMonitor) in C:\proj\pwiz\pwiz_tools\Skyline\Model\Export.cs:line 4925
at pwiz.Skyline.Controls.LongWaitDlg.RunWork(Action`1 performWork) in C:\proj\pwiz\pwiz_tools\Skyline\Controls\LongWaitDlg.cs:line 254
--- End of inner exception stack trace ---
at pwiz.Skyline.Util.Helpers.WrapAndThrowException(Exception x) in C:\proj\pwiz\pwiz_tools\Skyline\Util\Util.cs:line 1631
at pwiz.Skyline.Controls.LongWaitDlg.PerformWork(Control parent, Int32 delayMillis, Action`1 performWork) in C:\proj\pwiz\pwiz_tools\Skyline\Controls\LongWaitDlg.cs:line 202
at pwiz.Skyline.Controls.LongWaitDlg.PerformWork(Control parent, Int32 delayMillis, Action`1 performWork) in C:\proj\pwiz\pwiz_tools\Skyline\Controls\LongWaitDlg.cs:line 140
at pwiz.Skyline.FileUI.ExportDlgProperties.PerformLongExport(Action`1 performExport) in C:\proj\pwiz\pwiz_tools\Skyline\FileUI\ExportMethodDlg.cs:line 2530
---------------------------
|
| view request |
| Issue with Skyline v25.1.0.142 Handling MS1 Data from DDA Files |
| (1 response) |
Luisa Nieto Ramirez |
2025-08-21 09:28 |
|
Hello
I’ve been experiencing a consistent issue while trying to build a PRM method from DDA data using the latest Skyline version: 25.1.0.142 (7401c644b4). The chromatograms for my precursors are either completely empty or display an abnormal trace. Out of 13 synthetic peptides, only one might appear in a single sample, and inconsistently at that.
To troubleshoot, I tested older DDA datasets that previously worked well. Unfortunately, the same issue occurred in version 25. However, when I switched to another computer running Skyline v24.1.0.414 (5b5ea5889c), I was able to see all chromatographic peaks correctly, both for the older and newer DDA data.
It appears that version 25.1.0.142 is not properly handling MS1 data extraction from DDA files. I’m not sure what the underlying cause is, but this behavior seems specific to the latest version.
|
| view request |
| skyline25.1.0.142 does not work in scn982 |
| (2 responses) |
ryuta kobayashi |
2025-08-20 19:14 |
|
I am using skyline 25.1.0.142, and MassLynx scn982 for waters, but when I try to export the MS method, I get an error like error1.I also tried BuildWatersMethod.exe, but it failed to execute due to error 2.How should I deal with this?
|
| Error1.png Error2.png |
| view request |
| Video presentations from ASMS |
| (2 responses) |
karl fraser |
2025-08-17 21:32 |
|
Hi,
I'm trying to watch the videos from the ASMS user group meeting - can you please check the links? The videos dont load.
|
| view request |
| Targeting M+2 for large peptides |
| (2 responses) |
paul grimsrud |
2025-08-19 12:29 |
|
When working with very large peptides (~4 kDa), it seems that setting up a PRM method to isolate around the M+2 will help with signal intensity. In order to make Skyline import the chromatogram, I've added one 13C as an "Isotope Heavy" label at each termimus. In reality, however, the heavy isotopes are randomly distributed. What is the best way to handle this?
|
| view request |
| GPF Method generation for Stellar |
| (8 responses) |
maithreyan kuppusamy |
2025-06-06 00:30 |
|
Hi,
I am trying to use PRM conductor to generate the GPF method for Stellar. But I get some error (I have attached a screenshot). Could you please let me know what could be wrong here?
best,
Maithy
|
| Screenshot 2025-06-06 092908.png |
| view request |
| small molecule transition list error |
| (18 responses) |
dspiciarich |
2018-04-25 15:31 |
|
I've generated a small molecule library that I'm able to manually inport into skyline (see attachment #1). Everything seems to load correctly and I can export the transition list. However if I close the window and then try to re-import the transition list into the gui, I get an error (see 2nd attachment).
When I try to use skylinerunner I get the following error:
Error: Failed importing the file c:\skyline_test\exported_sml_molecule_translist.csv. Failed to find peptide column., line 1.
I think my .sky file is expecting proteomic data and that I need to tell it that it should expect small molecule data. Is this correct? How do you recommend proceeding?
These are actually peptides but that I want skyline to treat the transitions as small molecules because the transitions wouldn't be predicted by the molecular weight or the molecular formula.
Thank you.
|
| Screen Shot 2018-04-25 at 2.38.14 PM.png Screen Shot 2018-04-25 at 11.44.59 AM.png |
| view request |
| Unable to get peak areas at respective CE duering CE optimization of SCFAs |
| (4 responses) |
ujjalkumar das |
2025-08-13 13:33 |
|
Hi Skyline Team,
I am optimizing CE for short chain fatty acids (small molecules) and could not get peak areas for isomers (such as isobutyric acid and butyric acid). Although its separated by 0.2min chromatographically. Legend shows the differennt colors for CE but peak areas are not showing up on the peak area graph. Could you please help in this regard?
Thanks,
Ujjal
|
| SCFAmet_CE_Optmz1_08132025.skyd SCFAmet_CE_Optmz1_08132025.sky Reaction_1.raw.zip SCFAmet_CE_Optmz1_08132025.sky.view SCFAmet_CE_Optmz1_08132025.skyl |
| view request |
| **Unable to view small molecules analysed in ESI negative mode** |
| (4 responses) |
ejg29 |
2025-08-14 07:39 |
|
Hi,
I am currently analysing some small molecule data (WATERS .raw) on the Skyline software however when i import my transition list and then import the data, i am only able to view the chromatograms of the analytes run in ESI positive and not the ones run in ESI negative mode.
Please can you help.
Kind regards,
Elliot.
|
| view request |
| Carafe library generation |
| (6 responses) |
Alejandro Brenes |
2025-08-11 13:46 |
|
Trying to generate a library with carafe from a fasta file as shown in the tutorial. The report.tsv no longer exists but it can take the report.parquet file, however it seems to always fail with the following error:
Terminal modification is not supported:Ethyl of protein N-term
Not sure how to get round this nor why it appears
|
| view request |
| Processing files for histone PTM analysis using .d files |
| (1 response) |
lorenz donndorf |
2025-08-13 02:39 |
|
Dear support team,
Recently I sent trypsin-digested propionylated mouse histones for mass spectrometry using different treatments, and want to ultimately quantify if I can see changes in any/certain histone PTMs (Like H3K27me3) between my treatments. Additionally, some samples were propionylated using deuterium-labelled propionic anhydride, and the peptides should therefore have a slightly changed mass. The mass spec was run on a Bruker machine and I have DIA .d files.
After having now received these .d files, I am not entirely sure how to process them. As far as I understand, I have to create a spectral library first, and I looked into the "Skyline Targeted Method Editing" tutorial, but in the example provided there the library is not built using .d files, but instead using a prep.xml file. Checking online, I found previous questions on this support forum that were asking how to directly load .d files, but it was mentioned that SkyLine is not intended for viewing raw mass-spec data.
When checking how to make this spectral library using my .d files, I found a tutorial that used the software DIA-NN to generate the spectral libraries using the .d files and calling/running it against a fasta file of the proteins that one is interested in (In my case just histones).
Is this the correct approach, or how should I (pre-)process my .d files to be able load them in SkyLine and be able to diffentiate between histone PTMs and to quantify differences between samples?
Thank you!
|
| view request |
| Define Regression Fit by Analyte in Document Grid |
| (1 response) |
crystalpace519 |
2025-08-12 14:37 |
|
Hello - is there a way (or could there be a way) to specify regression fit (linear, quadratic, etc) in the document grid for each analyte. I have about 20 analytes and half of them quant via linear and half of them via quadratic. Currently, I've been exporting two results files with each regression fit defined in the Molecule Settings window and then selecting/filtering/merging which quantitation method I would like in R. During method development, this is extremely tedious until I know which regression fit is best for each analyte. Let me know if there is currently a better way to do this!
|
| view request |
| apply peak boundaries to all replicates |
| (2 responses) |
simon daled |
2025-08-12 05:18 |
|
Hi,
Is there an option to apply the peak boundaries of one replicate to all other replicates based on the alligned retention times?
This would be interesting for us to do the analysis of some depletion experiments. For now I have tried the synchronized integration, but it doesn't change or synchronize the peak boundaries unless you manually adjust them. I have possibly found a workaround through the export peakboundaries option and then manually changing them, but enabling this in skyline would be a great help. Unless I overlooked the option of course...
Kind regards
Simon
|
| view request |
| Using Skyline for Hybrid-DIA files |
| (1 response) |
andreas kienzle44094 |
2025-08-12 06:10 |
|
Hello,
I am working with Hybrid-DIA data acquired on an Orbitrap Exploris mass spectrometer with FAIMS. In principle, we run a DIA-analysis with an inclusion list (n = 50), which targets trigger PRM scans (similar to: https://skyline.ms/_webdav/home/software/Skyline/events/2018%20ASMS%20Course/%40files/Day_2_am_11_15_Jaffe_Hybrid%20PRM-DIA%20Assays.pdf).
The raw files contain standard MS1-overview scans (profile), DIA scans (profile) and target-triggered PRM scans (centroid).
The aim is to compare the number of identified targets from a Hybrid-DIA analysis to a standard native DIA-analysis (without an inclusion list). We use libraries from synthetic heavy labeled peptides of the 50 targets for dotp calculation and identification (threshold: dotp > 0.85).
To get a feeling for the data, we would like to split the Hybrid-DIA raw file into DIA and PRM data to check for peptide targets in both files.
We assume, we identify less targets in the pure DIA data of the Hybrid-DIA file compared to the native DIA-file, as PRM scans should be triggered instead of the DIA acquisition, thereby reducing the scan times for the DIA acquisition. Of course, we expect to detect the targets then in the respective PRM data of the Hybrid-DIA file.
I used Skyline (v23.1) for analyzing the data. As described in the following, I primarily adapted the settings for the acquisition mode (DIA or PRM) and product mass analyzer (Centroided or Orbitrap) to evaluate the data.
(I): DIA-analysis
I loaded the Hybrid-DIA raw file and the native DIA file into a Skyline Template using the setting “DIA” for acquisition mode and then tested two different settings for the product mass analyzer: Centroided or Orbitrap.
For me it was surprising to see transitions using Centroided as the product mass analyzer, especially for the native DIA file, because we record DIA MS2 scans in the profile mode.
Why does Skyline show transitions when using Centroided as the product mass analyzer, although DIA-MS2 was recorded in profile mode?
Does Skyline only show DIA scans or also PRM scans by using “DIA” for acquisition in case of Hybrid-DIA data?
(II): PRM-analysis
I used the same Skyline templates from above and switched from setting “DIA” to “PRM” for acquisition mode (again for either Centroided or Orbitrap) and reloaded the Hybrid-DIA and native DIA raw file.
In both Skyline files (of native DIA + Hybrid-DIA of either Centroided or Orbitrap), I only see the MS1 data and not the MS2. I expected this for the native DIA (because no PRM data), but not for the Hybrid-DIA file.
Why does Skyline not show me the PRM data for the Hybrid-DIA data in this setup?
To rule out the possibility that Skyline is having trouble displaying both DIA and PRM data, I used a Python script with pymsfilereader and MSconvert to filter the .raw files by only keeping the MS1 (n = 2,000 scans) and PRM-MS2 (n = 5,000 scans) scans. The resulting mzML files open fine in ProteoWizard SeeMS — I can clearly see the PRM-MS2 + MS1 spectra (and no DIA-MS2 spectra).
But when importing those mzML into either of the Skyline templates (acquisition mode [DIA or PRM] and product mass analyzer [Centroided or Orbitrap]), hardly any transitions appear. Also, for all Skyline templates I see differences in the number and intensity of transitions – I assume, different filtering is applied.
Overall, my main question is:
Is there a recommended workflow or conversion setting to make Hybrid-DIA PRM scans fully visible in Skyline (either separated in DIA and PRM or combined)?
If required, I can send you the Skyline Templates I used.
Thanks in advance for any help!
Best,
Andreas
|
| view request |
| Skyline identifying wrong peak in prm data |
| (1 response) |
gkline |
2025-08-11 15:56 |
|
Hello,
I am analyzing prm data from human plasma. Looking across replicates, the correct peak is not identified in every sample when I choose best peak. When I zoom out over the entire window, I can see that the desired peak is the most intense peak, even if skyline is not identifying it. Is there a way to manually choose this peak and apply it to the remaining replicates? Thanks so much!
Regards,
Gabe
|
| view request |
| .mzid file not getting recognized |
| (1 response) |
bhatti rushik |
2025-08-11 03:09 |
|
I used online Galaxy server to obtain peptide identification file (.mzid file format) from the .raw spectra file of Orbitrap.
But this is not getting recognized in Skyline.
What could be the reason and is it very frequent?
|
| view request |
| Isomers- |
| (2 responses) |
jm007 |
2025-08-06 13:22 |
|
Hello,
I have isomers that separate by chromatography that I am capturing with just one function, so we see three peaks of specific retention time. I am using just one MRM function but would like to set three compound names/RT/quant results for this function. How would we best do this? Itaconate, Citraconate, and Mesoconate MW 130 with identical fragments.
Kind regards,
James
|
| view request |
| Chromatogram view stuck at Intensity of 10^9 |
| (2 responses) |
katherine.wright |
2025-08-07 13:56 |
|
My viewer is stuck at 10^9 no matter what I try, I can't find how to change this.
Skyline (64-bit) 25.1.0.142 (7401c644b4)
Auto zoom to best peak
Autoscale Y axis on or off doesn't change it
|
| Screenshot 2025-08-07 165142.png |
| view request |
| small molecule quantitation with individually different compound concentrations |
| (1 response) |
w h c huibers |
2025-08-08 06:23 |
|
**I am using Skyline for quantitation of a multiple component assay with different concentration ranges for individual calibration curves.
Using MS1 data from a DDA experiment, acquired with a Q Exactive Plus instrument.
Transition settings/Full-scan/MS1 filtering/isotope peaks included: count
Transition settings/Full-scan/MS1 filtering/Peaks: 3
I can't set set individual concentration ranges for the different compounds in the assay. If I change 1 compound, they all are modified.
I would like to have one Document Grid, in which I can vary the concentrations for each compound as needed.
How is this possible in Skyline. So far I could not find the answer in a tutorial or other document.
Kind regards,
Wim Huibers
**
|
| view request |
| Bug reports regarding the handling of large amounts of replicates |
| (4 responses) |
simow02 |
2025-07-22 06:11 |
|
Dear Skyline Team,
while experimenting with Skyline to potentially use it for the routine analysis of large metabolomics experiments, we encountered the following bugs:
1. The “Synchronize zooming” feature currently only works, if all replicates have been loaded once. It would be greatly appreciated if this could be fixed, so that the synchronization works without having to switch from tabbed to tiled chromatograms to load everything each time a new molecule is selected. This has already been discussed here: https://skyline.ms/announcements/home/support/thread.view?rowId=64947
2. To get an overview of many chromatograms quickly the technique of using the results grid and up/down arrow keys works great. But we did notice a bug, when clicking up/down it’s not possible to then immediately see the last chromatogram by using down/up. Just a minor thing but a fix would still be appreciated.
3. Maybe not a bug but when experimenting with the “File/Import/Annotations” feature we noticed that annotations of different types, e.g. replicates and molecules, can’t be imported in the same table. This seems to be because the column headers are type specific even if the respective cells are left empty. As we would need to routinely import annotations for replicates, molecules and transitions it would be great if all that could work with a single table.
We would greatly appreciate if these could be fixed Thank you for your great software and active help in this forum!
Best
Simon
|
| view request |
| signal-to-noise (S/N) calculations |
| (1 response) |
weitmanm |
2025-08-06 07:31 |
|
Hi Skyline Team,
I’d like to know if there’s a way to calculate the signal-to-noise (S/N) ratio for peaks in a chromatogram.
Specifically, I’m interested in doing this for an MS2 chromatogram—that is, based on fragment ions.
Thanks so much!
Michal
|
| view request |
| Import peptide results with .msf and .pdresult files fails- Skyline-daily (64-bit) 25.1.1.147 |
| (8 responses) |
Antrix Jain |
2025-08-04 08:44 |
|
Cannot import result files (.msf or .pdresult) from PD. The software closes automatically after giving an error- "Error getting score type for this file".
Skyline-daily v24 has no issue.
|
| view request |
| Product ions chromatogram for peptide are unavailable |
| (1 response) |
bhatt511 |
2025-08-05 08:57 |
|
I ran a couple of peptides on the LUMOS instrument using the tMSn unscheduled method for collision energy optimization. I used a transition list generated by Skyline with varying collision energies as suggested by the Skyline software.
After analyzing the data in Skyline, I observed the following:
For one peptide, only the precursor ion chromatogram was detected, with very low intensity, and no product ion chromatograms were visible.
For the other peptide, I obtained three precursor ion transitions with intensities around 10⁶, and three product ions, though their intensities were significantly lower (~10³).
I have a couple of questions regarding the method:
Would PRM or a scheduled method be more appropriate for this type of collision energy optimization?
What would be the best approach to optimize collision energy to achieve better product ion intensities?
What can be the reason of not getting the product ions (y ion) on skyline? I do have seen chromatogram in FreeStyle when I put Raw file there.
I am attaching herewith the raw file of the two peptides for your kind perusal.
|
| Peptide729_30fmol_1.zip Peptide298_30fmol_1.zip Skyline_20250804_RET_298_test.zip Skyline_20250804_RET_729.zip |
| view request |
| Cannot open Skyline file that I used today. |
| (2 responses) |
wulfmeyer vera |
2025-07-31 02:37 |
|
Dear Skyline Support,
I am using Skyline-daily (64-bit) 24.1.1.284 (bc93c2813) and I cannot open a file I have been working on today.
This is the error message:
The file contains an error on line 184772 at column 16.
The isotope modification type heavy does not exist in the document settings.
The document does not contain isotopes, but Skyline is reading some of the transitions as "heavy".
Is there a possibility for me to fix it myself?
Thank you very much in adavance.
Best,
Vera
|
| view request |
| Small molecule PRM transition/molecule settings |
| (4 responses) |
jweinb9 |
2025-07-17 10:30 |
|
Hello. I successfully completed the Small Molecule Quantification tutorial with the example SRM data but am unable to build a calibration curve with my own PRM Orbitrap data. I would like to quantify with my product ion but I'm realizing that for PRM I need to have 'p and f' in transition settings, and 'MS level 1' in quantification molecule settings or all my integrated peaks disappear. Something else to note - my precursor ion for light and heavy are different m/z's but my product ion is the same.
Do you have any advice on the combination of molecule and transition settings for me?
I have just a few files loaded in to practice - I realize this is not great curve data.
Thanks so much!!
|
| view request |
| MRM HR wiff file import parameter |
| (1 response) |
ssy8827 |
2025-07-29 22:07 |
|
Hi,
I conducted MRM HR peptide quantification using the ZenoTOF 7600 (no small molecules involved).
I'm encountering an issue when trying to import the generated WIFF file into Skyline.
I have already entered the peptides via Edit → Insert → Peptides.
In Settings → Transition Settings, I configured the following:
MS1 filtering: Count
Precursor mass analyzer: Centroided
Peaks: 3
Mass Accuracy: 10 ppm
For MS/MS filtering, I left it as None.
Among the options — None, DIA, PRM, DDA, SureQuant — which one should I select?
|
| view request |
| Problems with intensity extractions |
| (1 response) |
alejandro gomez toledo |
2025-07-29 01:44 |
|
Hi since I installed the new version I had big trouble getting out the intensity of my peaks. You will se in the screenshot it highlights the right peaks but the areas are completely off...
-Ale
|
 feature.pptx feature.pptx |
| view request |
| Importing error "Index was outside the bounds of the array" |
| (17 responses) |
rschoenh |
2017-08-29 07:25 |
|
Hi,
I have a set of wiff files that I'm trying to import into Skyline, and some are imported fine, while others give me an error message (pasted partially below). I used the same Analyst scheduled acquisition method for all files, and I can open up the wiff files in Analyst without a problem. I'm using Skyline version 3.7.1.11271.
Thanks so much in advance for your help!
Best,
Regine
At 7:13 AM:
Failed importing results file '(...path and file name...)'.
Index was outside the bounds of the array.
|
| view request |
| Background correction no longer displayed (absent?) |
| (2 responses) |
niklas40639 |
2025-07-24 15:22 |
|
Hello,
I have noticed that skyline no longer displays a grey rectangle under peaks indicating background correction (see attached). I didn't pay very close attention to the timing, but it seems likely that this behavior resulted from the last update (24.1 -> 25.1). As far as I can tell, there is no way to enable/disable background correction during integration; it is a little difficult to tell, but it seems to me that no correction is being performed at all.
Is this a genuine bug, or is there a setting I am missing?
Thanks
Niklas
|
| background_showing.png no_background.png |
| view request |
| Precision in reports when using the command line |
| (2 responses) |
Will Thompson |
2025-07-25 12:38 |
|
Hi Nick, Brendan and team
What is the methodology to retrieve either full precision or a set scientific notation when calling reports from the command line? An example below of a report where we would love to be able to get better precision for start and end time for the peaks, and for concentration, but the default behavior seems to be 2 decimals for retention time and unpredictable for concentration. Is there a way to specify the export precision in the report xml, so that it can be done reproducibly between Skyline installs?
Cheers,
Will
<?xml version="1.0"?>
<views>
<view name="MoveKitCE_PeakIntegration" rowsource="pwiz.Skyline.Model.Databinding.Entities.Transition" sublist="Results!*" uimode="small_molecules">
<column name="Results!*.Value.PrecursorResult.PeptideResult.ResultFile.FileName" caption="file_name" />
<column name="Results!*.Value.PrecursorResult.PeptideResult.ResultFile.Replicate.Name" caption="replicate_id" />
<column name="Precursor.Peptide.Protein.Name" caption="molecule_group" />
<column name="Precursor.Peptide.MoleculeName" caption="molecule_name" />
<column name="Precursor.Adduct" caption="adduct" />
<column name="Precursor.Peptide.RetentionTimeCalculatorScore" caption="retention_time_calculator_score" />
<column name="Results!*.Value.Chromatogram.ChromatogramPrecursorMz" caption="precursor_mz" />
<column name="Results!*.Value.Chromatogram.ChromatogramProductMz" caption="ion_mz" />
<column name="Results!*.Value.PrecursorResult.MinStartTime" caption="start_time" />
<column name="Results!*.Value.PrecursorResult.MaxEndTime" caption="end_time" />
<column name="Results!*.Value.PrecursorResult.PeptideResult.PeptideRetentionTime" caption="peak_max_time" />
<column name="Results!*.Value.PrecursorResult.PeptideResult.PredictedResultRetentionTime" caption="predicted_peak_max_time" />
<column name="Results!*.Value.UserSetPeak" caption="is_modified_from_skyline_peak" />
<column name="Results!*.Value.PrecursorResult.PeptideResult.Quantification.CalculatedConcentration" caption="calculated_concentration" />
</view>
</views>
|
| view request |
| CE optimisation for PRM on TIMSTOF |
|
robert.rparker |
2025-07-28 04:11 |
|
Dear Skyline,
We are in the process of optimising CE for some PRM's we are performing, and we have a question to the user group on what is best practice.
What we have noticed is that we can enhance the sensitivity of our assays 2-3 fold for some peptides however this often results in a lowering of the dotp (dot product) value as we get a different abundance of some fragments (compared to our library spectra) that start to become more dominant. We are wondering what the best practice here is, we have a heavy standard so we can use the idotp for this rather than the library in our final analysis?
Should we regenerate our DDA data with a slope that reflects the optimal energies..?
Any advise is greatly appreciated.
bw,
rob
|
| view request |
| ZenoTOF 7600 - MRM HR wiff file import parameter |
|
ssy8827 |
2025-07-27 20:53 |
|
Hi,
I conducted MRM HR peptide quantification using the ZenoTOF 7600 (no small molecules involved).
I'm encountering an issue when trying to import the generated WIFF file into Skyline.
I have already entered the peptides via Edit → Insert → Peptides.
In Settings → Transition Settings, I configured the following:
MS1 filtering: Count
Precursor mass analyzer: Centroided
Peaks: 3
Mass Accuracy: 10 ppm
For MS/MS filtering, I left it as None.
Among the options — None, DIA, PRM, DDA, SureQuant — which one should I select?
|
| view request |
| Request improved Precision on Retention Time Prediction Values |
| (3 responses) |
Will Thompson |
2023-02-14 13:19 |
|
Dear Skyline Team. Currently the max precision calculated for retention time prediction (reported in "Predicted Result Retention Time" field), is hundredths of a minute. For very fast runs with very narrow peaks, it seems like it would be useful to allow a more precise prediction. The current precision of 0.01 minutes is only 0.6 seconds, which for some separations is nearly the 4sigma peak width. Please see attached an example of a file where I think having a more precise result of the prediction algorithm would be useful for putting the prediction closer to the apex of the peak. Or please let me know if I've just not configured something correctly. Thanks for your help!
Cheers,
Will
|
| AA_PeptideBGEVariance_021423.sky.zip |
| view request |
| Missing peptide search results after importing into Skyline |
| (2 responses) |
Zimeng |
2025-07-23 03:31 |
|
When I searched in PD, I got over 24,000 peptides identified, but when I imported the .pdresult file into Skyline to create a blib, there were only over 18,000 peptides, with a significant number missing. At this point, the raw data had not yet been imported.
When importing the peptide search, I did not select ‘Include ambiguous matches.’ Could this be the reason?
|
| view request |
| Importing timstof PASEF small molecule data results in an instant Skyline crash |
| (3 responses) |
Chris Ashwood |
2025-07-24 05:32 |
|
Dear Skyline team,
I hope you're doing well. I'm collaborating with a group that has a timstof Pro 2 and has generated PASEF small molecule data (in negative mode). When I try to import the raw files (.d folders) into Skyline daily (25.1.1.174) , they cause an instant crash with no errors or pop ups recorded. Ion mobility is not enabled in Skyline when I do this import.
If I convert the .d files (~150-300 MB) to mzML with the most recent proteowizard/msconvert version (3.0.2501) and no additional flags, conversion is successful and the mzml files (20+ GB each) import fine into Skyline (aside from the 10+ min import), as well as allowing ion mobility dimension analysis. Possibly related, if I use the "combine ion mobility scans" flag in msconvert, it crashes and isn't successful at writing a complete mzML when writing the chromatogram aspect of the mzml.
I'm unable to share the data on the public server but can email a file directly, as well as any additional details needed.
Cheers,
Chris
|
| view request |
| Targeted Lipidomics Analysis Help |
| (1 response) |
jnl21 |
2025-07-24 10:21 |
|
Hi Everyone,
I recently have done a targeted lipidomics analysis and I was told to use this software. I have figured out how to import data and see peaks, but I am completely lost regarding the whole analysis process. My background is primarily toxicology, so these are truly unchartered waters for me! I would really (REALLY!) appreciate someone giving me a little bit of guidance, as I am panicking!!
Thank you soo much for any help
|
| view request |
| Parent mass on Peak area plot |
| (1 response) |
moises zapatamr |
2025-07-24 11:57 |
|
Hi,
I am trying to include the parent mass in the legend for the Peak area plot. It only shows the product ions in the legend and I can't find a way to include the parent ion as well.
Thank you!
|
| Peak area.png |
| view request |
| Why does importing skyline from mzml /4D format fail? |
| (1 response) |
z15839328872 |
2025-07-24 01:11 |
|
Dear Skyline team,
You asked me to upload the data file before, I tried to upload it but failed, is there any other way to give you the data? For example, email?
Zhouyanan
|
| skyline4.png |
| view request |
| Missing Tutorial Documents |
| (3 responses) |
akendra1 |
2025-07-23 11:16 |
|
Hi, I'm new to using skyline and want to use it for analysis of small molecule LCMS data and dia-PASEF protemics data. Maybe I'm missing something really obvious but, the tutorials seem to be missing from the skyline website. For example, when I click on the thumbnail for the small-molecule quantification tutorial, or any other, it brings up a blank page with the tutorial title. If I click print, a print-preview popup appears with a 1-page PDF that only says the title of the tutorial. This seems to happen in both Chrome and Firefox browsers.
Any tips on how to access the full tutorial documentation?
|
| view request |
| Why does importing skyline from mzml /4D format fail? |
| (1 response) |
z15839328872 |
2025-07-23 23:41 |
|
Dear skyline team,
I used the first MS Amanda method you recommended and it still failed, and then used the second method you recommended 4D method to import still failed, and the computer kept stuck and restarted, and the data import was unsuccessful for 11 hours, and the same is true when I changed to a new computer. My data is the non-targeted identification of protein peptides done in the early stage, and the FASTA file obtained is 4D (converted into mzml format), I hope to get your reply.
Zhouyana
|
| skyline3.png |
| view request |
| Clustered Report values doesn't match with manual calculation |
| (1 response) |
Dhaval Patel |
2025-07-22 15:12 |
|
Hi,
I performed a simple group comparison between the control and treatment groups at the protein level, which generated a table showing fold changes and adjusted p-values.
While cross-checking the values from the Clustered Report against those I manually calculated from the Document Grid, I noticed they don’t match.
I’m certain I’m missing something in the process, but haven’t been able to pinpoint the mistake. I’ve attached a PowerPoint file with my specific question and a screenshot to help illustrate the discrepancy.
Your guidance would be highly appreciated. Thank you once again for your continued support.
This is also a continuation of my previous support request titled as “Live Report >Group Comparison on 2025-07-15 19:08.
Normalization method: Ratio to Heavy
|
| Skyline_Question-1_07152025.pptx Skyline_GroupComparisonSettings.PNG Skyline_DocumentGrid_Replicates.PNG |
| view request |
| Live Report > Group Comparison |
| (5 responses) |
Dhaval Patel |
2025-07-15 09:58 |
|
Hi,
I performed a simple group comparison between the control and treatment groups at the protein level, which generated a table showing fold changes and adjusted p-values.
Is there a way to quickly extract the actual intensity or abundance or ratio values that were used behind the scenes to calculate these results?
Our collaborator would like to have these values in Excel format to cross-verify the statistical findings independently.
I’ve attached screenshots of the analysis settings for your reference. Please let me know if you need any additional information or clarification. Happy to share actual file if needed.
Thank you,
Dhaval
|
| Skyline_DocumentGrid_Replicates.PNG Skyline_GroupComparisonSettings.PNG |
| view request |
| Limit on PTM losses |
| (1 response) |
Juan C. Rojas E. |
2025-07-22 04:58 |
|
Hi all,
I am working on automating the input of large lists of custom glycans into Skyline (more on this on another post) and I encountered the following error:
"Neutral losses must be less than or equal to 5000."
More detailed error is attached.
As I understand it, it came due to having a very large glycan PTM (see attached image). Would it be possible to extend the mass limit of these neutral losses?
My current workaround is to exclude these from my workflow.
Sincerely,
Juan C.
|
| NeutralLoss_error.txt BigGlycans.png |
| view request |
| Feature requests regarding the handling of large amounts of replicates |
|
simow02 |
2025-07-22 06:15 |
|
Dear Skyline Team,
we are planning to use Skyline in the routine analysis of large Metabolomics experiments involving roughly 200 molecules and 300 replicates. From our testing Skyline is works well with that many molecules but is missing some features to make the handling of hundreds of replicates feasible. We’ve already looked at many of your great tutorials and answers in this forum but couldn’t find solutions for many problems we encountered. The following features would significantly improve the analysis of large numbers of replicates:
1. Most importantly the current viewing options for chromatograms are not well adapted for hundreds of replicates per molecule. We would suggest something like a scrolling window, where all chromatograms for a molecule can be scrolled through quickly. Another option would be to use the “View/Arrange graphs/Groups” feature to split all chromatograms over a handful of windows each with multiple tabs. It would then be very useful to advance through the tabs with one click in all windows simultaneously. This has already been requested here: https://skyline.ms/announcements/home/support/thread.view?rowId=60905
2. To more quickly evaluate and correct the peak integration bounds we heavily rely on the replicate comparison views for peak areas and retention times in combination with ordering by custom annotations (plate id, biological condition…). It would be great, if instead of the replicate’s filenames, Skyline would show the value of the ordering annotation on the x axis of replicate comparisons.
3. Finally it would be very useful to be able to change the order of chromatograms document-wide. Currently sorting the results grid or ordering the replicate comparison views doesn’t change the order of chromatograms in other windows. Being able to quickly click through chromatograms using up/down (or scroll as suggested above) in any desired order would make the manual peak picking for large numbers of replicates significantly more efficient.
Together with these features it would also be greatly appreciated if the bugs we found and reported here ( https://skyline.ms/announcements/home/support/thread.view?rowId=71363), especially the “Synchronize zooming” feature, would be fixed. Thank you for your great software and active help in this forum!
Best
Simon
|
| view request |
| SSL format for cross-links |
| (4 responses) |
julian bender |
2025-07-16 05:45 |
|
As described on GitHub in more detail, I was trying to use an SSL-file generated by the xiview server for spectral library generation in Skyline. However, there seems to be an issue with either the format generated by xiview (which I think is in accordance with a Skyline presentation describing the format) or the way BiblioSpec is interpreting the file.
I have attached a minimal ssl file and the corresponding mgf file for testing. Please let me know if you need any further details.
Thanks
Julian
|
| xiview_old_syntax_short.ssl recal_Ascend002047.zip |
| view request |
| EncyclopeDIA error |
| (12 responses) |
sscott13 |
2025-04-11 09:54 |
|
Hello,
This is my first go through using Skyline/EncyclopeDIA to look at my samples vs. GPF, so there might be something I'm setting up incorrectly, but I keep hitting a GC overload error. There are a ton of entries in the file, and I'll try parsing it to see if that fits, but I wanted to check to make sure it wasn't something in my setup. I had 6 GPF pools, and 15 samples. The blib is created, but the error comes in when the elib is supposed to be created.
- Is there a way to get around this in Skyline? I'm happy to send over whatever files you need.
Thank you,
Shay
|
| overhead exceeded2.png |
| view request |
| Small molecule PRM transition/molecule settings |
|
jweinb9 |
2025-07-17 10:42 |
|
Hello. I successfully completed the Small Molecule Quantification tutorial with the example SRM data but am unable to build a calibration curve with my own PRM Orbitrap data. I would like to quantify with my product ion but I'm realizing that for PRM I need to have 'p and f' in transition settings, and 'MS level 1' in quantification molecule settings or all my integrated peaks disappear. Something else to note - my precursor ion for light and heavy are different m/z's but my product ion is the same.
Do you have any advice on the combination of molecule and transition settings for me?
I have just a few files loaded in to practice - I realize this is not great curve data. I uploaded my zip if that helps.
Thanks so much!!
|
| view request |
 screen capture.jpg
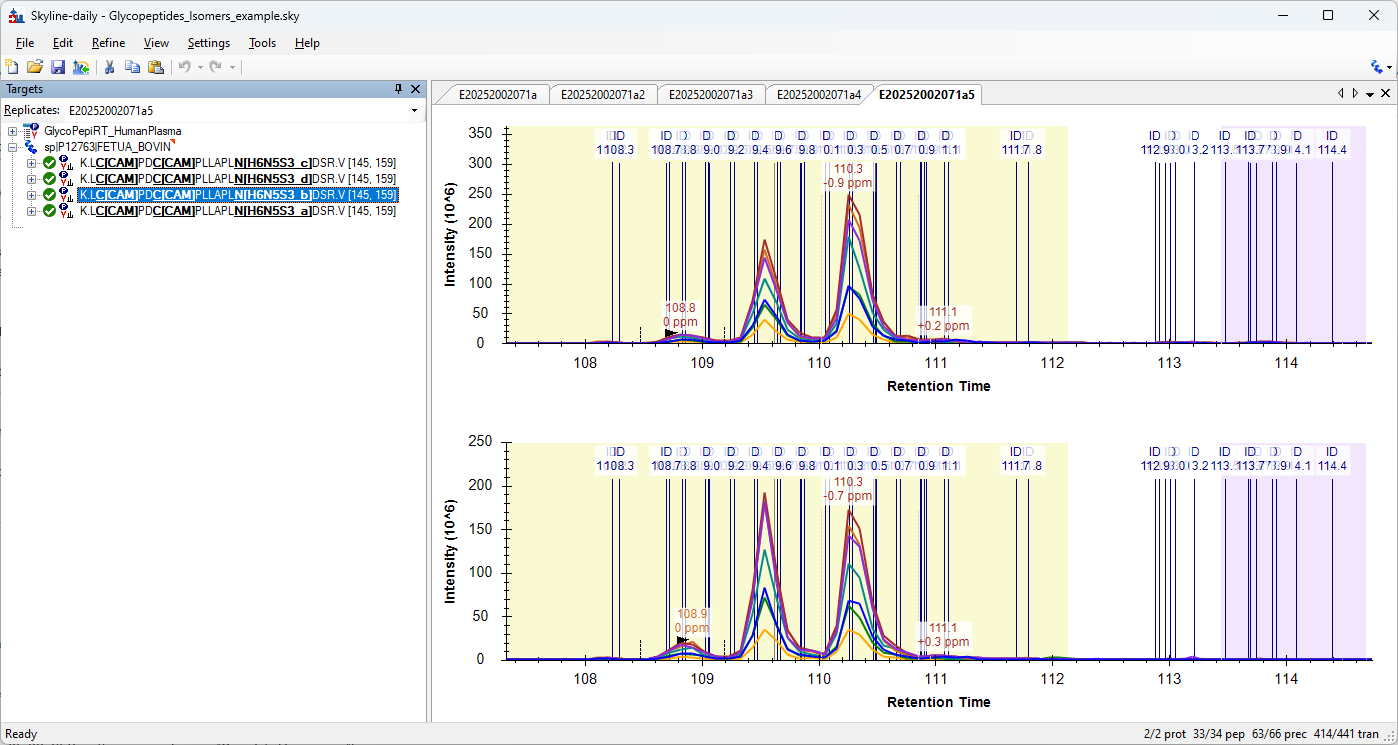 GlycopeptidesIsomersExample.png
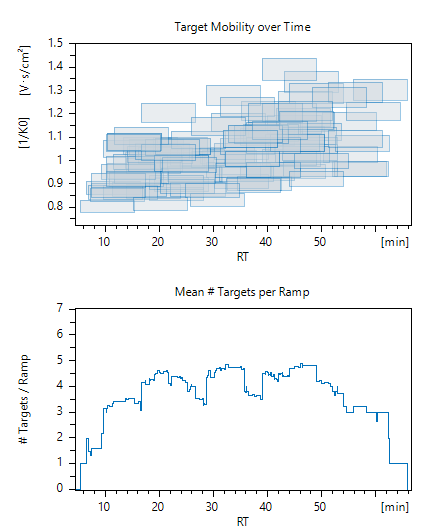 example_scheduling_window.png
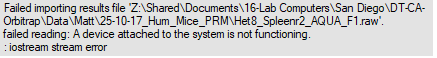 Error.png
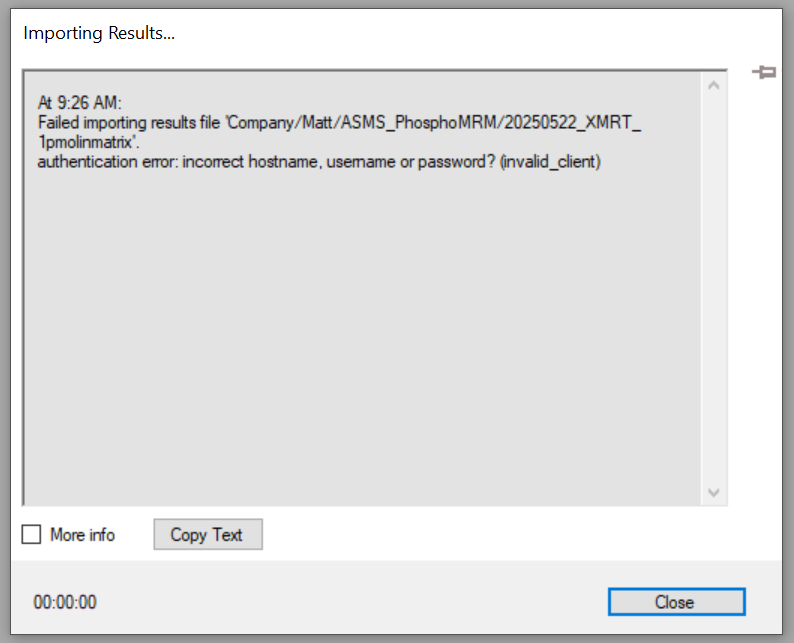 SkylineAuthenticationError.PNG
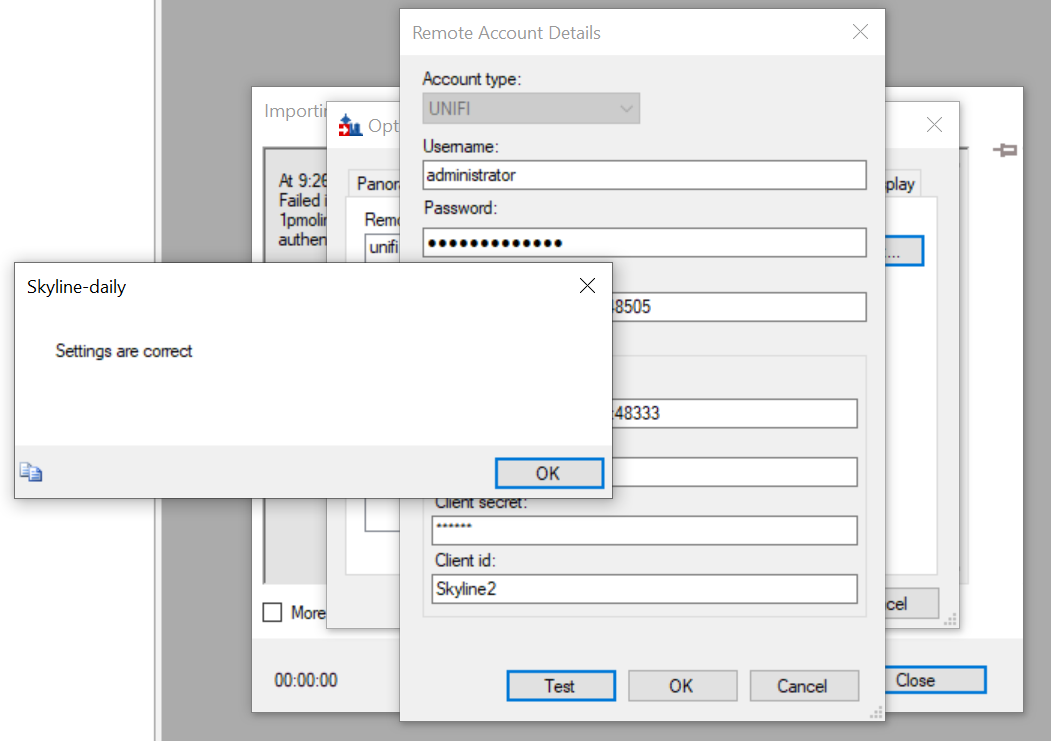 SkylineRemoteAccount.PNG
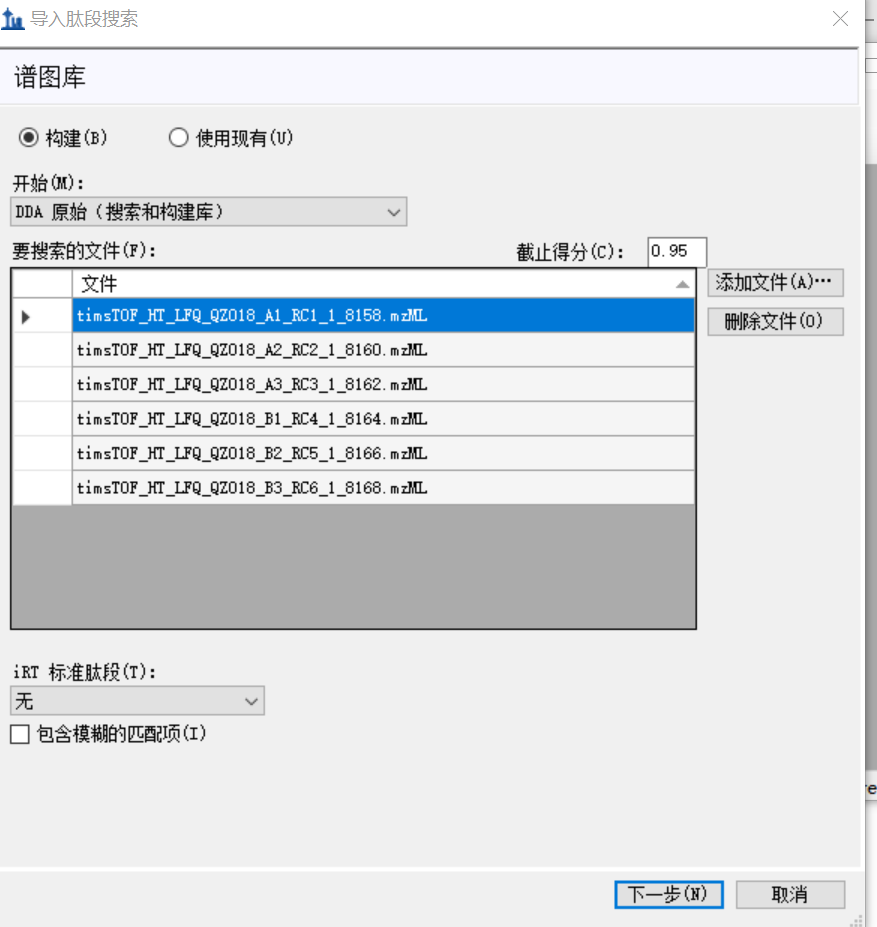 skyline1.png
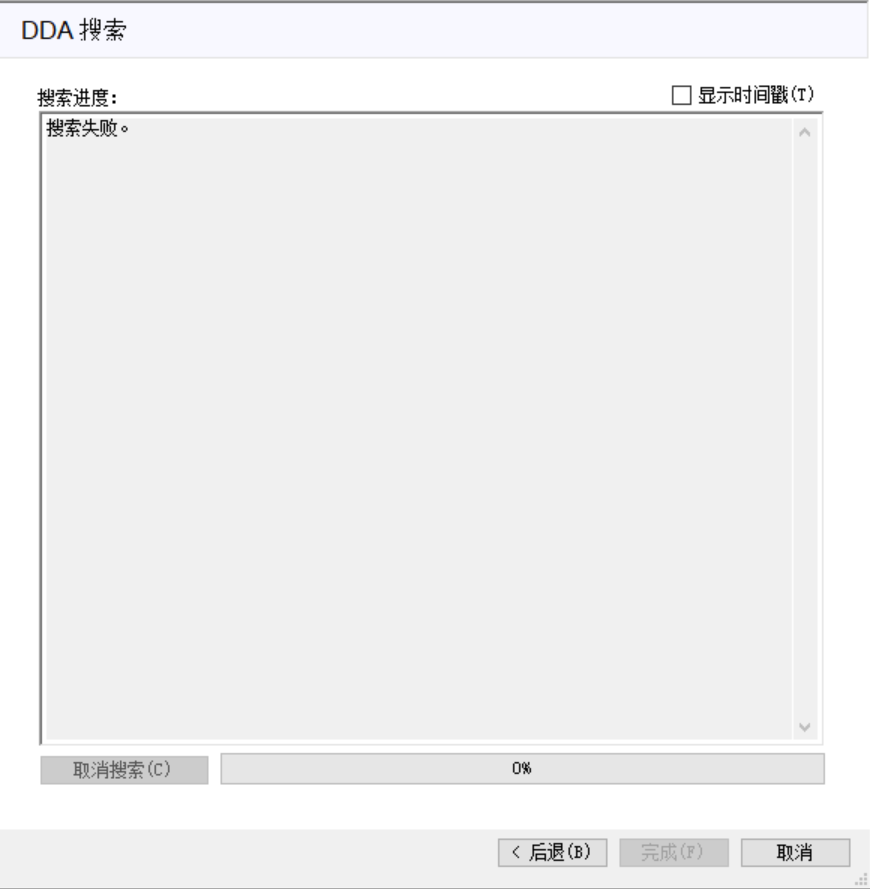 skyline2.png
 Ekran görüntüsü 2025-09-26 144515.png
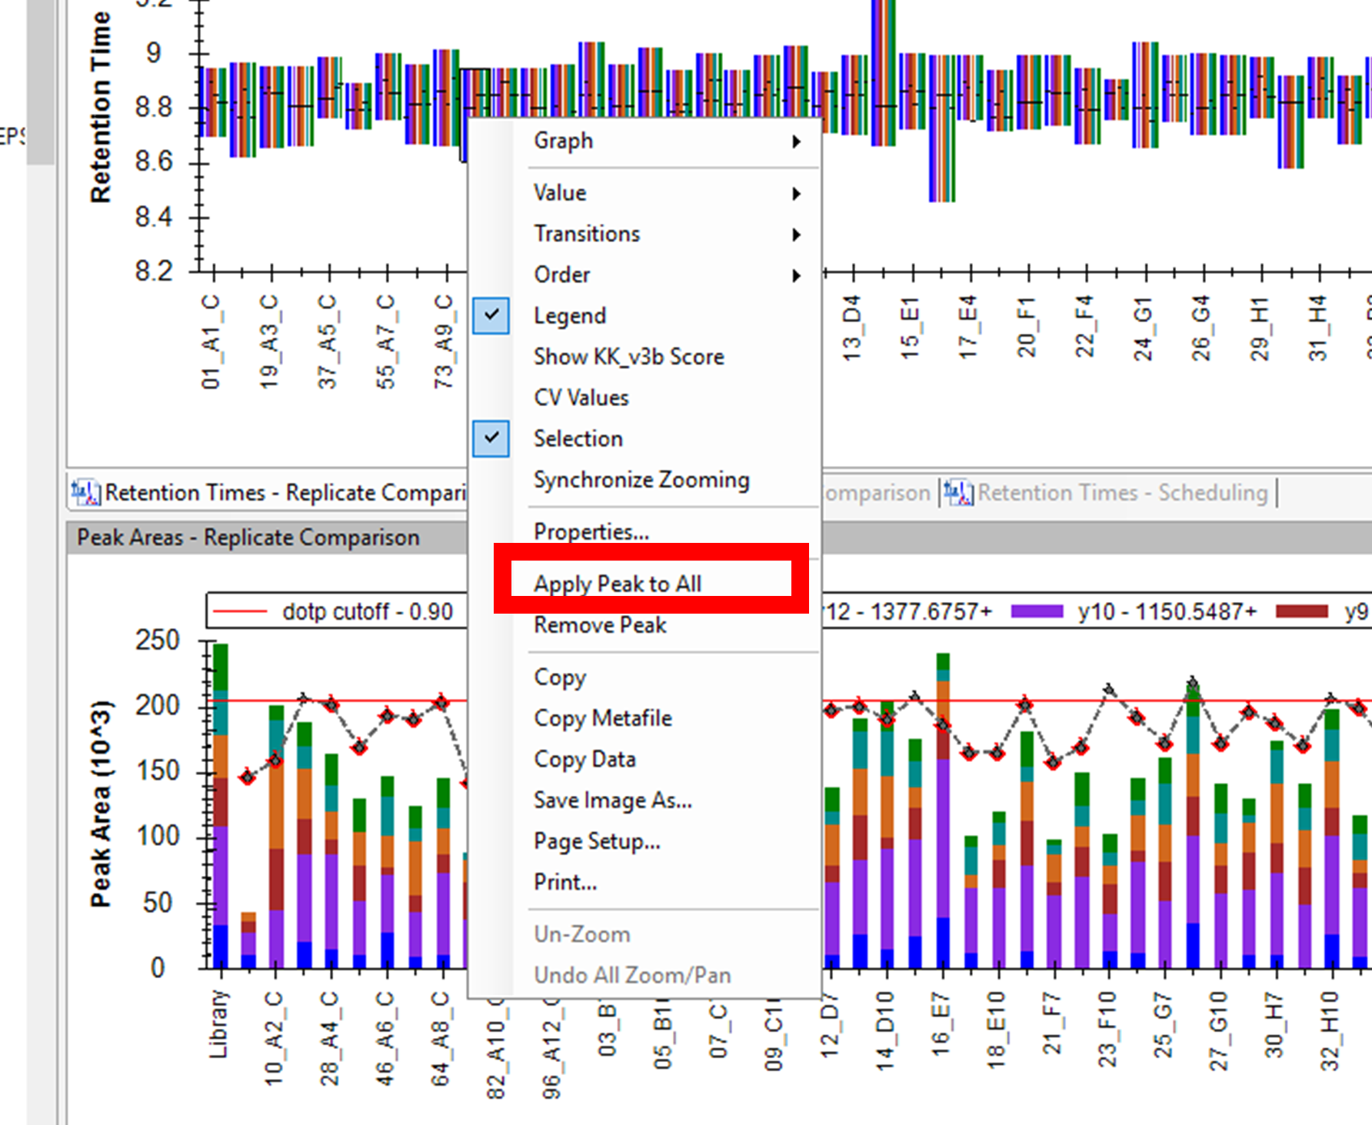 Picture3.png
 Screenshot 2025-09-25 150842.png
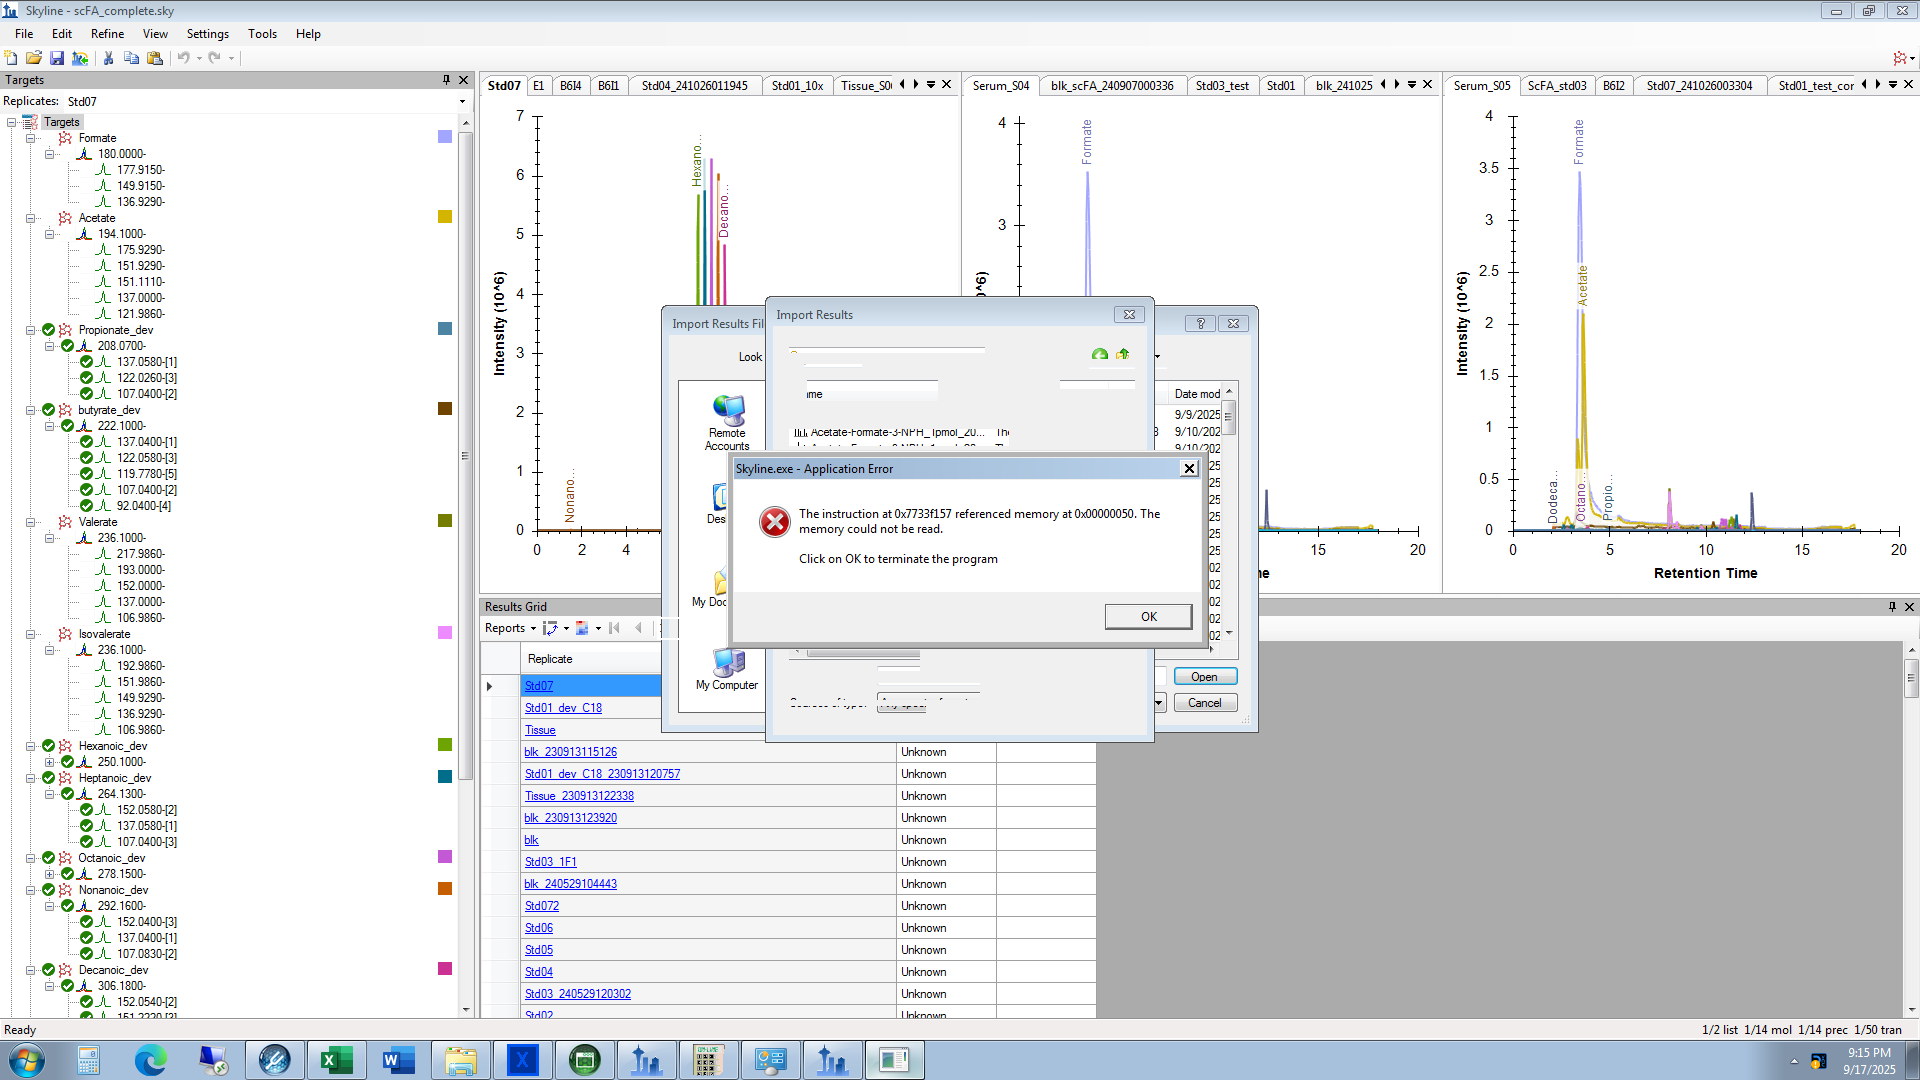 application_error.png
 error msg.jpg
 Screenshot 2025-08-25 134356.png
 Skyline-DIANN-lib issue.png
 Building spectral search library error 2.PNG
 Building spectral search library error 1.PNG
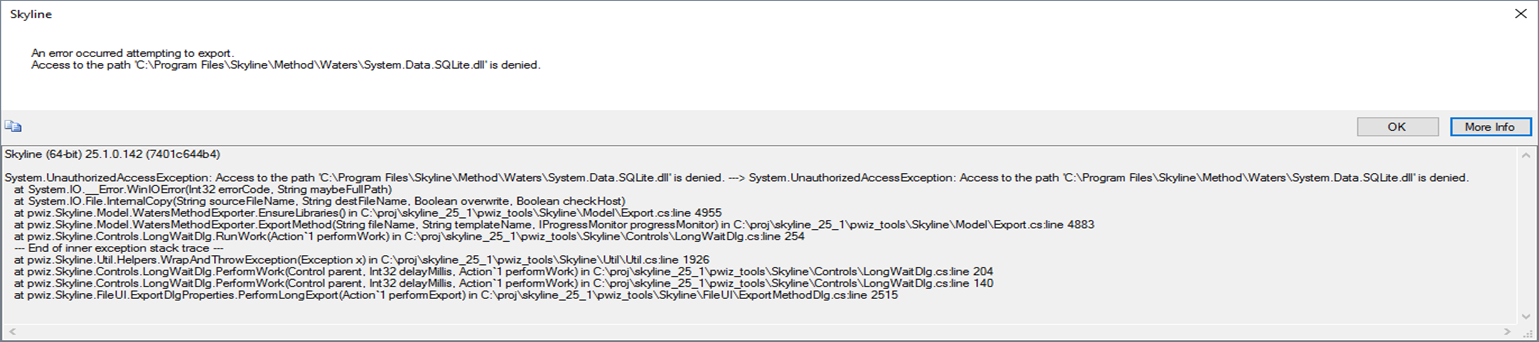 Error1.png
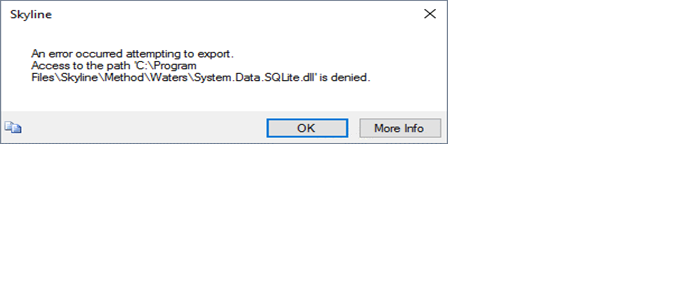 Error2.png
 Screenshot 2025-06-06 092908.png
 Screen Shot 2018-04-25 at 2.38.14 PM.png
 Screen Shot 2018-04-25 at 11.44.59 AM.png
 Screenshot 2025-08-07 165142.png
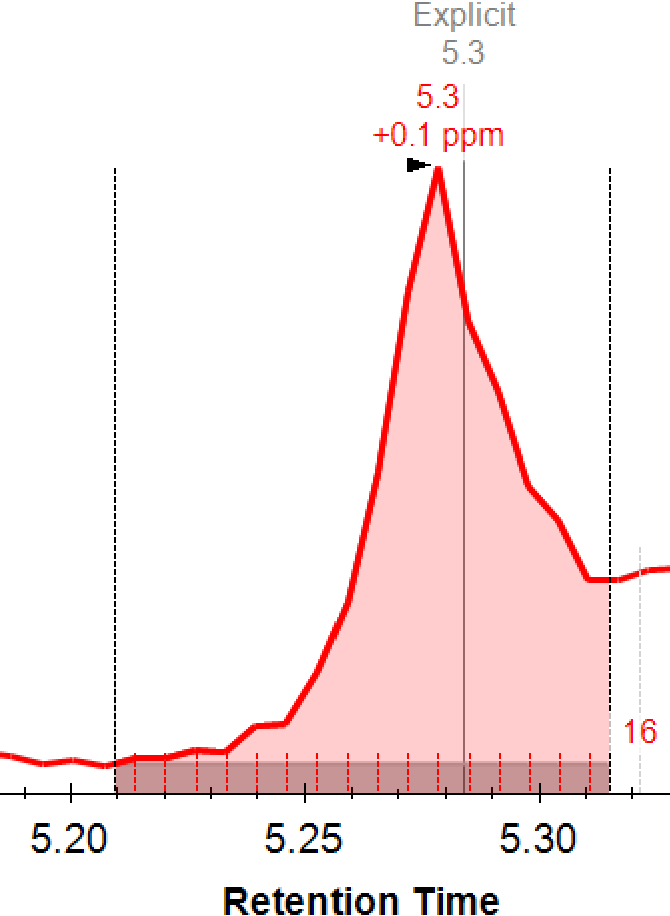 background_showing.png
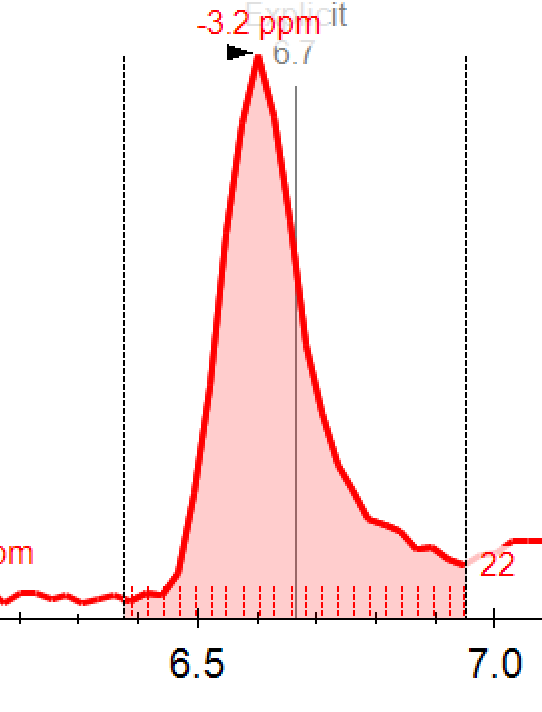 no_background.png
 Peak area.png
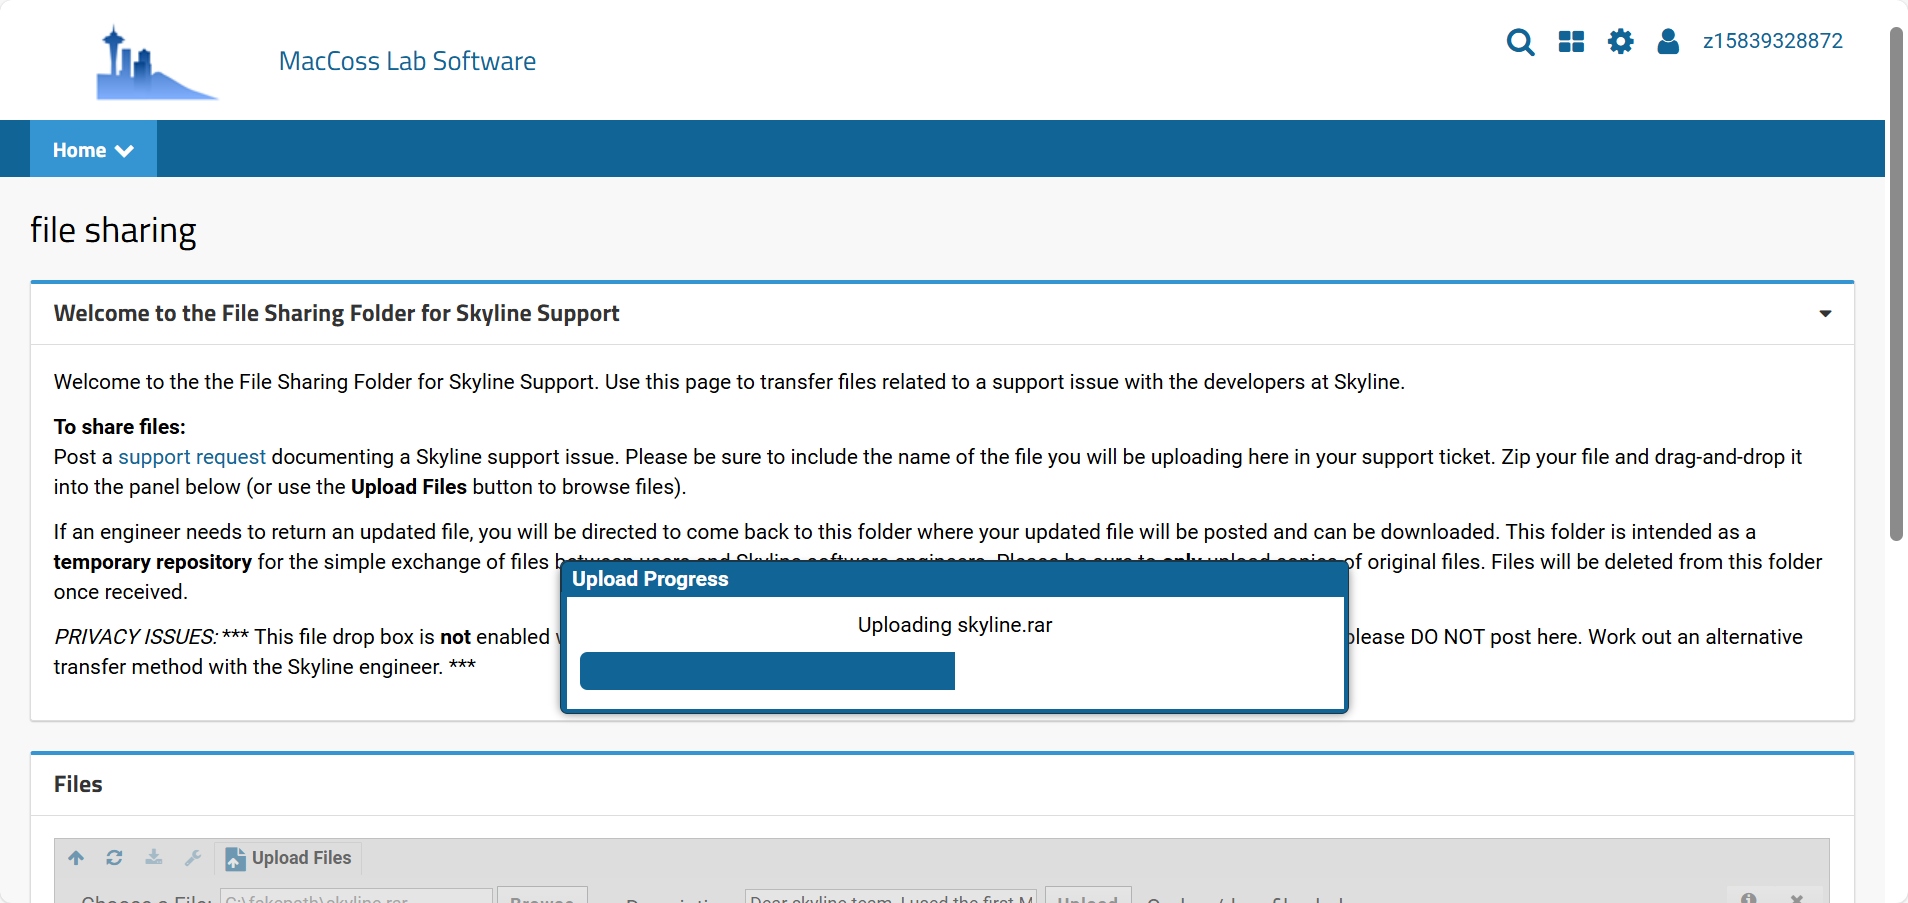 skyline4.png
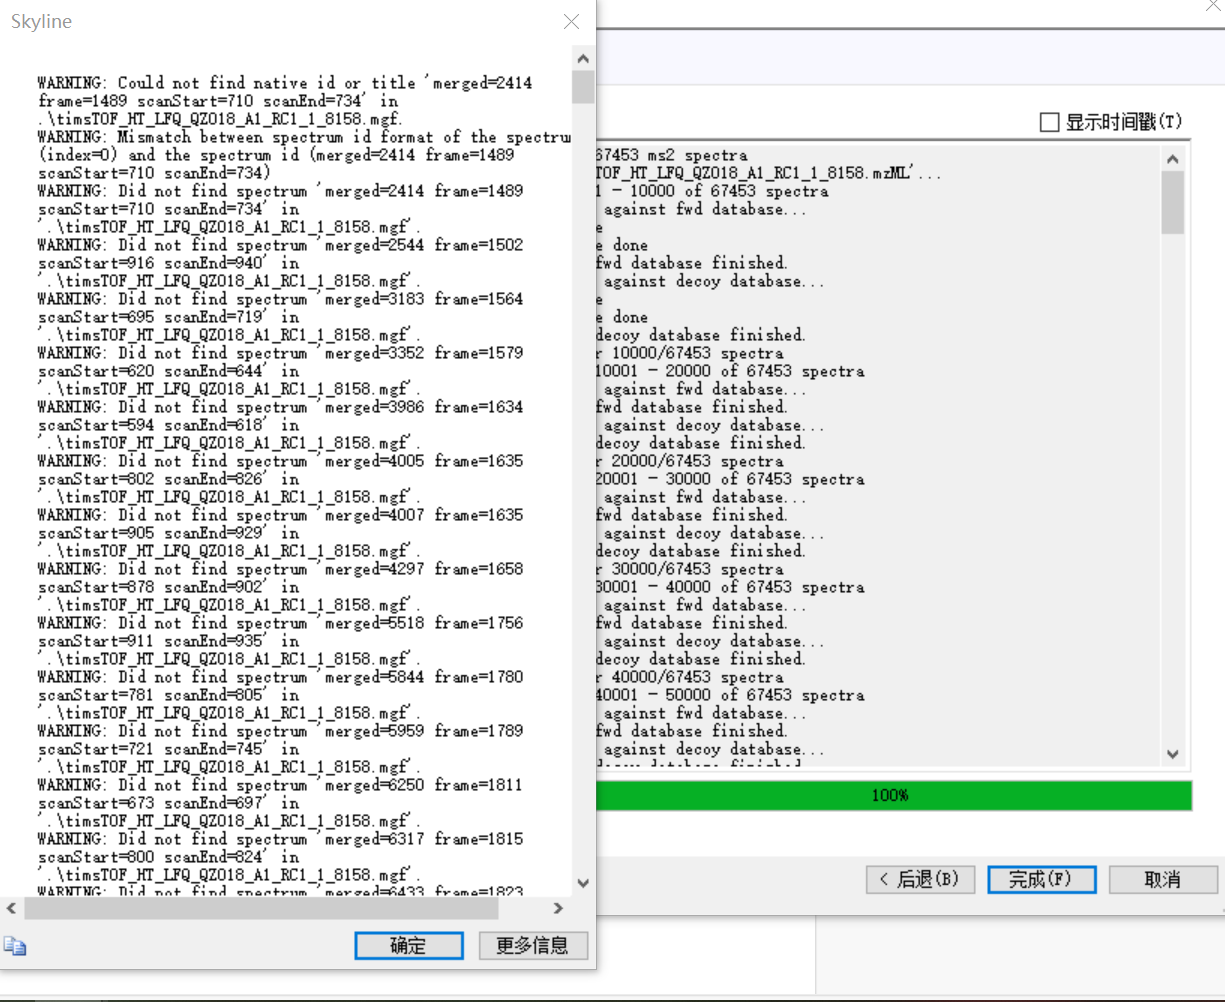 skyline3.png
 Skyline_GroupComparisonSettings.PNG
 Skyline_DocumentGrid_Replicates.PNG
 Skyline_DocumentGrid_Replicates.PNG
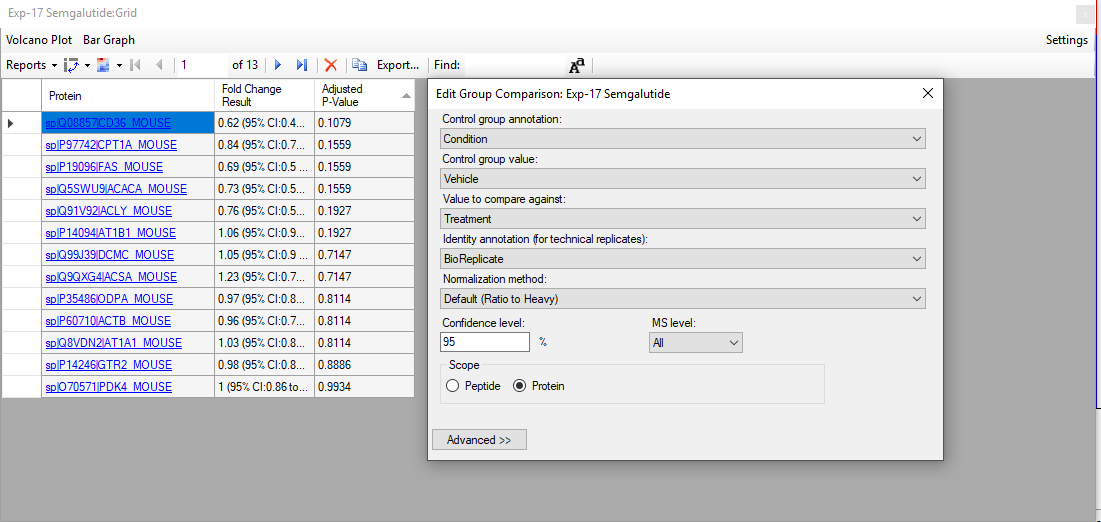 Skyline_GroupComparisonSettings.PNG
 BigGlycans.png
 overhead exceeded2.png