|
Showing: limited to 100 requests
|
| Live Report Terminology Query |
| (2 responses) |
Dhaval Patel |
2025-06-27 14:10 |
|
Hi,
Could you please help me understand how it calculates the "Protein Abundance Transitioned Summed" in the attached custom report document? The current normalized method is Ratio to Heavy. Please let me know if you need additional information or have any queries.
Thank you
|
 Custom Report_WLS_Replicates Comparisons.csv Custom Report_WLS_Replicates Comparisons.csv |
| view request |
| Inquiry on Bottom-Up Analysis Using Skyline for Protein/Peptide Identification |
| (2 responses) |
wei ng2 |
2025-03-06 18:18 |
|
Dear Support Team,
I hope this message finds you well. I have recently obtained results from LC-QTOF analysis and am seeking to determine the potential proteins and peptides present in my sample. I would like to inquire whether it is possible to perform a bottom-up analysis using Skyline for the identification of these proteins and peptides.
If this is feasible, I would greatly appreciate it if you could recommend any relevant tutorials or instructional videos to guide me through the process.
Thank you for your assistance, and I look forward to your response.
Best regards,
Smith 13
|
| view request |
| eDR Full Scan Data |
|
wes rogers |
2025-07-02 13:10 |
|
Hi Skyline team,
I am trying to extract MS1 information from an enhanced dynamic range (eDR) full scan on the Orbitrap Excedion Pro. This scan is multiplexed at the MS1 level and combines 2 Orbitrap subscans to form a single full scan. The ion packets have variable injection times. I am getting the following error when trying to import the data…
[SpectrumList_Thermo::spectrum()] Error retrieving spectrum "controllerType=0 controllerNumber=1 scan=1": [SpectrumList_Thermo::getMultiFillTImes()] Unexpected fill time format: IT=25;35;22;4;3.6;0.21;IT=28;28;28;7.2;0.96;0.72
I am using the latest version of Skyline daily (v. 25.1.1.174). Is this type of data, eDR full scan, data supported yet?
I will upload the .raw file. Please let me know if you need any more information. Thanks!
Thank you,
Wes
|
| view request |
| Peptide Import DDA library from Fragpipe Spectrum id format and file id |
|
naomi osullivan33127 |
2025-07-02 06:30 |
|
Dear Skyline team,
I am trying to import peptide search results from Fragpipe outputs but am encountering a format mismatch error between files.
My results are from Fragpipe v23 and am importing into Skyline (64-bit) 25.1.0.142 (7401c644b4).
I have tried multiple times with two different files to follow the Fragpipe tutorial on importing data into Skyline. During the first step, once I select the interact files and click next, I encounter the following warning (attached 1): "[SpectrumList::find] mismatch between spectrum id format of the file (scan=1) and the looked up id (controllerType=0 controllerNumber=1 scan=726)"
This warning seems to be there for every spectrum (attached 2) and thus nothing is imported into the Skyline document. If I click more info, the first line is "System.IO.IOException: WARNING: Could not find native id or title 'controllerType=0 controllerNumber=1 scan=759' in ../250128_Hela_100ng_DDA_3ms_R1_uncalibrated.mzML."
Based on the comments in the submission 'opening.d files on skyline' https://skyline.ms/announcements/home/support/thread.view?entityId=e28a2047-ead0-103d-b4e5-22f535560118&_docid=thread%3Ae28a2047-ead0-103d-b4e5-22f535560118 containing similar mismatch issue discussed in the comments, I tried moving either the raw, uncalibrated mzml or mzml into the folder but all produce the same error.
Is this a file formatting issue from Fragpipe or a Skyline issue?
Thanks for you work,
Best,
Naomi O'Sullivan
|
 Building spectral search library error 2.PNG Building spectral search library error 1.PNG Building spectral search library error 2.PNG Building spectral search library error 1.PNG |
| view request |
| ID retention times incorrect |
| (10 responses) |
jdemeter |
2025-06-19 19:56 |
|
Hi,
I am trying to load a dataset into Skyline-daily using fragpipe and noticed that the retention times for psms that are loaded don't agree with the retention times that are in the spectral library.
I am analyzing a Bruker timstof dda dataset. I attached the fragpipe log-file that shows how - in the last step - it is loading the result into skyline-daily. I can send you the folder with the actual data.
I also attached an excel file with an example of a peptide retention times (what is loaded and what is in the spectral library).
Can you please take a look?
Thanks,
Janos
|
 log_2025-06-17_18-12-00.zip log_2025-06-17_18-12-00.zip  rt_example.xlsx rt_example.xlsx |
| view request |
| Ion Match Tolerance MS1 Data Waters Xevo QTOF |
| (1 response) |
tateh |
2025-06-30 11:08 |
|
Hi,
I'm trying to use MS1 data to do peak quantification in Skyline; however, updating the ion match tolerance does not appear to update the actual range extracted in the chromatogram window. I confirmed with the MassLynx that this ion is present within a range window >0.05 m/z, but when setting the ion match tolerance in Settings > Transition Settings > Library as suggested in this support request: https://skyline.ms/announcements/home/support/thread.view?rowId=31474 , the m/z range for each precursor does not appear to change. The Skyline file was save with the updated ion match tolerance before results were imported.
Thanks in advance!
|
| 789_peptide.png 789_peak.png |
| view request |
| Exporting Skyline Method to UNIFI for Waters Xevo QTof G3 |
|
philipp peslalz |
2025-06-30 02:09 |
|
Hi all,
I’m currently working with the Waters Xevo QTof G3 in combination with UNIFI software, and I’m hoping to use Skyline to design my proteomics acquisition methods (specifically for PRM/MRM-HR workflows).
My main question is:
How can I export a method from Skyline and import it into UNIFI?
I’ve successfully exported a transition list (or isolation list) from Skyline as a .csv, but I haven’t found a way to directly import this into UNIFI as an acquisition method. Is there a workflow or tool available to help bridge this gap?
Any advice or examples from others who’ve used Skyline with UNIFI would be greatly appreciated!
Thanks in advance,
Philipp
|
| view request |
| Prm conductor / expert reviewer erroring |
| (3 responses) |
joel steele28028 |
2025-06-24 20:55 |
|
date and time error keeps causing the plugin app to not work. tried clearing all replicates out down to one. wiping file and rebuilding apps, and reinstalling apps.
i will attach the current panorama document/share as well to here
|
| view request |
| signal to noise ratio/ noise information |
| (3 responses) |
mansour bounouba |
2025-06-27 01:48 |
|
Hi,
I am looking for signal to noise ratio on the results? Or can we determine it with background and total area?
About background, "background" and "total background" seems to be the same info. Is it possible to have more details about it (start and end) and is it possible to adjust it?
Thank you
Regards
|
| view request |
| Agilent GCMS Transition Settings |
| (10 responses) |
bri bibel |
2025-06-24 08:06 |
|
Hi. Apologies for the very novice question, but I'm trying to import GCMS data from an Agilent GC-MS 8890 GC 5977b (single quad) and analyze a set of metabolites. I am trying to piece together how to do this from various threads, but am unsure of how to set the "Transition Settings" parameters. Would you be able to help? Thank you in advance for your time!
|
| view request |
| Mass error ppm in report and RSD duplicate |
|
chemistry Jedi |
2025-06-26 01:05 |
|
Hello everyone,
I have two issues I need help with:
I need to calculate the mass error (in ppm) for each compound and include it in my report.
I also need to calculate the RSD for both the area and the mass error of duplicate samples. However, I’m not sure how to specify which samples to include or exclude in the calculations. I need to display all of this information in my final report.
Please let me know if this is possible and if you have any solutions or suggestions.
Thank you.
Best regards,
|
| view request |
| Early-run m/z + IM calibration (timsTOF / any Q-TOF ?) |
| (8 responses) |
v delcourt |
2022-06-30 07:16 |
|
Hi,
Coming from nanoflow QE area and recently adapting to a timsTOF, one thing that is pretty handy is the early-run calibration. Briefly, a loop is filled with calibrant (e.g. sodium acetate/formate + agilent tunemix) and is pushed into the MS while in the dead volume (e.g. 0.1-0.3 min window). This allows through the Bruker software "dataanalysis" to perform a post acquisition calibration for m/z and IMS (tims), which is really nice to reach sub 2 ppm mass and ~ 1 % CCS precisions. This is also implemented for nanoflow with different procedures.
Are you considering adding this kind module to Skyline which would be awesome for both proteomics and small molecule analysis ?
Thanks again for developing Skyline.
With kindest regards,
Vivian
|
| view request |
| 2025 UW Course (July) |
| (1 response) |
hscprotein |
2025-06-23 22:40 |
|
I signed up for the course and would like to know if a schedule with more details (time) will be posted. Where exactly is the class? Foege S bldg#? What time does the course end? Thanks
|
| view request |
| import MS1 data failed using Skyline (64-bit) 25.1.0.142 (7401c644b4) |
| (4 responses) |
zhijun cao |
2025-06-23 11:37 |
|
At 2:36 PM:
Failed importing results file '\prusntyfil01\home$\SU012236\Documents\project\raws\20250619_h10n3_DS\DS\Tris_02.raw'.
boost::filesystem::status: Incorrect function [system:1]: "\prusntyfil01\home$\SU012236\Documents\project\raws\20250619_h10n3_DS\DS\Tris_02.raw"
pwiz.Skyline.Model.Results.ChromCacheBuildException: Failed importing results file '\prusntyfil01\home$\SU012236\Documents\project\raws\20250619_h10n3_DS\DS\Tris_02.raw'.
boost::filesystem::status: Incorrect function [system:1]: "\prusntyfil01\home$\SU012236\Documents\project\raws\20250619_h10n3_DS\DS\Tris_02.raw" ---> System.Exception: boost::filesystem::status: Incorrect function [system:1]: "\prusntyfil01\home$\SU012236\Documents\project\raws\20250619_h10n3_DS\DS\Tris_02.raw"
at pwiz.CLI.msdata.ReaderList.read(String filename, MSData result, Int32 runIndex, ReaderConfig config)
at pwiz.ProteowizardWrapper.MsDataFileImpl..ctor(String path, Int32 sampleIndex, LockMassParameters lockmassParameters, Boolean simAsSpectra, Boolean srmAsSpectra, Boolean acceptZeroLengthSpectra, Boolean requireVendorCentroidedMS1, Boolean requireVendorCentroidedMS2, Boolean ignoreZeroIntensityPoints, Int32 preferOnlyMsLevel, Boolean combineIonMobilitySpectra, Boolean trimNativeId) in C:\proj\skyline_25_1\pwiz_tools\Shared\ProteowizardWrapper\MsDataFileImpl.cs:line 200
at pwiz.Skyline.Model.Results.OpenMsDataFileParams.OpenLocalFile(String path, Int32 sampleIndex, LockMassParameters lockMassParameters) in C:\proj\skyline_25_1\pwiz_tools\Skyline\Model\Results\OpenMsDataFileParams.cs:line 42
at pwiz.Skyline.Model.Results.ChromCacheBuilder.BuildCache() in C:\proj\skyline_25_1\pwiz_tools\Skyline\Model\Results\ChromCacheBuilder.cs:line 191
--- End of inner exception stack trace ---
|
| view request |
| Chromatogram Information Unavailable |
| (1 response) |
olivia schwartz |
2025-06-23 16:10 |
|
Hello!
I've been learning to use Skyline and wanted to, for now, test inputting a transition list with just the internal standard but keep getting "Chromatogram Information Unavailable" when uploading files that I've confirmed have the internal standard detected well. This was data from a Q Exactive HF using DDA, and the internal standard is DL-Tyrosine (3,3-D₂) (HOC6H4CD2CH(NH2)COOH).
I also notice if I omit the precursor and product m/z columns, Skyline will denote 186 as the precursor instead of 184, so I am not sure if there is a discrepancy in my transition list?
I have attached an .mzML that should show detection for this compound along with the transition list I tried.
Thanks!
|
| Standards_Library_Test_D2Tyrosine.csv |
| view request |
| No automatic pick children for isotopic envelope |
| (1 response) |
karamj33405 |
2025-06-23 11:17 |
|
For some analytes (PFAS/small molecule) Skyline is not automatically recognizing the M+1 and M+2 even though they are in high abundance (as shown in screenshot). Occasionally it will only show the M+1. Is there a setting I need to turn on to resolve this? Thanks!
|
| SkylinePickChildrenSS.png |
| view request |
| Unable to connect Skyline to UNIFI |
| (2 responses) |
bkraft |
2025-06-19 08:59 |
|
I have been troubleshooting the Skyline connection our UNIFI system, but have not been able to get it to work. The UNIFI API is working as we have Protein Metrics Byos working without issue. When I attempt to connect from Skyline, I get the following error, which indicates a certificate issue (even though the certificate is installed and not expired):
System.Reflection.TargetInvocationException: There was an error communicating with the server: One or more errors occurred. ---> pwiz.Skyline.Model.Results.RemoteApi.RemoteServerException: There was an error communicating with the server: One or more errors occurred. ---> System.AggregateException: One or more errors occurred. ---> System.Net.Http.HttpRequestException: An error occurred while sending the request. ---> System.Net.WebException: The underlying connection was closed: Could not establish trust relationship for the SSL/TLS secure channel. ---> System.Security.Authentication.AuthenticationException: The remote certificate is invalid according to the validation procedure.
The connection works if Skyline is installed on the UNIFI computer and we use "localhost" but using the IP address or Hostname results in failed connection. Multiple computers running Skyline cannot make the connection. What certificate am I looking for and what configuration is wrong? Waters support has not been able to identify the issue at this time.
|
| view request |
| Having Issues Importing Demultiplexed data into Skyline after update to v. 25.1 |
| (3 responses) |
nikkib5 |
2025-06-20 11:56 |
|
After I updated Skyline to the newest version 25.1.0.142, I began having problems importing data. I am using Skyline in the small molecule interface. I am attempting to import demultiplexed data acquired from an IMS-QTOF. I use PNNL to demultiplex my data. I noticed that when using a previous version of Skyline (available on other computers in my lab), I am able to import the same files without altering the data files at all. I am attaching a screen shot of the error that occurs when I try to import data. I am also attaching a note file with copies of some of the errors on the individual data files. I have also attached a screenshot of my PNNL settings in case that has any effect on the error.
Is it possible to revert Skyline to an older version?
|
 examples of error codes.txt error importing resulsts.PNG pnnl settings.PNG examples of error codes.txt error importing resulsts.PNG pnnl settings.PNG |
| view request |
| Problem creating library using PD3.1 results. |
| (2 responses) |
davidl |
2025-06-06 11:23 |
|
Hello,
Finally upgraded to using PD 3.1 instead of PD 1.4 to import my Sequest search results from DDA runs into Skyline to create spectral libraries. I'm getting the error reported by others in earlier posts when creating spectral libraries using PD3.1(no such table: MassSpectrumItems). I've tried the newest Skyline Daily (Skyline (64-bit) 25.1.0.142 (7401c644b4)) without success. Any suggestions? I've attached the error details.
Thank you for the help,
Larry David
|
 Errors.docx Errors.docx |
| view request |
| Reimporting the same files into previously analyzed Skyline file (From the last year) resulted in different areas |
| (6 responses) |
anokhina |
2025-06-09 14:04 |
|
I have a question regarding Skyline. I am trying to incorporate more files into my skyline document. I incorporated the same files again (previously, I already analyzed them). I import the same files into previously analyzed and I see 2-fold intensity differences... I was wondering why it could be the case...
Thank you,
Vika
|
| view request |
| DIANN 2.0 speclib import failure |
| (1 response) |
matthew.r.russell |
2025-06-17 06:25 |
|
Dear Skyline team
I've been trying out the new DIANN 2.0 (2.2.0 in my case).
I have attached the parquet.skyline.speclib and parquet files required to reproduce the issue and a screen shot of my import wondow.
I get the error MRT_profile_report_library2.parquet does not have a column called Global.Q.Value I've checked the file MRT_profile_report_library2.parquet by importing it into R with arrow. IT does seem to have a column Global.Q.Value.
I would be really greatful if you help me get over this bump. The feature looks really useful for reviewing DIANN data.
Best wishes
Matt
Skyline
ERROR: file MRT_profile_report_library2.parquet does not have a column called Global.Q.Value
Command-line: C:\Users\mbpssmr9.DS\AppData\Local\Apps\2.0\TT108PNJ.HWT\RVTC6LRP.CKL\skyl..tion_9286511f3362df93_0019.0001_31a2f7d2aa6cc5be\BlibBuild -s -A -H -o -c 0.95 -i MRT_400ng_test -S "D:\Repositories\p23_02_09_JAC_VionForProteomics\skyline\MRT_400ng_test.redundant202506170221.stdin.txt" "D:\Repositories\p23_02_09_JAC_VionForProteomics\skyline\MRT_400ng_test.redundant.blib"
Working directory: D:\Repositories\p23_02_09_JAC_VionForProteomics\diann_out\mrt\25_06_11_MRTprofile
Exit code: -2147483645
OK More Info
Skyline (64-bit) 25.1.0.142 (7401c644b4)
System.IO.IOException: ERROR: file MRT_profile_report_library2.parquet does not have a column called Global.Q.Value
Command-line: C:\Users\mbpssmr9.DS\AppData\Local\Apps\2.0\TT108PNJ.HWT\RVTC6LRP.CKL\skyl..tion_9286511f3362df93_0019.0001_31a2f7d2aa6cc5be\BlibBuild -s -A -H -o -c 0.95 -i MRT_400ng_test -S "D:\Repositories\p23_02_09_JAC_VionForProteomics\skyline\MRT_400ng_test.redundant202506170221.stdin.txt" "D:\Repositories\p23_02_09_JAC_VionForProteomics\skyline\MRT_400ng_test.redundant.blib"
Working directory: D:\Repositories\p23_02_09_JAC_VionForProteomics\diann_out\mrt\25_06_11_MRTprofile
Exit code: -2147483645 ---> System.IO.IOException: ERROR: file MRT_profile_report_library2.parquet does not have a column called Global.Q.Value
Command-line: C:\Users\mbpssmr9.DS\AppData\Local\Apps\2.0\TT108PNJ.HWT\RVTC6LRP.CKL\skyl..tion_9286511f3362df93_0019.0001_31a2f7d2aa6cc5be\BlibBuild -s -A -H -o -c 0.95 -i MRT_400ng_test -S "D:\Repositories\p23_02_09_JAC_VionForProteomics\skyline\MRT_400ng_test.redundant202506170221.stdin.txt" "D:\Repositories\p23_02_09_JAC_VionForProteomics\skyline\MRT_400ng_test.redundant.blib"
Working directory: D:\Repositories\p23_02_09_JAC_VionForProteomics\diann_out\mrt\25_06_11_MRTprofile
Exit code: -2147483645
Output:
Reading results from MRT_profile_report_library2.parquet.skyline.speclib.
Read 11930 entries from speclib.
ERROR: file MRT_profile_report_library2.parquet does not have a column called Global.Q.Value
---> System.IO.IOException: ERROR: file MRT_profile_report_library2.parquet does not have a column called Global.Q.Value
Command-line: C:\Users\mbpssmr9.DS\AppData\Local\Apps\2.0\TT108PNJ.HWT\RVTC6LRP.CKL\skyl..tion_9286511f3362df93_0019.0001_31a2f7d2aa6cc5be\BlibBuild -s -A -H -o -c 0.95 -i MRT_400ng_test -S "D:\Repositories\p23_02_09_JAC_VionForProteomics\skyline\MRT_400ng_test.redundant202506170221.stdin.txt" "D:\Repositories\p23_02_09_JAC_VionForProteomics\skyline\MRT_400ng_test.redundant.blib"
Working directory: D:\Repositories\p23_02_09_JAC_VionForProteomics\diann_out\mrt\25_06_11_MRTprofile
Exit code: -2147483645
at pwiz.Common.SystemUtil.ProcessRunner.Run(ProcessStartInfo psi, String stdin, IProgressMonitor progress, IProgressStatus& status, TextWriter writer, ProcessPriorityClass priorityClass, Boolean forceTempfilesCleanup, Func3 outputAndExitCodeAreGoodFunc, Boolean updateProgressPercentage) in C:\proj\skyline_25_1\pwiz_tools\Shared\CommonUtil\SystemUtil\ProcessRunner.cs:line 206 --- End of inner exception stack trace --- --- End of inner exception stack trace --- at pwiz.Common.SystemUtil.ProcessRunner.ThrowExceptionWithOutput(Exception exception, String output) in C:\proj\skyline_25_1\pwiz_tools\Shared\CommonUtil\SystemUtil\ProcessRunner.cs:line 266 at pwiz.Common.SystemUtil.ProcessRunner.Run(ProcessStartInfo psi, String stdin, IProgressMonitor progress, IProgressStatus& status, TextWriter writer, ProcessPriorityClass priorityClass, Boolean forceTempfilesCleanup, Func3 outputAndExitCodeAreGoodFunc, Boolean updateProgressPercentage) in C:\proj\skyline_25_1\pwiz_tools\Shared\CommonUtil\SystemUtil\ProcessRunner.cs:line 248
at pwiz.BiblioSpec.BlibBuild.BuildLibrary(LibraryBuildAction libraryBuildAction, IProgressMonitor progressMonitor, IProgressStatus& status, String& commandArgs, String& messageLog, String[]& ambiguous) in C:\proj\skyline_25_1\pwiz_tools\Shared\BiblioSpec\BlibBuild.cs:line 493
at pwiz.Skyline.Model.Lib.BiblioSpecLiteBuilder.BuildLibrary(IProgressMonitor progress) in C:\proj\skyline_25_1\pwiz_tools\Skyline\Model\Lib\BiblioSpecLiteBuilder.cs:line 152
|
 MRT_profile_report_library2.parquet.skyline.speclib MRT_profile_report2.parquet BuildLib.PNG MRT_profile_report_library2.parquet.skyline.speclib MRT_profile_report2.parquet BuildLib.PNG |
| view request |
| method export for "Thermo Stellar" |
| (1 response) |
qin fu |
2025-06-06 15:11 |
|
Hello Skyline support team
I am trying to export a PRM method, but "instrument Type" does not have "Thermo Stellar" choice, did I miss something in my skyline setting? or should I just use "Thermo"? Thank you in advance for your help.
Qin Fu
|
| view request |
| Long molecule name in plots, only first letters shown |
|
per larsson |
2025-06-18 05:21 |
|
Hello,
I use quite long molecule names and only the first letters are shown in the plots. For example, when comparing RTs it is hard to see molecule name on x-axis from the first letters. Is there a way to modify how many letters of the molecule name is plotted as a label on the x-axis to get the full name plotted?
The same for goes for the peak annotations in the chromatogram.
Regards,
|
| view request |
| GPF Method generation for Stellar |
| (5 responses) |
maithreyan kuppusamy |
2025-06-06 00:30 |
|
Hi,
I am trying to use PRM conductor to generate the GPF method for Stellar. But I get some error (I have attached a screenshot). Could you please let me know what could be wrong here?
best,
Maithy
|
| Screenshot 2025-06-06 092908.png |
| view request |
| Extracting adducts in Skyline with Proteomics interface |
| (5 responses) |
Josh Baeza |
2025-06-16 11:56 |
|
Dear Skyline team,
I am troubleshooting a salt contamination in my LCMS system and can observe Na+ and K+ adducts in a peptide mapping system suitability sample. Is there a way to extract precursors with the different salt adducts. I would like to use this to extract peak areas of each species and report a relative abundance of each adduct species.
Best,
Josh
|
| view request |
| Advanced peak picking model issue: the scoring is not correct for internal standard mixed sample |
| (2 responses) |
lxiiaanog |
2025-06-16 00:20 |
|
Dear Skyline team,
I am trying to use mProphet peak picking to facilitate identification, but encountered a problem as described below.
I have four synthesized peptides that are unlabeled (light), and over 500 synthesized peptides that are heavy lysine encoded (heavy) and cover the sequences of the four light peptides. Then I mix them together for DIA acquisition.
In Skyline, I use the heavy peptides as internal standard, and use the Reintegrate function to apply mProphet for peak picking. I expect to see that only the four overlapped peptides are identified (detection q value < 0.01). However, almost all peptides have q value<0.01, meaning that almost all of them are identified, which is incorrect.
I see that in the light and heavy peptides share the same q values. So I removed the heavy peptides in the file and re-did Reintegrate. This time only around 20 peptides have q value<0.01, showing that the incorrect hits are significantly decreased.
Does it mean that the heavy peptides are not separetly regarded as internal standards but instead scored together? Could you teach me how to circumvent this issue to enable a more reasonable re-integration?
I attached the related file in the File Sharing Folder with name: mProphet-Issue20250616.sky.zip. Please let me know if I did not clarify the question.
Many thanks!
Li
|
| view request |
| Can skyr files define Number Format? |
| (1 response) |
TY |
2025-06-16 18:54 |
|
Hi Team,
I use the same report template when exporting reports, but I have to manually change the number format of the columns each time.
Is it possible for a skyr file to define not only the column arrangement but also the number format for each column?
Thank you,
TY
|
| view request |
| no isolation list export possible for ZenoToFF |
| (1 response) |
chi nguyen |
2025-06-12 10:19 |
|
Hello Skyline team,
I am using skyline version 25.1 trying to work with data from a ZenoToFF 7500.
I have the precursor list ready from DIA runs analyzed in Skyline. However, when I tried to export the isolation list for a MRMHR (PRM) method on ZenoToFF, skyline keeps giving me the error "there is no isolation list data to export".
I attached here the screen shot of
- the error messages
- the Settings/Transition Settings/Full Scan tab
- the File/Export Isolation list
pls let me know if there is anything else you need.
many thanks
Chi
|
| Error message.docx |
| view request |
| peak picking |
| (7 responses) |
heyang |
2025-05-12 15:02 |
|
Hi Skyline team,
As seen in attached, skyline selected a tiny peak due to its closest rt. Could Skyline select the strongest one within rt window?
Thanks,
Heyi
|
| Peak picking Problem 1.png |
| view request |
| Direct Injection |
| (4 responses) |
sam lord |
2025-06-10 09:37 |
|
Good afternoon,
I was wondering if it was possible to use skyline to import data acquired via a manual direct injection. I have injected a peptide directly into the mass spec and acquired data from both MS1 and MS2 and I want to use skyline to confirm that the peptide of interest is present. I acquired the data manually by an MS1 full scan followed by MS2 with increasing CE until I saw the precursor peak disappear. The entire acquisition is around 2 minutes. I tried uploading this raw file into Skyline but there is no chromatogram showing up despite the raw file showing spectra on Freestyle.
Any help would be much appreciated.
Thanks,
Sam
|
| view request |
| Can Skyline calculate CCS error between Explicit and IM Library CCS values? |
|
Stelios Papazoglou |
2025-06-12 03:09 |
|
Good morning Skyline team,
I'm working with ion mobility data from different IMS instruments and would like to know if it's currently possible to calculate CCS error directly within the software by comparing:
- Explicit CCS values (reference values entered manually), and
- Ion Mobility Library CCS values (experimental, obtained using the “Use Results” )
Is this currently supported in Skyline?
If not, is there any workaround within Skyline to achieve this kind of calculation?
This feature would be very useful for validating CCS accuracy and monitoring shifts during IMS data analysis and especially when comparing CCS values across different instruments.
Thanks you for your help!
Stelios
|
| view request |
| opening mzml file for small molecules |
| (1 response) |
robyn eisert |
2025-06-10 10:53 |
|
Hi,
I downloaded an mzml file and the accompanying .wiff file for a small molecule. I am not very familiar with these since I do proteomics on Thermo instruments, but someone asked if I can take a look. I generated a transition file, but when I import the mzml file or the wiff file I get the errors shown below (I just removed the original name of the file for confidentiality). I am wondering if I made a mistake in the transition list or if there's a setting I got wrong since I am not as familiar with sciex or SWATH data. Is there a good tutorial that can help me out?
At 1:23 PM:
Failed importing results file 'file.mzML'.
[SpectrumList_mzML::create()] Bad istream.
At 1:48 PM:
Failed importing results file 'file.wiff'.
[SpectrumImpl::getDataSize()] Could not open data stream. Is a required 'scan' file missing?
Thanks!
|
| view request |
| Importing .wiff data files into Skyline (molecule interface) |
|
adeline shanker |
2025-06-10 10:26 |
|
Hello,
I'm trying to import .WIFF files from a Sciex instrument into skyline and this error message keeps popping up (image attached). This is my first time importing files from a Sciex MS and I'm not really sure what I'm doing wrong, so I thought I would reach out. Thank you for your help with this!
Best,
Adeline
|
| Capture.JPG |
| view request |
| Import DIA Peptide Search results from Spectronaut |
| (4 responses) |
n prust |
2023-03-29 06:12 |
|
Hi,
I followed the Webinar yesterday about how to use DIA results/libraries for SRM method setup/optimization.
I was now trying to do it myself using a Spectronaut output instead of EncyclopeDIA. I already asked yesterday during the webinar if this is possible and the link you provided says that I can use a csv SN output file. However I tried both building a library using the SN report file in .tsv format and using an existing library created with SN.
When trying to build the library I get the Error: Error getting score type for this file. The csv format as stated on the website https://skyline.ms/wiki/home/software/BiblioSpec/page.view?name=BlibBuild is not even supported, so I cannot use that one.
When trying to use an existing library I am having the issue that the library format (.kit) from SN is not supported.
I feel like I am missing something here.
Do you have any information how I can Import DIA peptide search results from SN?
Cheers,
Nadine
|
| view request |
| Standard curve regression line not showing |
| (2 responses) |
stefan broeer |
2025-06-05 21:11 |
|
I quantify analytes with heavy isotope standards. Sometimes there is an odd standard where the ratio to heavy could not be calculated.
Then skyline does not show the regression line. To improve the fit standards can be excluded but for that they have to show up on the graph.
How can you delete standards that could not be calculated (NaN or similar) or show the regression line for the remaining standards?
|
| view request |
| Reimporting the same files into previously analyzed Skyline file (From the last year) resulted in different areas. |
|
anokhina |
2025-06-09 14:01 |
|
I have a question regarding Skyline. I am trying to incorporate more files into my skyline document. I incorporated the same files again (previously, I already analyzed them). I import the same files into previously analyzed and I see 2-fold intensity differences... I was wondering why it could be the case...
Thank you,
Vika
|
| view request |
| Calibration Curve LLOD and LLOQ |
| (6 responses) |
sam lord |
2025-06-04 01:46 |
|
Hello Skyline,
I am trying to calculate the LLOQ and LLOD for my heavy internal standards from my calibration curve. I am using a set concentration of light internal standard to normalise the peak area of the heavy peptide. Therefore in the peptide settings in skyline I have set "Internal Standard Type" to Light and the "Normalisation Method" to Ratio to Light. When I look at the standard curve it correctly shows the peak area (y-axis) as a Heavy to Light Ratio, but it also shows the concentration (x-axis) as a Heavy to Light Ratio - See image attached. Ideally I don't want the concentration to be normalised against the Light as I want to work out the LLOD and LLOQ of the heavy concentration. Is there a way to change this so the concentration axis is just showing the Heavy?
Many thanks,
Sam
|
| CalCurve.png |
| view request |
| [M+5] isotope peaks for small C-13 labelled molecules |
| (3 responses) |
CM |
2025-06-04 04:10 |
|
Hello Skyline Team,
I was reading this discussion thread hoping to find some answers for my current situation and am wondering if anything has changed with regards to the MS1 filtering feature since the original post in 2019. I am working with MS1 data from small molecules labelled with C-13 and am hoping to see isotope peaks up to M+5 in some cases. However, I can only see up to M+3. I currently have the Full Scan settings set to Isotope Peaks included = Count, and Peaks = 6. Would altering the "Isotope labelling enrichment" settings under the Full-Scan transition settings tab help with this or is there another option to see those higher M+X isotope peaks?
I am working on a Windows 11 device and am currently using Skyline 24.1.
Thanks so much for your helpful software and support.
CM
|
| view request |
| SCIEX QTRAP MRM+EPI |
|
Roberto |
2025-06-04 07:43 |
|
Hi Skyline team, I am working with pseudo-targeted metabolomics and recently performed a batch run that included an Enhanced Product Ion (EPI) experiment to observe M1 ion fragmentation. However, when importing the data into Skyline (using the small molecule interface), I can only visualize the MRM transitions and not the EPI-derived fragments.
Is there a way to configure Skyline to display the transitions or spectra from the EPI experiment?
|
| view request |
| How to set skyline to analyze LTQ SIM data |
| (5 responses) |
guo xue |
2025-05-29 03:12 |
|
Hello skyline team, I have some SIM data acquired from LTQ, where I look for D2HG mass in negative mode. In the raw file I can see one peak with MS 2 spectrum. However when I import the data to skyline, I could only see chromatogram information unavailable. I am not too sure how to set for the transitions and transition settings. could you please help me? thank you very much.
|
| view request |
| Masses for charge state 1 are not appearing. |
| (2 responses) |
PP |
2025-05-22 12:31 |
|
Hello,
Could you please help me understand why I’m not seeing any masses for the +1 charge state, while I am seeing them for the +2 and +3 charge states?
|
| APOC1.sky.zip |
| view request |
| CE optimized spectral libraries not based on intensities but transition rank distribution |
|
max gilbert |
2025-05-28 02:40 |
|
Dear Skyline-Team,
I have the following situation:
I set up a PRM experiment to optimize CE for my synthetic peptides and labeled reference peptides by running them at different CEs in different injections (15 raw files - each run acquired with a different CE value).
Now, from visual inspection, I can determine at which CE the peak area is highest and a CE which results in my prefered transition rank distribution (e.g. sometimes the highest area comes from y1 or y2 fragments which I would like to exclude from analysis).
So now, I would like to include the spectra from my preferred CE setting into a spectral library - for each peptide this could be different of course - sometimes I want to optimize for area, sometimes for transitions.
What would be the best option to do that?
If I just "Build" a library from my combined dataset, there is no way to influence which spectra will be added to the library.
Could you point me in the right direction? Maybe I am missing something here ...
I know from the tutorial that I can automatically let Skyline optimize CE values, but as far as I understood it does that only for "Area", which sometimes is not something I want to do.
Thank you very much in advance!
Best,
Max
|
| view request |
| Mark many transitions as non-quantitative |
| (7 responses) |
lincolnh |
2025-05-20 11:03 |
|
Hi Skyline team,
I'm wondering if there is a way to mark a large number of transitions as "Not Quantitative" after filtering according to some criteria. In the screenshot I've attached, I'm looking at the Document Grid and have filtered transitions according to "Shape Correlation" (i.e., shape correlation < 0.9). Now I want to deselect "Quantitative" for every transition left in the Document Grid. There are on the order of 10,000 transitions, so I can't do this by hand. Is there an automated way to do this?
The other approach would be Actions > Delete Transitions, but I don't think this is what I want, as removing transitions will effect peak scoring.
A related question is after marking transitions as non-quantitative, should I perform rescoring with Refine > Reintegrate? I'm primarily concerned with peptide quants, and ultimately want to export a Skyline document with peptide quants for each run. If I want the changes I make to take effect, do I need to do rescoring?
Thanks,
Lincoln
|
| Screen Shot 2025-05-20 at 10.45.33 AM.png |
| view request |
| error loading fragpipe results into skyline |
| (3 responses) |
jdemeter |
2025-05-27 12:01 |
|
Hi,
I am trying to load results using a fragpipe dda workflow into skyline and got this error. I asked fragpipe help, but they think it is a skyline error. Can you please take a look?
Thank you,
Janos
|
| log_2025-05-27_11-01-37.txt |
| view request |
| Generate Calibration Curve from specific samples (standard curve samples) |
| (1 response) |
helmi |
2025-05-27 03:22 |
|
Hello!
My lab made a standard curve mixing 4 different Ceramide Standards with the concentrations 100µM - 75µM - 50µM - 25µM - blank.
So I have 5 samples that were measured with an Obritrap, one sample called 100µM with 100µM of all of the 4 Ceramide Standards and the same for the rest.
I also have 6 biological samples that need to be quantified for Ceramides. They do not contain the standards.
I have been tasked with making a calibration curve to quantify the ceramides in the 6 biological samples.
Everything worked well with the transition list, importing results and setting up the calibration curve. The R-squared and calculated concentrations look fine but I worry that this method is not correct as the standards are not present in the biological samples but Skyline pretends that they are.
But when I add the concentrations of the ceramides to the Document Grid it fills in those concentrations for every molecule. And I cannot choose which calibration curve I want to use in the Document Grid.
I either need a "Surrogate Calibration Curve" / to choose with Calibration Curve to use or to choose from which molecules and samples the calibration curve should be created.
(Issue 964 Feature Request might work but I cannot find this in Skyline)
I use Skyline daily with the Molecule Interface.
Sorry for the long text
|
| view request |
| Performing quantitation of native analyte concentration WRT labeled standard in a document grid |
| (2 responses) |
kapil mandrah |
2025-05-26 07:40 |
|
Dear Skyline team,
I am a user of Skyline for small-molecule analysis.
I wanted to quantify native analyte (small molecule) concentration in blood-based samples using labeled standards (based upon absolute quantitation). I usually import the transition list with native-labeled transition pairs for the targeted small-molecule list, with light-heavy combination. However, an error occur all the time related to document setting i.e., saying "the isotope modification type heavy does not exist in the documents settings" before error checks, while identify column for the option "Label type". Thus, it stops importing the transition list. But, I always set internal standard types "heavy" in the molecule settings. On the other hand, there is no error occur when ignoring this column, hence the transition list gets imported. Can you please suggest, which document settings need to be changed or modified? as I checked all the options but couldn't figured it out. So, that I can quantify absolute native concentrations in the samples using the calibration curve generated with labeled standards using a document grid in Skyline.
I am attaching a transition list I use in .xlsx file and screenshots of the errors in a .pptx file for your check.
Thank you.
Kind regards,
Kapil
|
Skyline list_target.xlsx  Screenshots.pptx Screenshots.pptx |
| view request |
| Integration threshold |
| (5 responses) |
a rocher |
2025-04-01 23:02 |
|
Hello, I'm working on the Small Molecule part of Skyline and I'd like to know how to set the integration threshold (not the display threshold). I don't want intensities below 1E4 to be integrated, for example. Thank you and have a nice day. Amandine
|
| view request |
| Feature request: Logistic fit function for quantification |
| (2 responses) |
MT |
2025-05-23 02:45 |
|
Dear Skyline-Team,
I hope this is the right place for my inquiry.
I do absolute peptide quantifications on TQs and Orbitraps using isotope labeled heavy internal standards and calibration curves.
The workflow contains an immunoenrichment step, which is why antibody kinetics have a great influence on the calibration curve shape (usually sigmoidal even on log scale).
Currently, I use Skyline only for the peak integration; quantification and evaluation is subsequently done in Excel and Origin. I would love to do the quantification with Skyline but, as far as I know, Skyline does not support a logistic fit model. Would it be possible to implement this kind of fit in the quantification tab?
Most vendor software (including SciexOS, TraceFinder, and XCalibur) have only linear fit models available, thus this is a real need in the IA-LC-MS/MS community.
Thank you in advance!
Best regards,
Tobias
|
| view request |
| import of parquet spectral library from DIANN 2.0 and above into skyline |
| (15 responses) |
dkueltz |
2025-04-15 22:52 |
|
Since version 2.0 DIA-NN no longer generates speclib files for its spectral libraries but instead only parquet files. I used to be able to import the speclib libraries into Skyline but since they are no longer generated by DIA-NN I wonder how I can import the parquet libraries into Skyline. The direct link from DIA-NN to Skyline (Skyline button in DIA-NN) never worked for me but importing the DIA-NN generated spectral libraries worked well until DIA-NN version 2.0 when the speclib libraries are no longer generated. The DIA-NN developers told me that Skyline will soon have parquet import capability - is this already a function that is available in Skyline Daily? If, so where can I find it?
Thanks much,
Dietmar
|
| view request |
| v25.1 support on Sciex data |
|
heyang |
2025-05-23 07:08 |
|
Hi Skyline team,
Is v25 still support on Sciex raw data reading? Thanks,
Heyi
|
| view request |
| Offline (Unplugged) AutoQC Installer |
| (1 response) |
arthur nuccio |
2025-05-21 12:13 |
|
Hi All,
Is there a *.zip for an unplugged installer for AutoQC? We are unable to use the weblink due to our IT policies. I was able to find the unplugged installer for Skyline and installed that without problems.
Regards,
Art
|
| view request |
| changing name/location of raw data |
| (5 responses) |
tannous |
2017-11-08 11:40 |
|
Hi,
I was not aware that if the raw file path changes, for ex, if I change the location of the raw data (ie put it in a new subfolder within the same folder) or change the name of the folder where the raw data is, skyline cannot find it anymore. by find it I mean for ex, if I click on a peak to see the full scan, it does not work and it tells me it cannot find the raw file.
Sometimes I have to change the name of the folder or the location of the raw data within the folder to reo-organize as I accumulate more data .
Is there a way around that? for example, is there a way that skyline can still find the original raw data file as long as the name of the raw file itself is not changed?
thanks
Abla
|
| view request |
| Parent-ion scanning |
| (15 responses) |
r bagshaw |
2015-07-22 09:38 |
|
Hello,
Will Skyline be able to interpret a RAW file from a parent-ion scanning experiment? In the experiment I specifically want to see parents of a product that is 85. Setting a transition consisting of a parent mass of something I expect to see in the sample with a fragment ion of 85 does not produce a chromatogram in skyline. (this is small molecule work)
Can you comment on this?
Thanks!
--Rick
|
| view request |
| in silico spectral library |
| (3 responses) |
mazzouny |
2025-05-19 14:27 |
|
Hi,
I want to create an in-silico MS/MS library that I would do myself, is there any tutorial on this or a dummy file that can be changed. Also, does skyline allow creation of spectra library from QQQ data ?
|
| view request |
| Allow integration of multiple isotopes for high molecular weight fragments (Top-Down PRM) |
| (10 responses) |
v delcourt |
2018-10-10 03:48 |
|
Hi,
With recent analytical chemistry publication, there's something interesting to do with multiplexed top down PRM (https://pubs.acs.org/doi/abs/10.1021/acs.analchem.8b02699).
While doing some experiments on my side, I thought this was indeed interesting, but there might be something to add to Skyline to complete data analysis of these experiments. Indeed, in case of high molecular weight (with charge > 1), it's very likely that fragments' most abundant isotope would not be the monoisotopic. However, Skyline seems to integrate only the first one (see capture attached). Maybe this feature is already implemented but I couldn't find it.
By adding all/multiple isotopes to target ions integration, this would increase detected signal intensity which would affect results significantly.
I can send data if needed.
Best regards,
Vivian
|
| topdown_prm.PNG |
| view request |
| autoqc cannot authorize |
| (1 response) |
wphipps5 |
2025-05-15 17:35 |
|
The Hoofnagle squad is having trouble with our AutoQC authorization. both Alex (aemmanue@uw.edu) and I have tried unsuccessfully to import our config file to new version of AutoQC.
I attached a screenshot.
Thanks for any help
Bill
|
| screenshot.PNG |
| view request |
| Normalization Using Heavy Internal Standard |
| (11 responses) |
weitmanm |
2025-05-06 10:43 |
|
Hey Skyline team!
I’m working on a small molecule metabolomics project using Skyline with PRM data from an Orbitrap. I’ve added a heavy-labeled internal standard (identical to my target molecule except for the isotopic label) and want to normalize my results with it. I’d love to focus the normalization on a specific fragment ion since its chromatogram is cleaner and more specific, with less noise compared to the precursor, which shows more interference.
I’ve already done the peak integrations for both light (target) and heavy (standard) forms. In the Molecule Settings > Quantification tab, I’ve set:
Regression fit: None (no absolute quantification needed)
Normalization method: Ratio to Heavy
Simple precursor ratios: Unchecked (to focus on a fragment)
MS level: 2 (to target MS2 data for fragment ions)
Units: Default
Figures of merit: All set to None or blank
Could you please confirm if these settings are correct for normalizing the light-to-heavy ratio using a specific fragment for both? If adjustments are needed, I’d really appreciate your advice on how to proceed.
Also, after applying the normalization, how can I view the normalized values in Skyline to check and export them? Lastly, in the final report I export, will it include both the original values and the normalized values?
Thanks so much for your help!
Michal
|
| view request |
| Retain only human proteins |
| (2 responses) |
akhilabrai |
2025-05-14 02:52 |
|
Hi team,
I’m currently working with an indexed FASTA file that includes proteins from multiple species, which has led to identifications from non-human sources as well. Is there a way to filter or retain only human proteins and exclude those from other species?
Thank you.
Akhila
|
| view request |
| Guidance Required on Exporting mzIdentML File from Skyline |
| (2 responses) |
cvadival |
2025-05-09 07:51 |
|
Hello Team,
We are currently in the process of submitting data to the PRIDE database, which requires both the raw data files and result files in the mzIdentML format.
Could you please guide us on how to extract the result file in mzIdentML format from Skyline after analyzing our data?
Thank you for your support.
Thanks
VC
|
| view request |
| ddMS2 (LC-QExactive, Orbitrap by Thermo) |
| (3 responses) |
yohan seol |
2025-05-09 07:09 |
|
Dear Skyline team,
I am using LC-QExactive (Orbitrap) and measured samples with Full Scan/ddMS2 method.
My issue is that I always have an message "do you want to enable Auto-select and use the document settings to manage these new transitions?".
If I do not click "Enable", I cannot see my precursor ions (MS1).
Secondly, I cannot see my MS2. I checked it with XCalibur (Qual browser) which is a Thermo software.
I think the main issue is the mass accuracy (10 ppm) does not work for MS1 and MS2, even though they are set in Transition Settings.
It would be really great if you can help me out.
Best regards,
Yohan Seol
|
| 2025-05-08_BAC analysis 07.sky.zip |
| view request |
| GC-MS SIM: Molecules and Fragments not found |
| (9 responses) |
stefanie orter |
2025-02-18 05:54 |
|
Hi,
I tried to import SIM-Data files, but only a few of the m/z were found (see attached screenshot). The full-scan files, on the contrary, can be perfectly imported and do show peaks. The SIM files are in the uploaded zip-folder "GCMS_Sim". I asked more experienced colleagues and we tried many different settings but the m/z of many molecules and their fragments cannot be found.
What is the problem?
Thank you in advance,
Stefanie
|
| Screenshot 2025-02-18 135550.png |
| view request |
| Oxonium ion profiles |
| (12 responses) |
mmakrid |
2025-04-29 11:19 |
|
Hello,
Is there a way to generate oxonium ion profiles in skyline by extracting specific m/z ranges (such as: 204.08-204.10) across a DDA spectrum? I am working in glyco peptides and need this information to further confirm the glyco-modifications. Oxonium ions are found as fragments of the precursor ions.
Thanks a lot in advance for your help.
Manousos
|
| view request |
| PRM-Quantification |
| (2 responses) |
akhilabrai |
2025-05-07 08:06 |
|
Hello team!
I’m working on a proteomics project using Skyline with PRM data from an Orbitrap Fusion. I’ve spiked 50 fmol of heavy peptides for all the samples and want to normalize my results with it.
I am attaching the image as a reference and the zip file is shared through https://skyline.ms/files.url PRM_24_1_05072025.sky.zip). Could you please check the file and let me know why I'm not getting fold change values for most of the proteins?
I’d really appreciate your advice on how to proceed.
Thank you
Akhila
|
| Comparison_foldchange.PNG |
| view request |
| IQ-X mzML files cannot be read |
| (1 response) |
Yasin |
2025-05-04 05:33 |
|
Hello,
IQ-X mzML files converted via MSconvert (3.0.25120-02fc3ac) can not be loaded and give the error:
"
At 2:28 PM:
Failed importing results file 'C:\PostDoc\Project_MetallPreliminary\Yasin\Metalls_in_Mushrooms\after_capillary_replacement\mzML\BB.mzML'.
[pwiz::CLI::msdata::ReaderList::read] Invalid cvParam accession "1003411"
"
looking into the file the accession looks like this:
  <referenceableParamGroup id="CommonInstrumentParams">
    <cvParam cvRef="MS" accession="MS:1003411" name="Orbitrap IQ-X" value=""/>
    <cvParam cvRef="MS" accession="MS:1000529" name="instrument serial number" value="FSN50178"/>
  </referenceableParamGroup>
Thank you for maintaining the software!
|
| view request |
| Request for Assistance with Chromatogram Export Functionalities |
| (5 responses) |
1150767964 |
2025-04-09 01:27 |
|
Dear Skyline Technical Support Team:
First and foremost, I would like to express my sincere gratitude for developing such an indispensable tool for PRM proteomics data analysis. As a long-time user, Skyline has been instrumental in advancing my targeted proteomics research.
I am writing to seek your expertise regarding two technical challenges I recently encountered:
1. High-Resolution Chromatogram Export
When exporting chromatogram images via the current interface (right click single sample's chromatogram > Save Image As), the resolution (approximately 300 dpi) falls short of the quality required for publication figures. While manual screenshot capture can improve clarity, this approach becomes impractical when processing multiple samples. Could you kindly advise if there is an undocumented high-resolution export option or whether such a feature might be considered in future updates?
2. Bulk Export of Raw Chromatogram Data
For experiments involving numerous peptides/samples, the current workflow of exporting raw chromatogram data (via Copy Chromatogram Data for individual entries) remains time-intensive. I attempted to extract raw retention times and intensities through customized reports (File > Export > Report), but the exported data failed to reconstruct chromatograms matching the quality displayed in Skyline. Is there an existing workaround for bulk export of raw chromatogram data, or could this functionality potentially be automated via the scripting interface?
Given your team’s deep understanding of user workflows, any guidance on these matters—or insights into potential solutions under development—would greatly enhance my research efficiency. I am happy to provide additional context or testing datasets if needed.
Thank you for your time and continued support. Looking forward to your guidance.
Best regards,
Meifeng
Wuhan spec-ally company
2025.04.09
|
| view request |
| not enough transition ions |
| (9 responses) |
creitzel |
2025-04-30 07:16 |
|
Hello,
I think I have a settings issue. I'm looking at the transition ions for a specific peptide and skyline is only displaying b10, b11, b12 and b18, b19, b20. When I go to transition settings > filter and change product ions to 6 it only adds b21, b22, b23 to the visible transition ions BUT I am only interested in transition ions below b12 (i.e., b11, b10, b9, b8, b7, .... etc). Do you have any suggestions for how I can visualize these b ions?
p.s. I don't believe the lower end b ions are being filtered out as a result of not being produced by the mass spec because in some cases b10, b11, b12 are not produced by the mass spec, but they are still displayed, so I think it is a settings issue.
Best,
Chelsea
|
| view request |
| timsTOF Bruker error Maximum expected frame size exceeded. |
| (13 responses) |
a l hipgrave ederveen |
2025-02-24 07:50 |
|
Recently, our acquisition software was updated from ofofControl 6.2.901 to timsTOF 6.0.8.0. Unfortunately, this seems to result in the following error for data acquired with timsTOF 6.0.8.0: "Maximum expected frame size exceeded." Please find the full error description below.
I encountered this error using Skyline-daily (64-bit) 24.1.1.398 (e8afca524). The error occurs when attempting to import the data file (specifically when acquired in timsTOF 6.0.8.0: 2024GLY00161-GSL-A01_GA2_1_433.d) into Skyline, causing the program to fail during the import process. This specific file acquired with timsTOF 6.0.8.0 does not contain any TIMS data, so I was wondering whether this could be the cause of the error.
I have included screenshots of the acquisition software of the files. Additionally, I have uploaded the Skyline files to Panorama (https://panoramaweb.org/Leiden University Medical Center - Tissue Glycomics/Troubleshooting/project-begin.view: AHE_24_024_GSL_Error.sky.zip).
Thank you in advance for looking into this issue.
Kind regards,
Agnes
At 15:25:
Failed importing results file 'Z:\instruments\TIM\Data\Tao\20250221-GSL-MS2\2024GLY00161-GSL-A01_GA2_1_433.d'.
Maximum expected frame size exceeded.
pwiz.Skyline.Model.Results.ChromCacheBuildException: Failed importing results file 'Z:\instruments\TIM\Data\Tao\20250221-GSL-MS2\2024GLY00161-GSL-A01_GA2_1_433.d'.
Maximum expected frame size exceeded. ---> System.Exception: Maximum expected frame size exceeded.
at pwiz.CLI.msdata.SpectrumList.spectrum(Int32 index, Boolean getBinaryData)
at pwiz.ProteowizardWrapper.MsDataFileImpl.HasSrmSpectraInList(SpectrumList spectrumList) in C:\proj\pwiz\pwiz_tools\Shared\ProteowizardWrapper\MsDataFileImpl.cs:line 1304
at pwiz.ProteowizardWrapper.MsDataFileImpl.get_SpectrumList() in C:\proj\pwiz\pwiz_tools\Shared\ProteowizardWrapper\MsDataFileImpl.cs:line 624
at pwiz.ProteowizardWrapper.MsDataFileImpl.get_HasCombinedIonMobilitySpectra() in C:\proj\pwiz\pwiz_tools\Shared\ProteowizardWrapper\MsDataFileImpl.cs:line 698
at pwiz.Skyline.Model.Results.FileBuildInfo..ctor(MsDataFileUri msDataFileUri, MsDataFileImpl file) in C:\proj\pwiz\pwiz_tools\Skyline\Model\Results\ChromCacheBuilder.cs:line 1409
at pwiz.Skyline.Model.Results.ChromCacheBuilder.BuildCache() in C:\proj\pwiz\pwiz_tools\Skyline\Model\Results\ChromCacheBuilder.cs:line 226
--- End of inner exception stack trace ---
|
| timsControl.png ofControl.png |
| view request |
| skyline can not read the LC information of .lcd file as MRM for peptide |
|
fengleink |
2025-05-05 22:19 |
|
when I add the peptide in skyline, and insert files of .lcd from shimadzu 8050.
there is no LC information.
|
| 20250411-混43+离子对留3_循环时间3s.lcd Desktop.rar |
| view request |
| Issue with utilizing MSInspector |
| (6 responses) |
edoud |
2023-08-25 12:28 |
|
As I develop targeted assays to share I would like to implement the CPTAC recommendations for assays using the MSinspector external tool - I've downloaded it but am getting an number of errors. I suspect many of the issues are related to it being coded in python 2.7 which is end of life. (Can't get pip installed, can't get pandas installed etc etc). All errors in the attached file. I've been messing around trying to install things in the cmd line and there are just too many issues getting versions for python 2.7.
Do you have any recs or could you give me the contact info for Yin Lu to see if they are planning on updating this tool at all? Thanks!
|
| msinspectorerrors_skylineimmediatewindow.txt |
| view request |
| Standards with different concentrations for analytes |
| (2 responses) |
sheher mohsin |
2025-04-30 16:19 |
|
Hi,
Please help me set up quant where the starting concentrations and dilutions are different for analytes. When I go to document grid, I see where I can enter concentration, but it is the same for all analytes.
Thanks,
Sheher
|
| view request |
| Guidance on Exporting mzTab or mzIdentML from Skyline for PRIDE Submission |
|
cvadival |
2025-05-02 08:43 |
|
Hello,
I am currently preparing to submit my Skyline data to PRIDE, which requires files in either mzTab or mzIdentML format. Could you please guide me on how to generate these file types from Skyline or through any alternative method?
Additionally, I would appreciate any guidance you can provide on the overall submission process to PRIDE.
Thank you very much for your assistance.
Thanks
VC
|
| view request |
| Creating spectral library using dia-PASEF data from timsTOF HT |
|
rmokoena1 |
2025-05-02 07:53 |
|
Hi Skyline Team,
I'm new to using Skyline, and I've went through some of the available tutorials to start me off.
I want to create a spectral library using dia-PASEF data, so I can do a peptide search of the data.
I've been able to upload my data using: File > Search > Run Peptide. I've managed to upload my .d folders and select my settings under the DIA workflow. My trouble is at the Conversion settings (where DIA-Umpire creates the pseudo-DDA files for searching), the preset instruments available do not have an option for the timsTOF.
How do I go about continuing with building the spectral library? Would you suggest that I should rather use dda-PASEF data for spectral library building and search my dia-PASEF data against that instead?
Thank you for your time.
From: Rethabile
|
| ConversionSettingsScreenshot.png |
| view request |
| Bruker diaPASEF .d import failure: Failed importing results file [...]'16495.d'. error reading spectrum merged=15875 frame=5716 scanStart=1 scanEnd=702 |
| (4 responses) |
Lindsay Pino |
2025-04-16 10:01 |
|
Hi team!
I've been building Skyline v 24.1 docs from DIA-NN 1.8.1 results using the “Import DIA Peptide Search” walk-through. The good news is that 4 out of my 6 files look great! The sad news is that 2 of the 6 files throw these errors. I'm not sure what could be different about these two files compared to the four that successfully imported. I'm not sure where to troubleshoot! The Skyline file is kinda big but I can get that shared if useful?
More random details if helpful:
- Isolation scheme: Results only
- Same error when I use Skyline-daily
Thanks!
Lindsay
|
| sarthy_error_1.txt sarthy_error_2.txt |
| view request |
| Peak Integration: PRM |
| (4 responses) |
owagne2 |
2025-04-29 13:42 |
|
Hello,
I spiked in my heavy peptide into the sample matrix (cell digest) containing my endogenous peptide, but during the analysis on Skyline I noticed that the endogenous peak appeared to have split into multiple peaks. When I was looking through other requests about peak splitting, Skyline staff members previously warned against integrating differing retention times between the heavy and endogenous (light) peptides, which of course makes sense.
So, my question is this: How do I handle this peak integration, if at all? From where I'm sitting, the endogenous peak doesn't appear to be quantitative, but I'm not familiar enough with Skyline to figure out if the problem is a lack of knowledge on my end, a sample degradation problem, a meaningful biological artifact, or a methods/sample preparation problem. For reference, I am running a PRM proteomics experiment on Skyline version 24.1.0.414.
I've attached images of the heavy peak, the endogenous peak that Skyline recommended I integrate, the endogenous peak that I manually wondered if I should integrate, and an overlap of the precursor ions for both the heavy and light peptides (blue is the heavy, red is the endogenous).
I first assumed that I have a PTM on my endogenous peptide, but that would change the overall mass and my PRM scan wouldn't have picked up my peak. I have an amino acid in my sequence that perhaps could have undergone racemization (my cell pellets were >1 yr old), but I wasn't sure if there was a simpler or more likely explanation before I attempt a new experiment. For reference, this peptide comes from a membrane bound glycoprotein. To my knowledge, there are no known glycosylation or phosphorylation sites on my peptide.
I apologize for the novel, but I thank you for your time and look forward to your response.
Sincerely,
Olivia
|
| Endogenous_SkylinesPeakChoice.png Endogenous_ManualPeakChoice.png Heavy.png Overlap_BlueHeavy_RedEndogenous.png |
| view request |
| Q-value in groupwise comparisons |
| (3 responses) |
nreimers |
2025-04-24 17:10 |
|
Hello,
I am hoping to get some more information on the application of the q-value filter when setting up groupwise comparisons on the protein level in Skyline version 24.1. I am preparing to run pathway analysis on proteins that have been identified from DIA proteomics data in Skyline, so I am trying to generate high-quality groupwise comparisons with a p-value and log2 fold change for each protein. Implementing a q-value filter of 0.01 results in many missing abundances in my comparisons.
-
From my understanding, the q-value essentially descibes the FDR for picked peaks. If it applies to individual peaks (ie, peptides), how is it calculated on the protein level?
-
If I've already filtered my data by removing duplicate epptides, removing missing peaks, decoy scoring, etc. earlier in the analysis process, is it necessary to apply the q-value filter? Why is it applied in the groupwise comparison step and not earlier in the analysis process?
-
Would you recommend applying the filter for this application?
Thank you for your help!
|
| view request |
| Adding Precursor [M-1] trace to all precursors by default |
| (4 responses) |
sean jensen |
2024-04-25 21:39 |
|
Hi!
We use the [M-1] to qualify potential interferences and correct species identification for peptides and was wondering if anyone is able to help me enable the precursor [M-1] chromatogram trace for all precursors in a document by default. I've tried manually enabling the option for each precursor, but this is impractical to do for large analyses.
Thanks in advance!
Cheers,
Sean
|
| view request |
| Agilent LCMS 6495D methods using a template method specifying large molecule iFunnel mode are exported with standard mode specified. |
| (1 response) |
mmarx |
2025-04-24 09:44 |
|
When using an Agilent LCMS 6495D model instrument, with the large molecule iFunnel mode specified in the template method, the exported methods use standard mode.
|
| LargeMolecule.m.zip |
| view request |
| How to import .resultsbfp into Skyline to create a peptide library |
| (1 response) |
shivangi awasthi15418 |
2025-04-24 09:12 |
|
Hi,
I want to create a peptide library in Skyline using a result file created by Biopharma Finder with the extension .resultsbpf. Has anyone tried this and could help with the process? Thanks!
|
| view request |
| Uploading timstof files to create skyline library |
| (4 responses) |
susmitaghosh191996 |
2025-04-17 03:43 |
|
I am currently trying to export isolation list for PRMPASEF method for which I need spectral and ion mobility library. I wanted to create that with the PEPXML file ontained from PEAKSONLINE database search. However, I am constantly getting the attached error. Therefore, it will be helpful if you guide me what to do further.
|
| skyline error.PNG |
| view request |
| Connecting file name information to list annotation |
| (2 responses) |
edoud |
2025-04-22 17:54 |
|
I've now successfully used a list with associated datasets in an application - but now I'm wondering if I can connect information from the file names to this list.
I know that we can use a regular expression to define a result file rule pulling some information from the file name to a specific target (although could you remind me of which tutorial described this? I don't have my regular expression worked out quite yet and I know you JUST talked about how to do this recently). For reference file name formats are all: date_source_animal_ID#_timepoint (example 040825_IUSM_animal_26_M2 ) and I want to pull ID# into the document, and then use that ID number to pull in information from the associated list.
Right now, I cannot seem to define that 'ID' as the target for the replacement information, it is only listed in the 'source' section for the result file rules. Attached a screenshot for reference of what I'm seeing.
|
| screenshot.png |
| view request |
| timsTOF PASEF PRM Import Issues |
| (4 responses) |
robwsprung |
2025-04-15 08:18 |
|
Dear Skyline Team,
Thank you for your continued development of this excellent software package. The longevity of the project is a testament to its utility.
I am currently developing a scheduled PASEF-PRM method on a timsTOF Pro instrument and I am running into some issues when importing results. I've tried importing a reference DDA run of isotope-labeled peptides and a scheduled PASEF-PRM run of the same sample while adjusting the Transition Settings - Full-Scan - MS/MS Filtering parameters as follows, with varying outcomes:
Import as PRM – no chromatograms
Import as DDA – Few product ion traces (even in DDA run), despite spectra in library
Import as DIA – Product ions observed in DDA run, few products in PRM run
I've attached some screenshots of my observations and a zipped file of the Skyline document. Any suggestions you could provide would be appreciated. Let me know if you need the timsTOF acquisitions uploaded also. Thanks.
Robert
|
| timsTOF PRM Troubleshooting.pptx |
| view request |
| Quantitative Proteomics with Skyline course |
| (1 response) |
anhdao darcy |
2025-04-11 13:43 |
|
I am interested in attending the Quantitative Proteomics with Skyline course scheduled for April 28, 9:00 AM - April 30, 12:30 PM, 2025. Could you please advise me on how to register for this course?
|
| view request |
| EncyclopeDIA error |
| (4 responses) |
sscott13 |
2025-04-11 09:54 |
|
Hello,
This is my first go through using Skyline/EncyclopeDIA to look at my samples vs. GPF, so there might be something I'm setting up incorrectly, but I keep hitting a GC overload error. There are a ton of entries in the file, and I'll try parsing it to see if that fits, but I wanted to check to make sure it wasn't something in my setup. I had 6 GPF pools, and 15 samples. The blib is created, but the error comes in when the elib is supposed to be created.
- Is there a way to get around this in Skyline? I'm happy to send over whatever files you need.
Thank you,
Shay
|
| overhead exceeded2.png |
| view request |
| Normalization Methods |
|
jaedon sadler |
2025-04-11 08:33 |
|
Hello,
I am using the small molecule side of skyline and frequently use the normalization method in the live reports to assign surrogate standards to all the metabolites I am looking at. However, I like to use different surrogate standards for different molecules, so is there a way to assign a normalization method to the molecules in your transition list so that I don't have to go in and manually change it in the live reports for every experiment?
Thanks for the help!
Jaedon
|
| view request |
| Avant Garde R Package Installation Failure |
| (5 responses) |
sgoulding |
2023-10-05 14:05 |
|
Hi, Skyline Team.
I'm running into issues installing the Avant Garde tool in Skyline. I've tried to install it through both the Tool Store and as an External Tool, but I keep running into issues with specific R packages not installing. The two packages that won't install are stringr and ggplot2. This is happening on several different computers running the most current version of Skyline Daily.
Do you have any suggestions about how to remedy this? I tried installing the specified versions of ggplot2 (3.2.1) and stringr (1.3.0) outside of Skyline through R (v 4.0.3) but there were issues with the tool when I did that. I attached the error message I got related to the tool stoor failed installation of ggplot2 and stringr.
Scott
|
| Error.PNG |
| view request |
| DIA-NN .speclib support |
| (54 responses) |
Tobi |
2020-05-27 03:03 |
|
Dear Skyline Team,
could you please consider implementing support for DIA-NNs .speclib spectral libraries? Its a highly convenient tool for predicted libraries and much faster than Prosit.
https://github.com/vdemichev/DiaNN
With best regards,
tobi
|
| view request |
| Global peptide, can't see the options described in the previous answer |
| (4 responses) |
yurubi |
2025-04-08 13:07 |
|
Hello there, I found an answer that described what I am trying to do, set one surrogate peptide as global peptide for several light peptide from a previous thread but it is not working for me. It mentioned to set the Standard Type of each of these heavy peptides to "Surrogate Standard" and then set the "Normalization Method" for all the other peptides to the appropriate "Ratio to Xxxx". However, I can't see the options to Ratio to Light or Ratio to Heavy after setting the whole peptide as Surrogate Peptide, do I have to change something under the "peptide setting" "modifications" tab? There I have the internal standard type set as "heavy". Do I set the peptides with no heavy counterpart as Standard Type "none"?
Thank you very much,
HHB!
|
| view request |
| About AlphaPeptDeep predicted spectral library |
|
ma ziliang from tp |
2025-04-07 22:49 |
|
Dear Skyline Team,
I found this tutorial of AlphaPeptDeep predicted library build-up in the Skyline
https://skyline.ms/wiki/home/software/Skyline/page.view?name=Build AlphapeptDeep Library
However, the Skyline (version 24.1.0.414) that I use does not have this option in the Build Library window. Could you please indicate how could I get this function to build up a predicted library with AlphaPeptDeep in Skyline?
Additionally, I found that AlphaPeptDeep has an online version, and I built a library with the online tool. While the library generated was in .tsv and .hdf format, which I tried and found cannot be recognized by Skyline. If the built-in function is not available for the moment, is there a way to upload this predicted library?
Best,
Ziliang
|
| 1.PNG |
| view request |
| 95 % Confidence interval for LOD |
| (1 response) |
Zac |
2025-04-07 07:24 |
|
I will likely have to do this manually but just wondering of there is a quick way within skyline to calculate 95% CI for LOD using SD of blanks and slope of calibration curve
|
| view request |
| Inserting 15N-labeled products into Skyline |
| (2 responses) |
chemistry Jedi |
2025-04-07 00:58 |
|
Hello everyone,
I would like to add the following 15N-labeled product to Skyline:
L-Tryptophan-15N₂, with the molecular formula C₁₁H₁₂¹⁵N₂O₂.
Thank you very much for your assistance.
Best regards
|
| view request |
| No digestion |
| (1 response) |
PP |
2025-04-04 10:42 |
|
Is there a way to calculate monoisotopic mass of a peptide without digestion?
|
| view request |
| Quantification for small molecules by using C of IS without cal. curve |
| (8 responses) |
ismailovadh |
2025-03-18 02:50 |
|
Hello, dear Skyline support!
Is it possible to arrange quantification of concentration, using only the concentration of IS that is structurally relative to the target molecule? I need the concentration that is calculated according to the formula: C(tm)=Int(tm)*C(IS)/Int(IS), where tm -- target molecule, IS -- internal standart, Int -- intensity of the signal.
I have already tried labeling IS as heavy (it really is an isotoped molecule), but I can only calculate the ratio and the normalized area.
Maybe it is not quite accurate to ignore the external standart calibration curve, but to I need the calculation, I mentioned.
I would be very grateful for your help!
Best regards,
Ismailova Diana
|
| view request |
| DIA setup problem |
| (4 responses) |
gor bazoyan |
2025-03-03 16:46 |
|
Hello everyone
We have the SYNAPT XS instrument and my task is to discover the proteins from cells.
I am trying to repeat the steps from this "Skyline Data Independent Acquisition" tutorial paper.
I am getting error during the export of Isolation schema, there is no option to save at .csv format, only .mrm.
"Import Peptide Search" sections.
Also I have problem with uploading the results, it is showing that it is running/importing the .raw or .mzML file, I can see the process of importing, but at the end I do not have any results imported.
Please see attached files, and if you have any suggestions, please share with me your thoughts.
Thanks beforehand.
Best regards,
Gor.
|
| Screenshot 2025-03-03 163634.png Screenshot 2025-03-03 163906.png |
| view request |
| pasting peptide sequences associated with a particular protein |
| (4 responses) |
pavel shliaha |
2025-04-03 04:35 |
|
I would like to add peptides as groups to the document. It seems to work if I use ">" for the group name, e.g.
>biognosys
LGGNEQVTR
GAGSSEPVTGLDAK
VEATFGVDESNAK
is parsed correctly.
However, when I try to do the same with a modification stipulated in square brackets, I get an error:
>biognosys
L[Phenylisocyanate (N-term)]GGNEQVTR
GAGSSEPVTGLDAK
VEATFGVDESNAK
YILAGVENSK
"Unexpected character "[" found on line 2"
At the same time I can simply paste these peptides without the line containing ">", i.e.
L[Phenylisocyanate (N-term)]GGNEQVTR
GAGSSEPVTGLDAK
VEATFGVDESNAK
YILAGVENSK
works as expected with all peptides assigned to "peptides 1".
Is there a way to group peptides in groups like "peptides1" with modifications stipulated in []?
|
| view request |
| export all chromatograms visualisation from skyline |
| (1 response) |
ismailovadh |
2025-04-03 07:06 |
|
Hello, Skyline team!
is there any way to extract all the visualisations of chromatograms, peak areas etc in one report? I could copy and past the pictures step by step and create my own report in Word, for example, but it seems to be too long, cause I hve plenty of small molecules in the analysis... Using R or such tools is ok, but I already like the pics from Skyline. What should I do? I attach my file here for the example.
Thanks!
-- Diana
|
| обработкаneoscreenof110325.skyl обработкаneoscreenof110325.skyd обработкаneoscreenof110325.sky.view обработкаneoscreenof110325.sky |
| view request |
| skyline openning dia-nn data seems slow |
|
eva borras |
2025-04-03 02:51 |
|
I will be sharing two skyline documents, both with data imported from DIA-NN 2.0.2 (report-lib.parquet.skyline.speclib) and 3 Astral raw files
"100SPD_2_4_8_Th.sky" here I added a dabase containing UniProt human fasta plus some entries of contaminants annotated as CON_xxx
"100SPD_2_4_8_Th_woc.sky" using same database but without contaminants.
|
| view request |
| problems with NIST library msp |
| (5 responses) |
ismailovadh |
2025-03-31 04:20 |
|
Hello, dear SKyline team!
We have a problem uploading mass NISt Library (msp format) for small molecules. Do you have any recommendations?
Best regards,
Diana
|
| msp_error.PNG |
| view request |
| opening.d files on skyline |
| (15 responses) |
NBL |
2025-03-24 04:29 |
|
Hello
We have results generated from a timsTOF bruker under the format of a " .d folder". This .d folder contains a file named .d (0 KB), and other files such as .tdf .
When we try to load these results on skyline, the folder .d is not visible. However the file .d is visible but unfortunately skyline cannot be run with this file because it is empty.
How can we open our tims TOF results on skyline?
Thank you for your help.
|
| view request |
| Data Normalization with Heavy Peptide along with Global Standard |
| (3 responses) |
Dhaval Patel |
2025-03-31 15:12 |
|
Hi Skyline Support Team,
I'm a new user learning targeted proteomics data analysis with Skyline and have some questions about normalization approaches for my experiment.
My current setup includes:
- Around 2-3 peptides per protein
- Around 2-3 transitions per peptide
- One transition for each labeled peptide (for chromatography and instrument variation normalization)
- BSA protein as a global standard for sample processing normalization
I would appreciate your guidance on the following:
-
Is it possible to normalize multiple unlabeled transitions (e.g., Transition A & Transition B) using a single Heavy Labeled Transition (Transition C) in Skyline? As an example, can we normalize transition A over C and B over C for the proteins relative abundacnes analysis in skyline?
-
For proteins where we don't have labeled peptides, can we use labeled peptides from other proteins as normalization references? If yes, then could you please advice how to process that in skyline?
-
We're using BSA as a global standard for sample processing normalization. Is there a way to implement a two-step normalization process where we first normalize all samples using their respective BSA peak areas/ratios, and then apply a second normalization using the heavy labeled peptides?
-
When reviewing protein abundance reports ( Simply Control vs Treatment normalized Peak area or area ratio), how can I determine the calculation method used (e.g., whether Skyline is averaging or summing the responses from each peptide's transitions)? Is there a way to customize these calculations?
I'm happy to share my Skyline documents if that would help in addressing these questions.
Thank you for your assistance. I look forward to your response.
Best regards,
|
| view request |
| No chromatograms when importing Spectronaut file into Skyline |
| (1 response) |
tang yun |
2025-03-31 18:33 |
|
Hi Skyline Team,
I was trying to import my Spectronaut report files into Skyline, but there is no chromatogram been showed.
In the report file, it contained "Modified Peptide Sequence" "Relative Intensity" "iRT" "Precursor m/z" and "Product m/z" as Skyline indicated in the error message. After I modified my .tsv file, the file is successfully imported, but chromatogram place is empty. And under the "View" tab, the chromatogram button is grey that I cannot select. Could you help me with it? Thanks!
|
| view request |
 Building spectral search library error 2.PNG
 Building spectral search library error 1.PNG
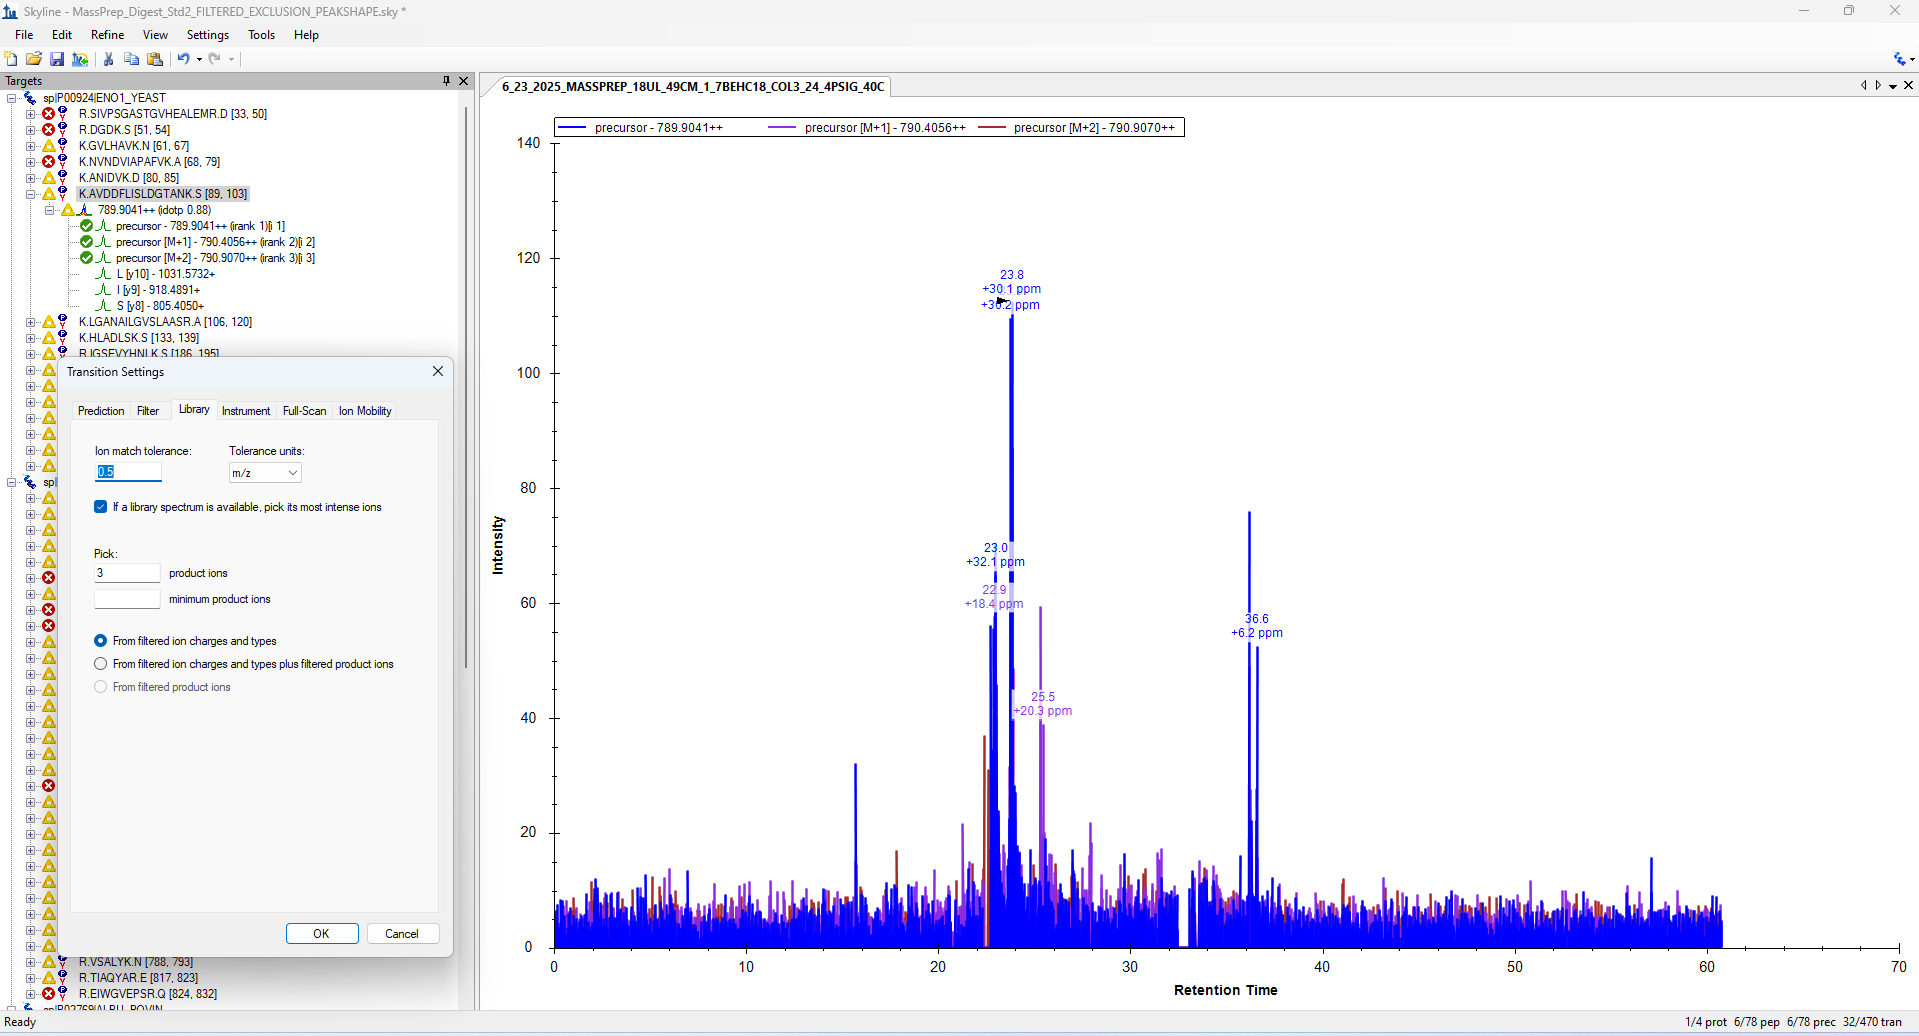 789_peptide.png
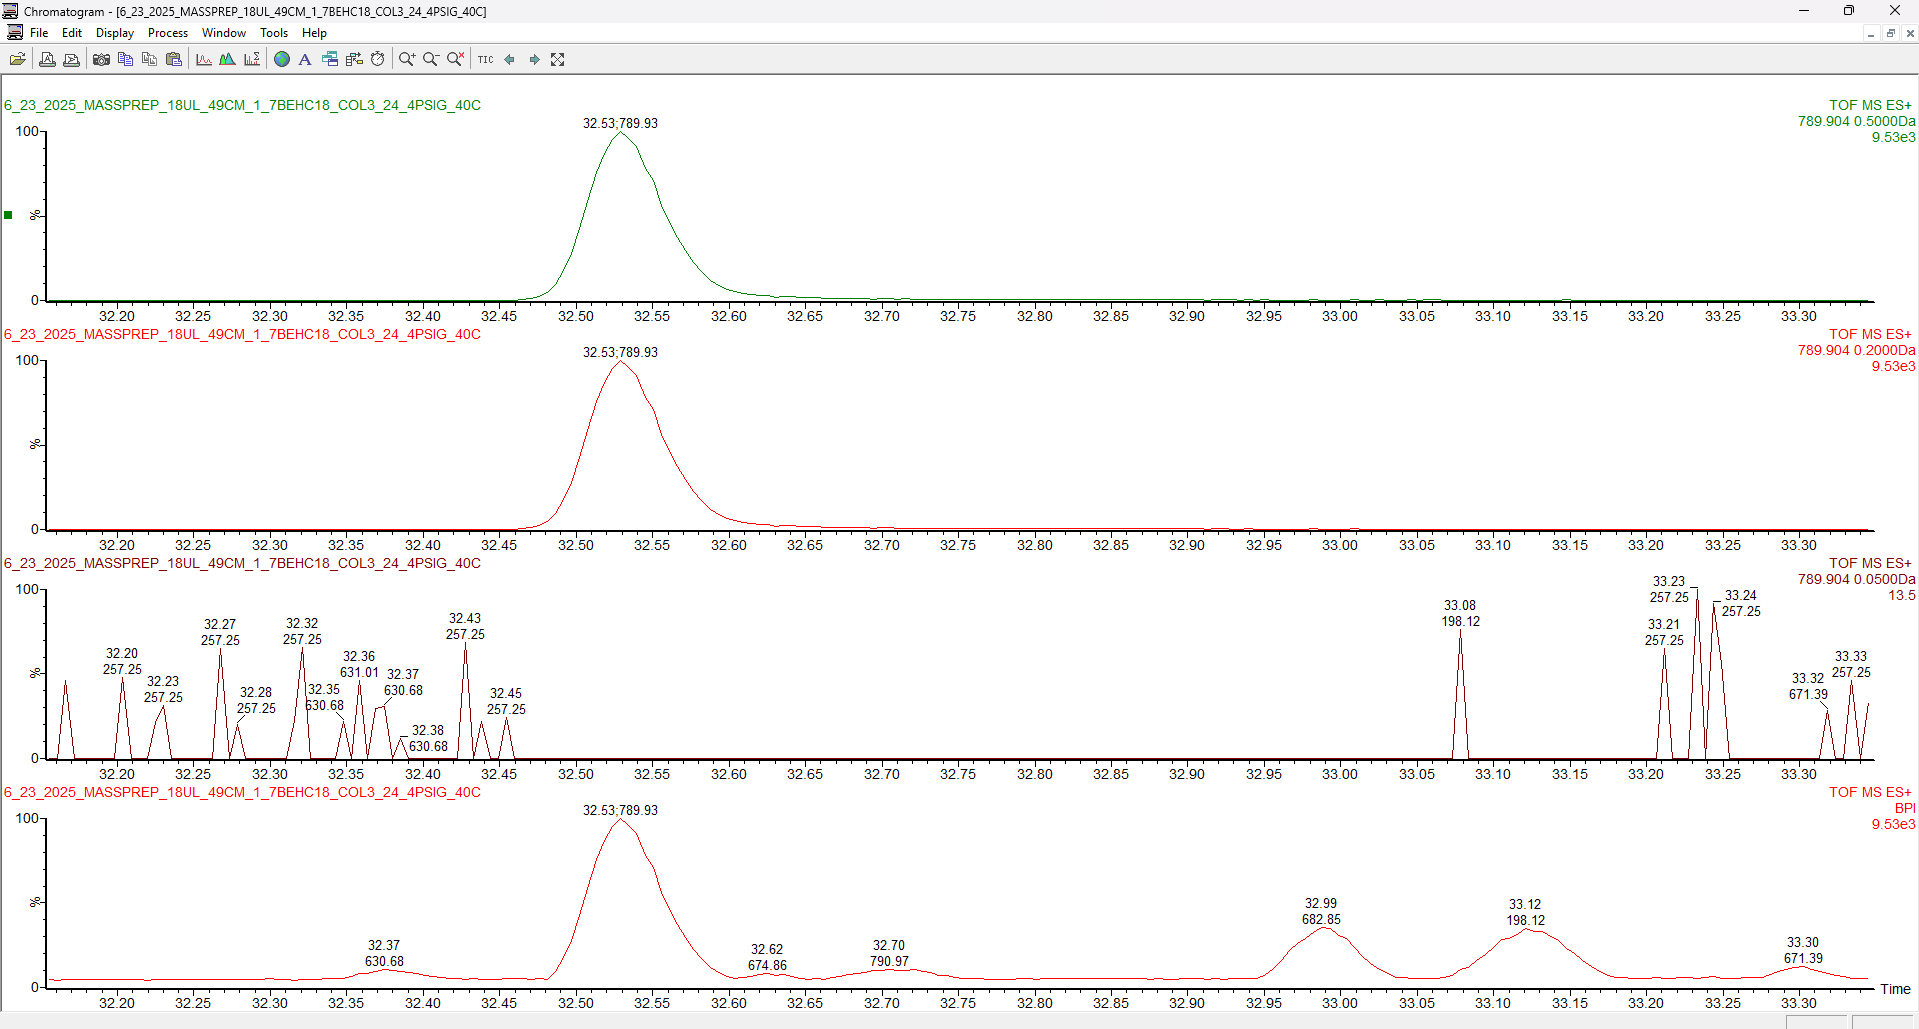 789_peak.png
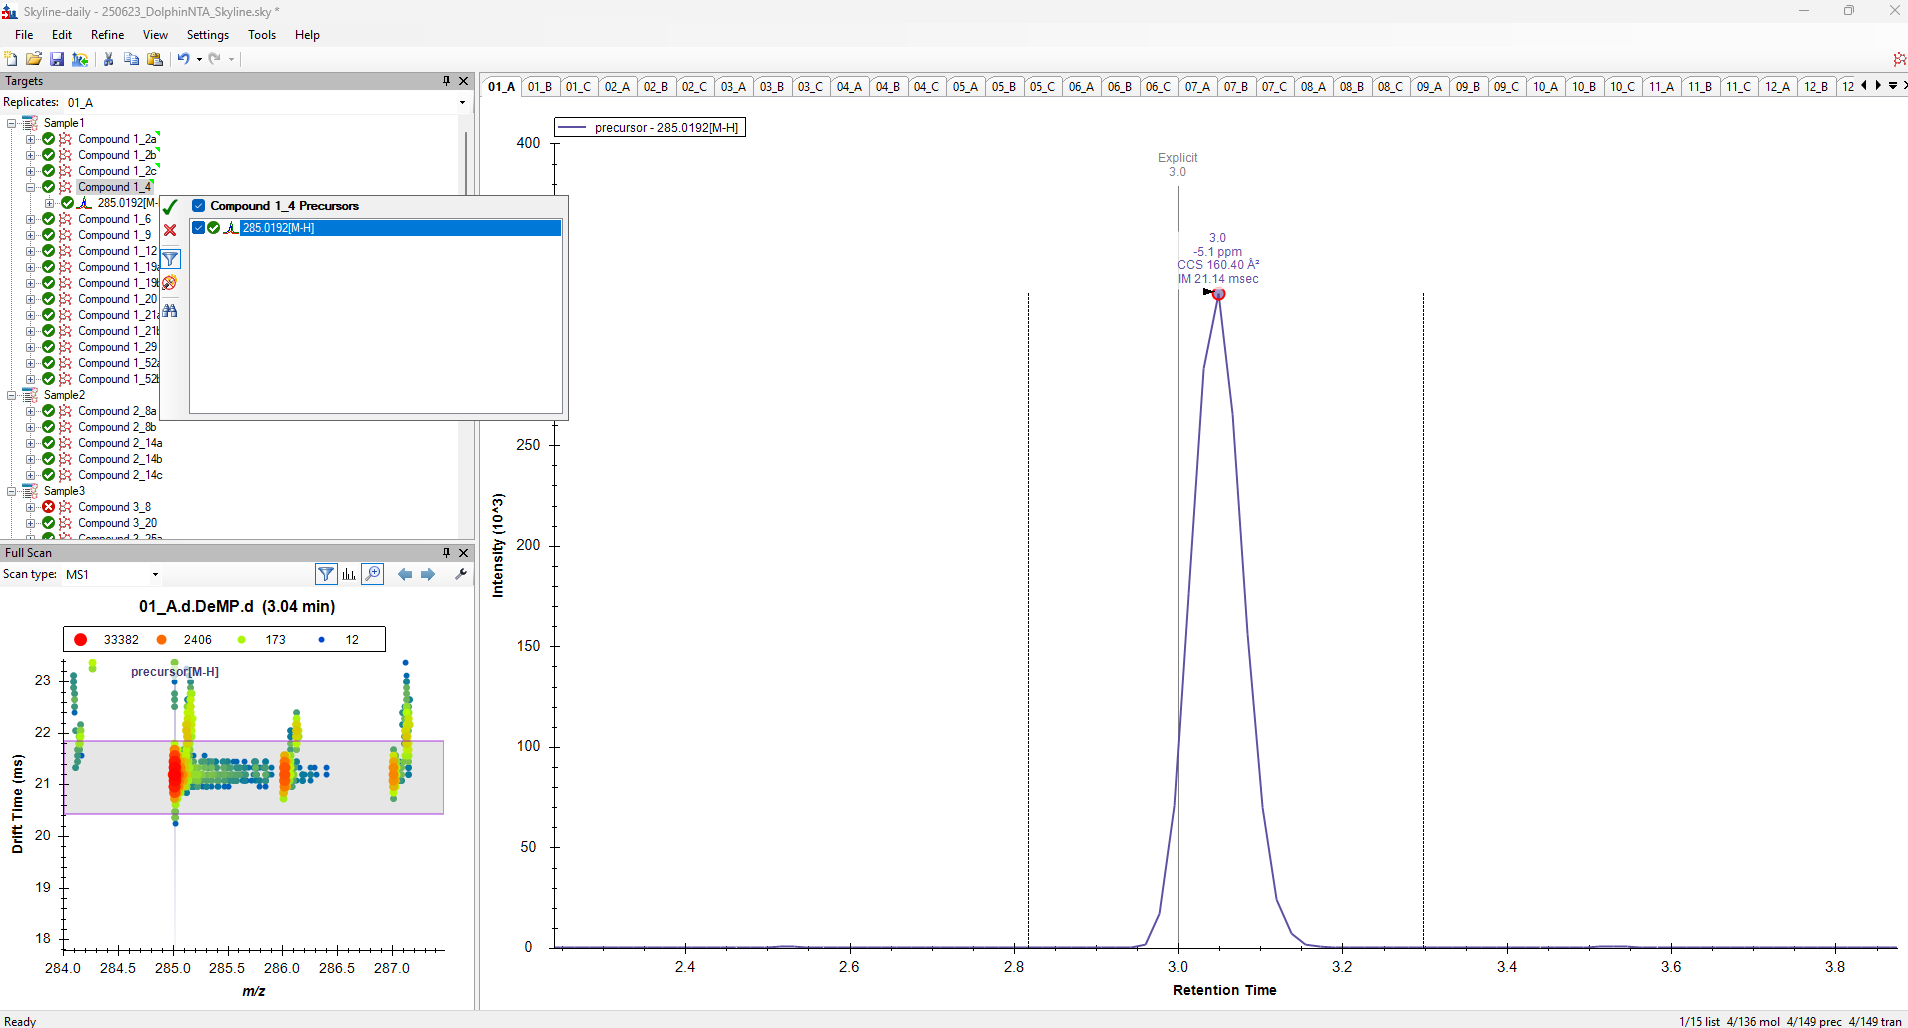 SkylinePickChildrenSS.png
 error importing resulsts.PNG
 pnnl settings.PNG
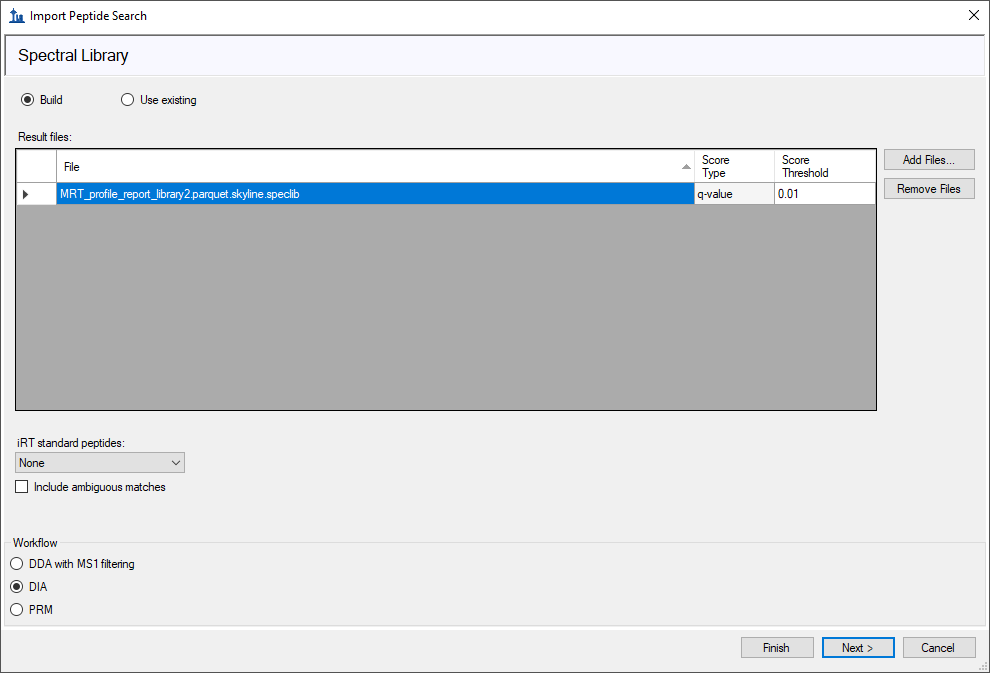 BuildLib.PNG
 Screenshot 2025-06-06 092908.png
 Peak picking Problem 1.png
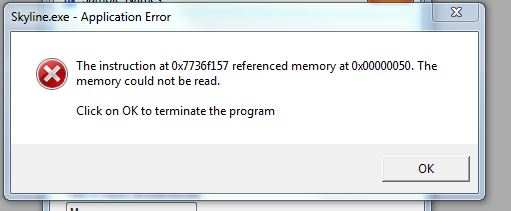 Capture.JPG
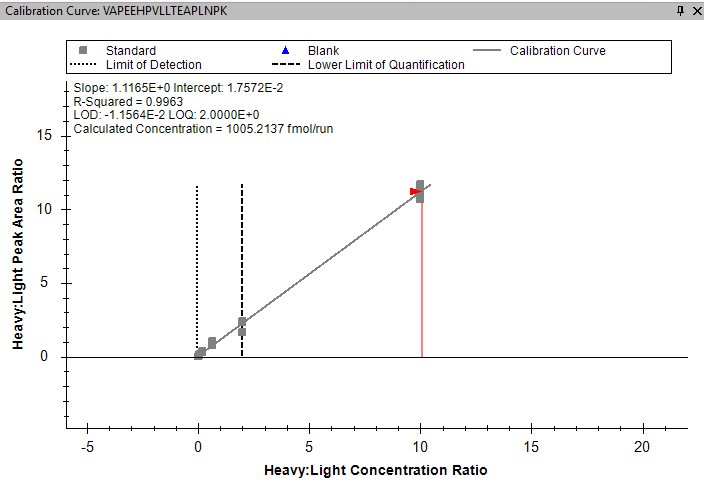 CalCurve.png
 Screen Shot 2025-05-20 at 10.45.33 AM.png
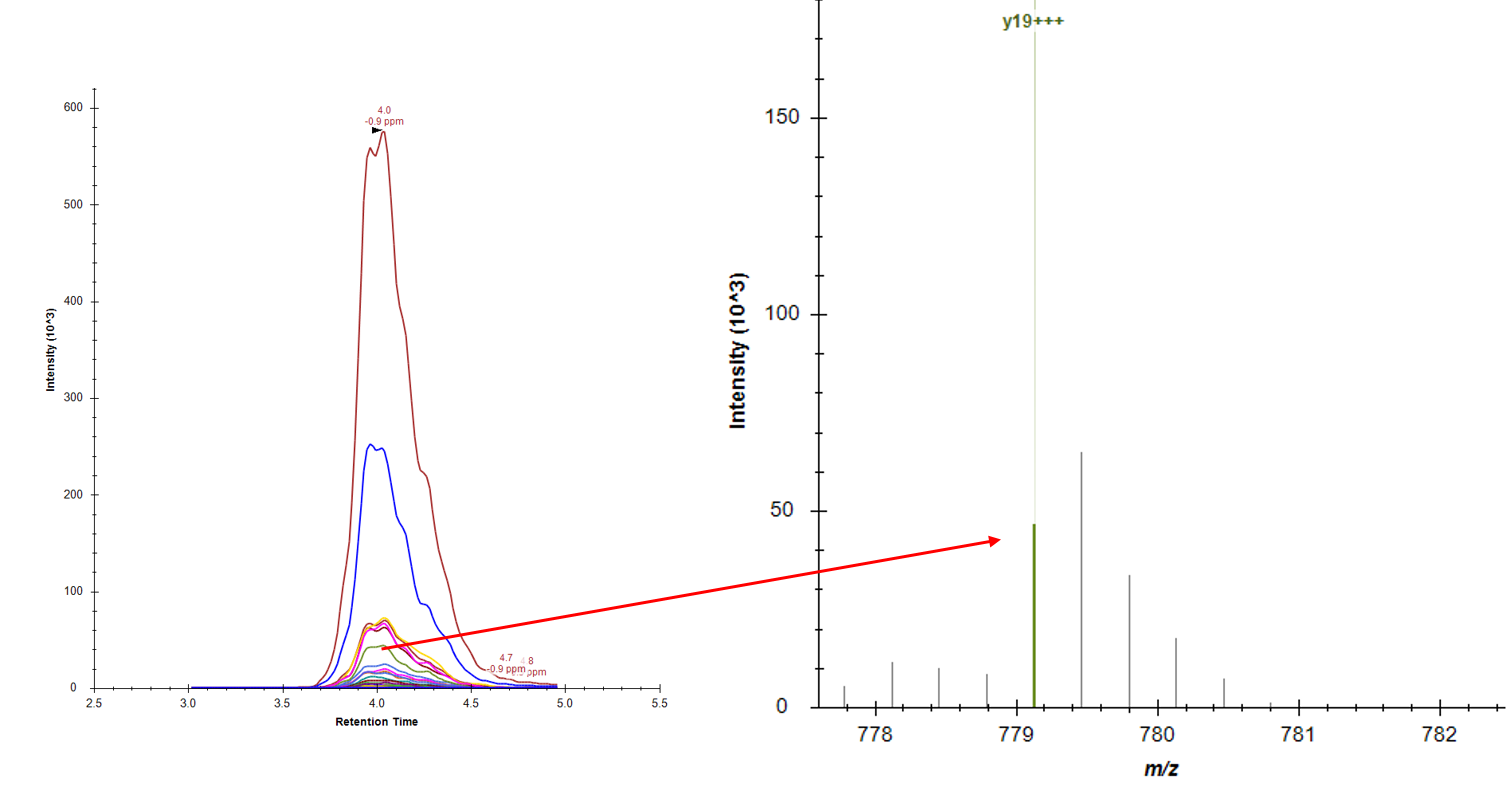 topdown_prm.PNG
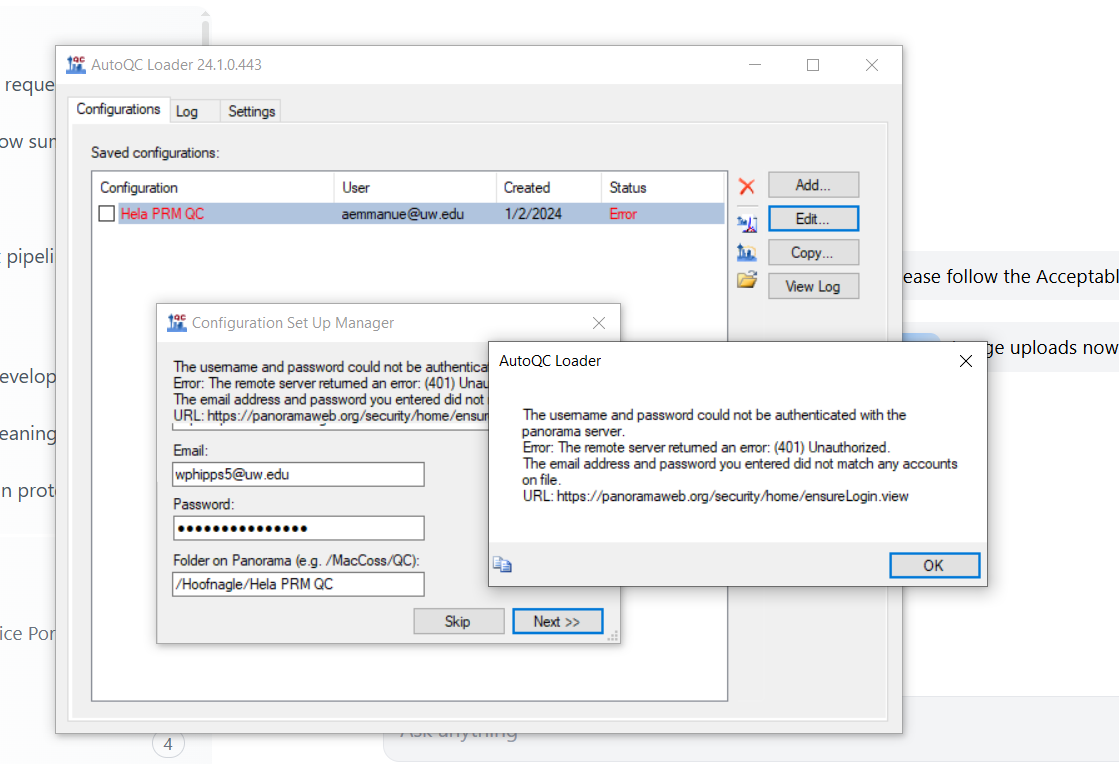 screenshot.PNG
 Screenshot 2025-02-18 135550.png
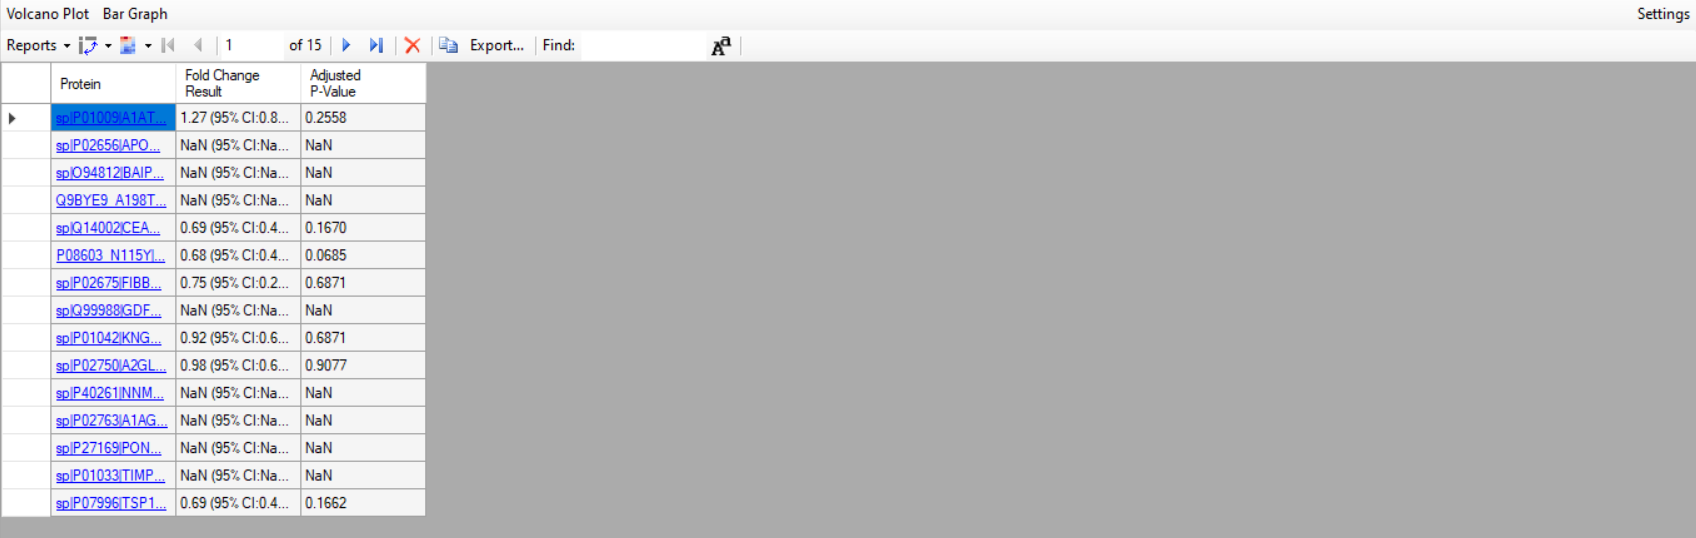 Comparison_foldchange.PNG
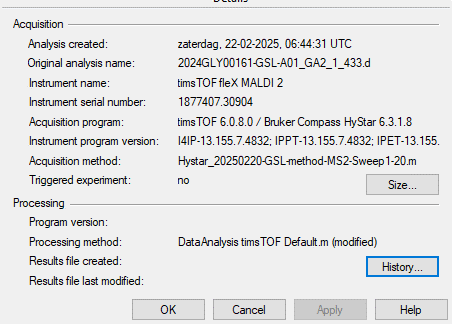 timsControl.png
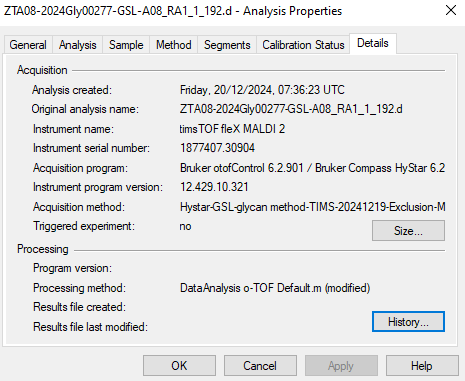 ofControl.png
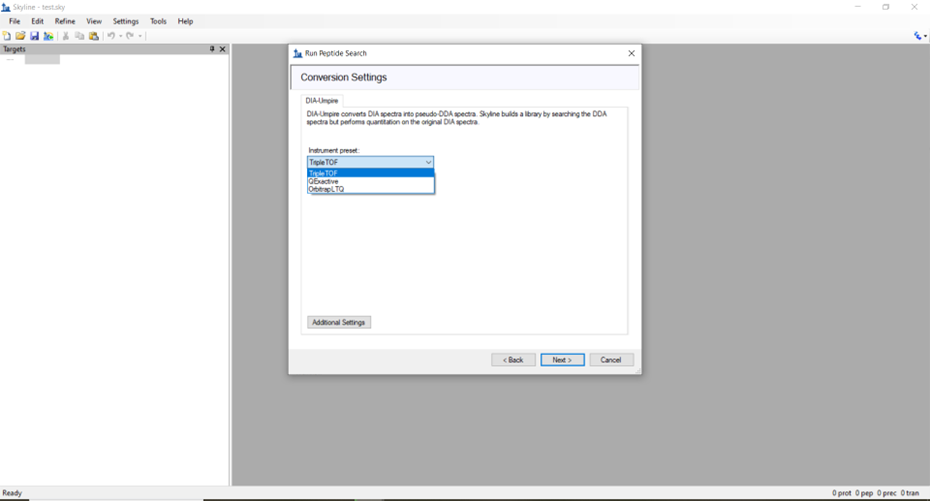 ConversionSettingsScreenshot.png
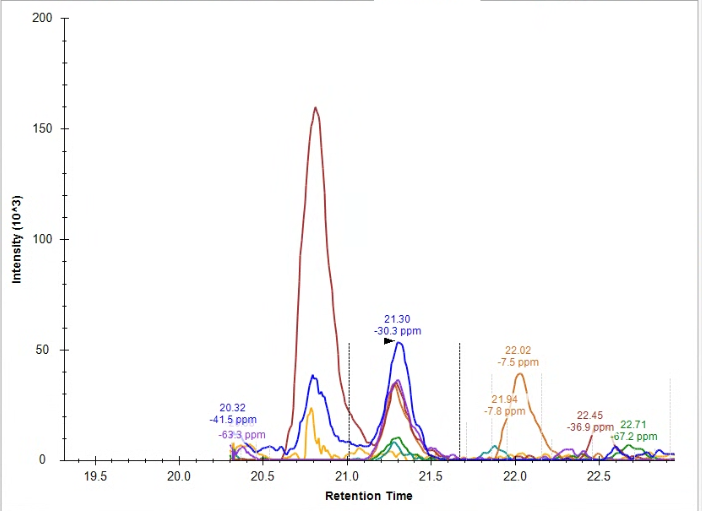 Endogenous_SkylinesPeakChoice.png
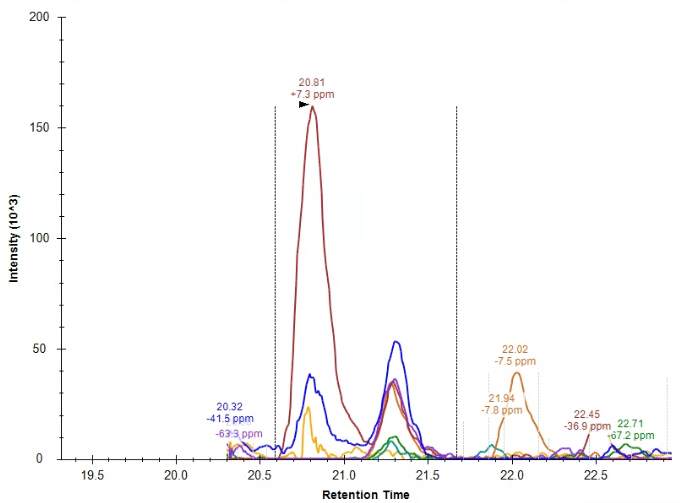 Endogenous_ManualPeakChoice.png
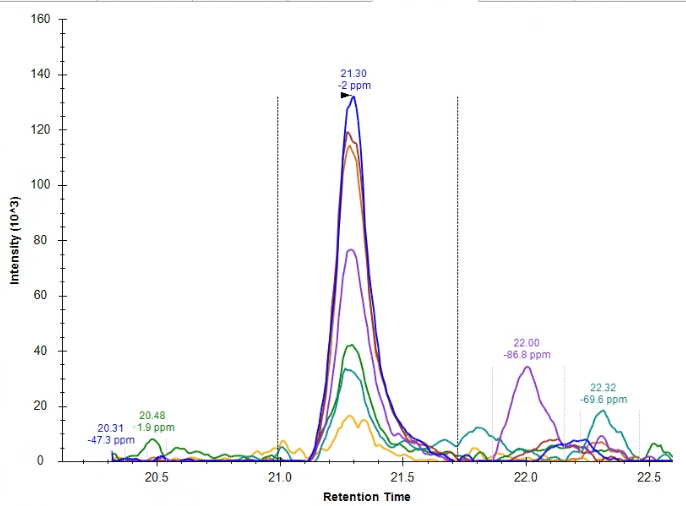 Heavy.png
 Overlap_BlueHeavy_RedEndogenous.png
 skyline error.PNG
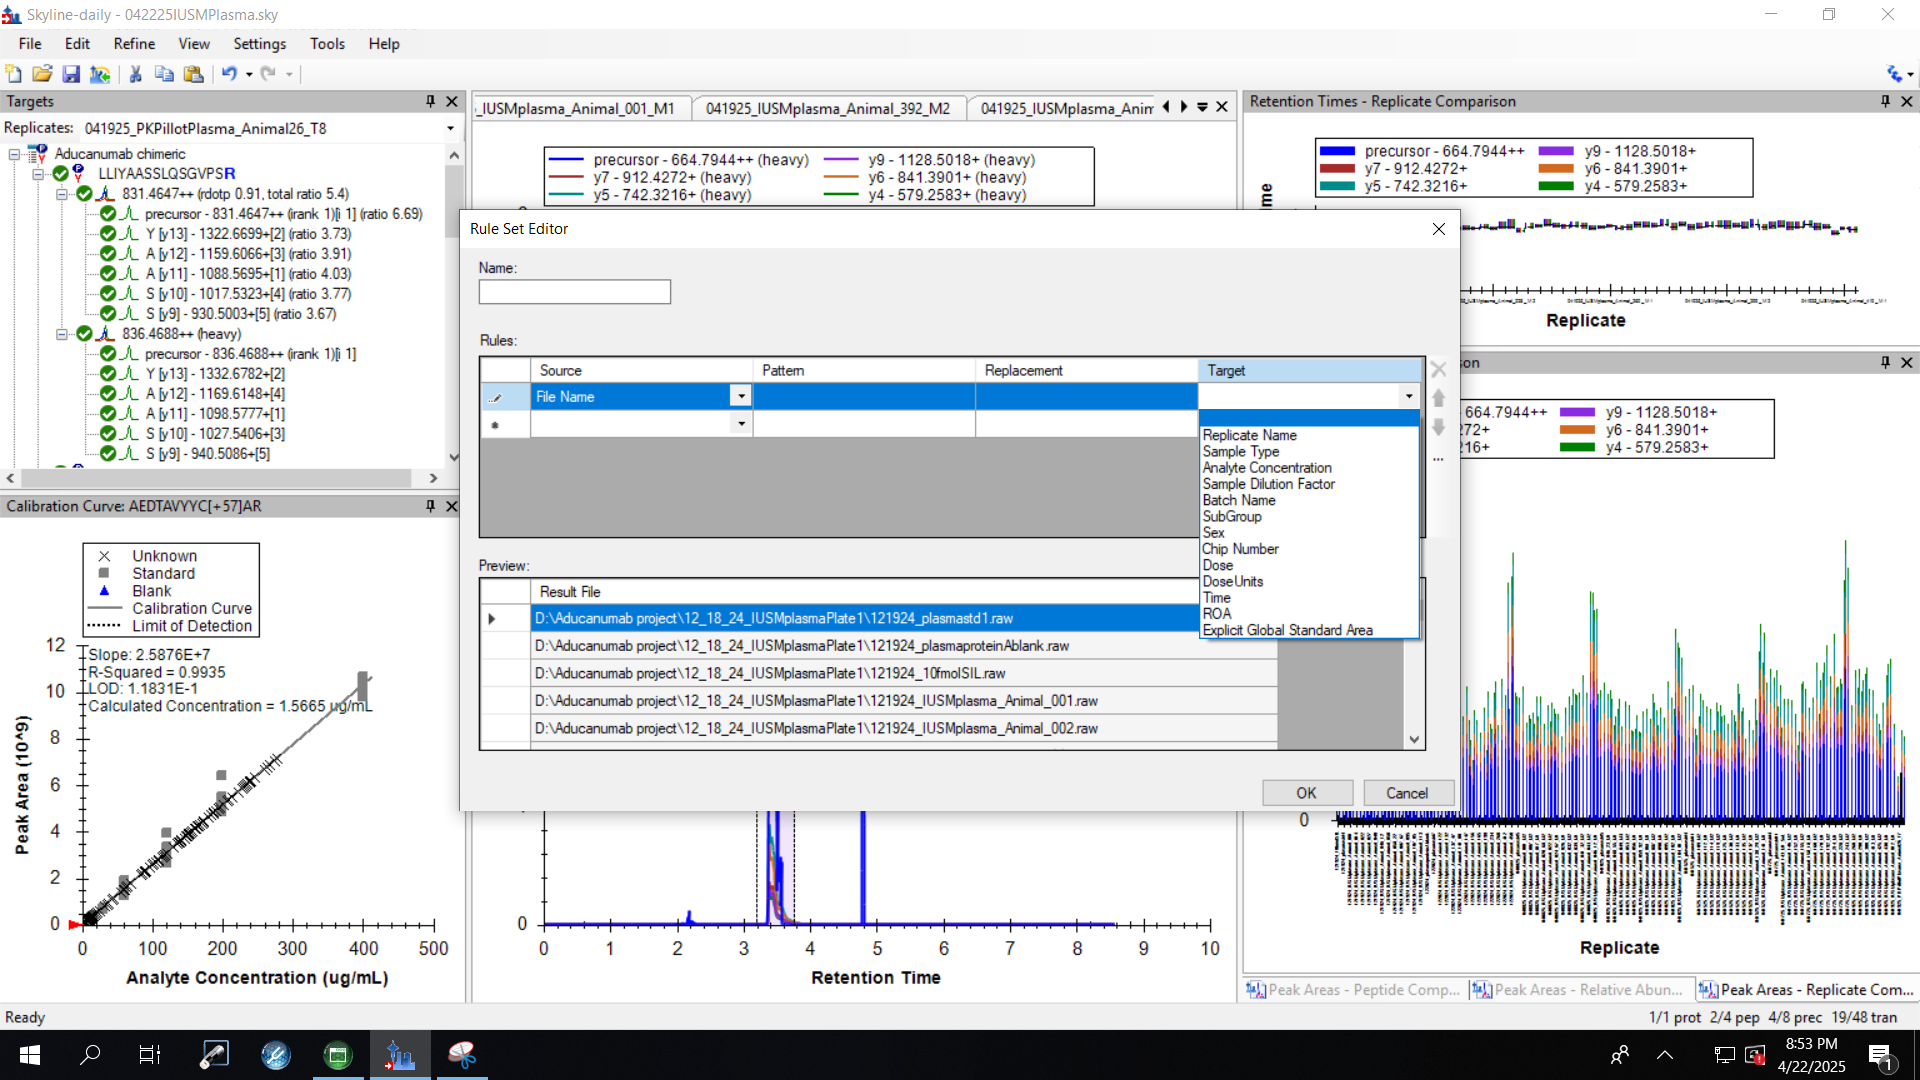 screenshot.png
 overhead exceeded2.png
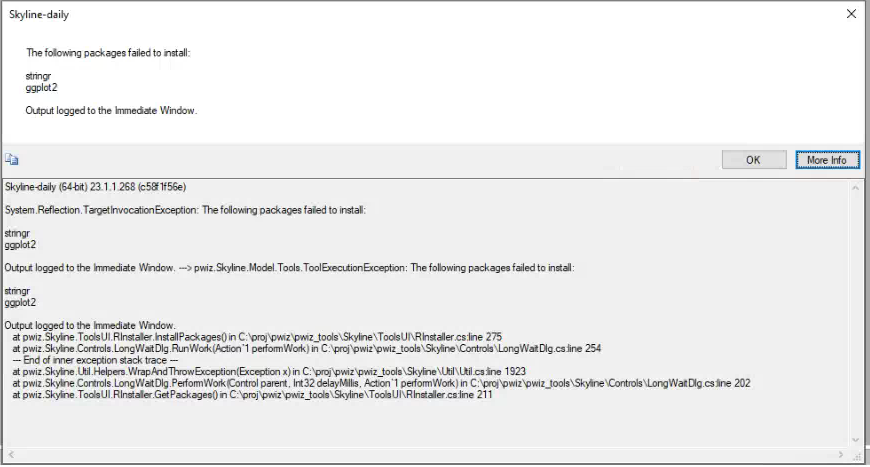 Error.PNG
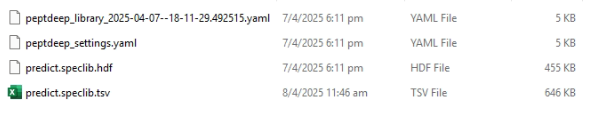 1.PNG
1.PNG Screenshot 2025-03-03 163634.png
 Screenshot 2025-03-03 163906.png
 msp_error.PNG