| Wesley Vermaelen responded: |
2024-10-30 17:00 |
Hi,
I've noticed that the versions of labsolutions and labsolutions Insight on the 8060RX is newer (v 5.128, v 4.2.SP1).
While the versions on the 8060NX is v5.120, 4.0.SP2 respectively.
As such, I cannot open files run on the RX, on the NX.
Is this a known problem? Is this going to be fixed?
Wesley.
|
| |
| Matt Chambers responded: |
2024-10-31 12:05 |
Thanks for the report. I've just merged a fix with updated Shimadzu DLLs that work with your RX file. It'll be included in the next Skyline-daily.
|
| |
| Wesley Vermaelen responded: |
2024-10-31 15:22 |
Hi Matt,
Thank you very much!
Wesley
|
| |
| Wesley Vermaelen responded: |
2025-07-21 21:10 |
Hi,
We are still having problems uploading Shimadzu .lcd files to a Shimadzu 8060RX.
The peaks shown by Skyline do not look like the peaks shown by Postrun Analysis (from Shimadzu). The signal is a lot lower.
We tried to convert the files to MzML but skyline but this doesn't always work. We get an error uploading the file or "Chromatogram information unavailable" for some compounds, plus it makes the file about 20 times bigger.
I have included two pictures showing a cortisol MRM peak in Skyline and in Postrun Analysis. And the original lcd file.
I hope it is somewhat clear.
Wesley
|
|
| |
| Nick Shulman responded: |
2025-07-21 21:38 |
Wesley,
Can you send us your Skyline document?
In Skyline you can use the menu item:
File > Share
to create a .zip file containing your Skyline document and supporting files including extracted chromatograms.
Files which are less than 50MB can be attached to these support requests.
You can always upload larger files here:
https://skyline.ms/files.url
It would probably also be helpful if you could send us the .mzML file that you created which was causing other problems for you.
-- Nick |
| |
| Wesley Vermaelen responded: |
2025-07-21 22:06 |
Here is the .zip file.
I have uploaded the mzML file to the files.url.
The error we get is:
"At 3:04 PM:
Failed importing results file 'D:\LabSolutions\DATA\2025\20250715_SterHorm_StrigLact_test\SH_STD_01uL.mzML'.
Times (1283) and intensities (1284) disagree in point count."
Thank you,
Wesley.
|
|
| |
| Nick Shulman responded: |
2025-07-21 23:22 |
Thank you for uploading that .mzML file and your Skyline document.
The error about Times and Intensities disagreeing in point count seems to be a bug in Skyline.
There are spectra in the .mzML file which represent SRM chromatograms.
Skyline is supposed to be able to handle that, but Skyline seems to be confused about one spectrum that maybe does not have all of the intensities that it was expecting.
I believe this bug will end up being straightforward to fix as soon as I figure out exactly what is going on.
Do you also want us to fix the problem where the chromatogram from the .lcd file does not look like your other screenshot? I do not know what might be going on there, but I could try to find someone else to look at that.
-- Nick |
| |
| Wesley Vermaelen responded: |
2025-07-21 23:35 |
Hi Nick
thanks for looking at it.
Well the main issue is the fact that the chromatogram doesn't look like the chromatogram given by the vender software.
We would like to keep using the .lcd files in stead of converting them.
As stated in the beginning of this thread, we also have a Shimadzu 8060NX, and uploading the original Shimadzu .lcd files works perfectly there.
So if you can find someone that can have a look at it, that would be great.
Thanks again,
Wesley
|
| |
| Matt Chambers responded: |
2025-07-22 09:50 |
Hi Wesley,
We'll need the LCD file to figure out why it's giving a different result than the Shimadzu mzML.
|
| |
| Wesley Vermaelen responded: |
2025-07-22 16:35 |
Hi,
The .lcd file can be found in a previous reply.
I will send it again.
Thanks.
|
|
| |
| Matt Chambers responded: |
2025-08-06 13:45 |
Sorry for the delay. I'm looking at this file and I don't see anything close to the intensities in the PostrunAnalysis picture you attached above. This is true whether I look at the SRM chromatograms from pwiz opening the LCD directly, or when looking at the spectra in the mzML file you provided.
In the SH_STD_DER_Method.LCD file for 363/121, I see:
time intensity
2.41 0
2.42 12594
2.43 38977
2.44 33806
2.45 27026
2.46 29162
2.48 31818
2.49 31260
2.50 4251
2.51 0
In the SH_STD_01uL.mzML file for 363/121, I see:
2.34 6224
2.36 21506
2.38 48729
2.39 74223
2.41 97314
2.43 110061
2.45 110663
2.46 101618
2.48 83233
2.50 57127
2.52 35054
2.53 21990
2.55 18119
2.57 14427
2.58 10536
2.60 8774
Both of those are way off the apex intensity of 1.6e6 in your PostrunAnalysis. It would be interesting to have the same mzML file for the LCD file you provided. Since it's a different run I can't expect the numbers to really be comparable. But I must assume that either you're looking at a different file in PostrunAnalysis or that it's been postprocessed somehow.
|
| |
| Wesley Vermaelen responded: |
2025-08-06 21:08 |
Hi,
I have include the mzML file for the SH_STD_DER_Method.LCD (It is zipped because otherwise it is too big)
And I have included the comparison of LCD vs MzML in the picture for transition 363.22 > 121.00 (Cortisol)
SH_STD_DER_Method = LCD
SH_STD_DER_Method2 = MzML
The results for SH_STD_01uL.MzML do match the LCD File if I open the LCD file in Postrun Analysis (Shimadzu). But if I open this LCD file in Skyline the peak signal is 9500, more than 10 times less than the Postrun Analysis result.
The goal here is to be able to upload the original LCD file (without converting to mzML format) and get the same intensity peak shape as the original software.
I thank you again,
Wesley
|
|
| |
| Matt Chambers responded: |
2025-08-07 09:22 |
Thanks for the file. I'm now able to reproduce the superior spectrum-based signal from the LCD file. We generally try to read MRM data using vendors' chromatogram-centric APIs but for some reason on this instrument/file the spectrum-centric and chromatogram-centric APIs are seriously out of sync. I will ask Shimadzu what's going on here.
|
| |
| Wesley Vermaelen responded: |
2025-09-17 17:53 |
Hi,
Is there any progress on this?
Currently we are converting all lcd files to MzML files, which come with their own problem like chromatogram not displaying for certain precursor masses, large file size, ...
It would be great if this problem would be resolved.
Thank you,
Wesley
|
| |
| Matt Chambers responded: |
2025-09-30 07:29 |
Unfortunately I have not gotten any response from my Shimadzu contacts about this issue. I will keep trying to get an update.
|
| |
| Matt Chambers responded: |
2025-10-20 12:03 |
My Shimadzu contact was able to reproduce the issue and they've added it to their backlog to fix. In the meantime I have a workaround coming in this PR:
https://github.com/ProteoWizard/pwiz/pull/3645
It adds srmAsSpectra support in pwiz and forces that mode on for the 8060RX instrument. That also affects Skyline reading the LCD file directly, so you don't have to worry about converting to mzML anymore.
|
| |
| Matt Chambers responded: |
2025-10-27 09:42 |
Do you want to test the workaround in this PR build Wesley?
|
| |
| Wesley Vermaelen responded: |
2025-10-27 15:31 |
Hi,
Oh yes please, I was trying to figure out how to get it to work.
Any help is welcome.
|
| |
| Matt Chambers responded: |
2025-10-29 08:49 |
|
| |
| Wesley Vermaelen responded: |
2025-11-04 14:49 |
Hi,
Sorry, but the I do not have access to the link (Access denied).
|
| |
| Matt Chambers responded: |
2025-11-05 08:09 |
|
| |
| Wesley Vermaelen responded: |
2025-11-13 15:40 |
Hi,
I would like to give an update.
So the SkylineTester works great with data created earlier (a month ago), but when I want to open data created this week I get an "
At 10:27 AM: Failed importing results file 'D:\LabSolutions\DATA\2025\20251113_GutMet_SCFA_OA\EP20_1_013.lcd'.
Object reference not set to an instance of an object." error, while importing an lcd file.
But when I open these files on the Skyline-daily (the official daily V 25.1.1.271 ). These files do open and are correctly represented (correct intensity of peak).
I don't know if Shimadzu or the latest update of the Skyline-daily changed something but it works perfectly now.
Of course this is just one run and one dataset, I will keep an eye on it and get in touch as soon as something changes.
Wesley
|
| |
| Matt Chambers responded: |
2025-12-01 09:48 |
Is that behavior different than you get with the SH_STD_DER_Method.LCD file you provided?
|
| |
| Wesley Vermaelen responded: |
2025-12-01 20:44 |
Yes, so when I open older runs like SH_STD_DER_Method.lcd with the Skyline Tester it works perfectly now, the peaks have the intensities we were inspecting.
See First png (20251202_DailyVsSpecial.png) "Left: Daily 25.1, right: SkylineTester"
When I open newer run files, some of them at least like the EP20_1_013.lcd one above I get an error (see previous post, and png 20251202_SpecialError.png).
But not all of them, as you can see in the second png: 20251202_DailyVsSpecial_New.png, again "Left: Daily 25.1, right: SkylineTester".
At the moment I have no idea why sometimes SkylineTester works, but at the moment Skyline.Daily.25.1 always works.
I don't know if this is clear or not.
Thanks for all your help.
Wesley
|
|
| |
| Matt Chambers responded: |
2025-12-02 07:12 |
I will need to test on one of the problematic new files. The Shimadzu IOModule was updated in the SkylineTester I provided but not yet in Skyline-daily, so it's really odd (and concerning) that you would get an error in the former but not the latter. The peak intensity fix was actually independent of the IOModule update, but that also is only in SkylineTester, not Skyline-daily. But that would only affect SRM spectra from the 8060RX instrument, not any other acquisitions.
|
| |
| Wesley Vermaelen responded: |
2025-12-02 20:24 |
Hi,
It happened again today, with a new run. I can open the new lcd files with Skyline-daily (v 25.1.1.271) but not with the SkylineTester provided by you.
I am starting to think it has to do with the method (SteroidHormones can open in both, Lipid-Mediators can only open in Skyline-Daily).
I have no idea what the difference between these two methods can be (apart from different MRMs and Liquid Chromatography differences of course).
I have included the Quality Control run for the lipid mediators that does not want to open with the Tester, also the transitionlist for lipid mediators.
I can send you the methods for both Steroid Hormones and Lipid Mediators, if this is helpful?
Wesley.
|
|
| |
| Brian Pratt responded: |
2025-12-03 11:21 |
Hi Wesley,
Matt is headed out for an extended holiday, I'm stepping in to help sort this out.
A bit of a side issue, but there are oddities in that transition list - for example on line 18
MASS_351.20,AA,11b-PGE2,C22H32O5,351.2,[M-H]1-,10.88,-1,20,189.1,-1,light
Skyline gets confused because the mass of C22H32O5 is actually 376.493 (https://www.chemspider.com/Chemical-Structure.4952841.html)
Can you instead provide the actual Skyline file you're using with that lcd file? Use Skyline's File>Share menu item to create a .sky.zip file, that will let me see exactly what you're working with.
Thanks,
Brian Pratt
|
| |
| Brian Pratt responded: |
2025-12-03 13:51 |
Also, have there been any system updates to the Shimadzu acquisition hardware/software along the way since we started this conversation? I wonder if there was some trouble in the earlier files that we are accounting for which is not longer a problem in the newer files (so we are mistakenly accounting for problems that aren't there, and so creating a problem on our end).
Thanks,
Brian
|
| |
| Wesley Vermaelen responded: |
2025-12-03 15:18 |
Hi Brian,
Yes I ignore the Formula column and sort by mass in stead of Molecule List Name. So there might still be mistakes in the formula column (should be C20H32O5).
I include the Skyline project file which is empty because I get an error when importing lcd files.
I hope this helps.
|
|
| |
| Brian Pratt responded: |
2025-12-03 15:37 |
Yes, one less thing to wonder about, thanks.
And what about any changes to your Shimadzu system? Anything at all, you never know what might engender differences in how the .lcd files are formatted.
Thanks
Brian
|
| |
| Wesley Vermaelen responded: |
2025-12-03 19:36 |
I have no idea about that, sorry.
But the fact that you can't open files on an 8060NX (old) that were run on the 8060RX (new) says enough...
|
| |
| Brian Pratt responded: |
2025-12-04 09:09 |
If I understand what you're saying, it sounds very much like Skyline 25.1 has trouble with files produced on the 8060RX shortly after you began using it, but not on 8060RX files produced more recently. That really sounds like the Shimadzu system has been updated along the way, is there no way you can verify that? Or, as you suggest perhaps there is just something about the way the 8060RX deals with different kinds of methods.
I came to this a bit late: reading through this thread I think these are all the files you've provided, but to avoid confusion can you complete this table?
File, status v25.1.1.271, status SkylineTester, notes on method type
Shimadzu8060NX.lcd, No issues, no issues, ???
Shimadzu8060RX.lcd, strange intensities, works by failing over to srmAsSpectra, ???
SH_STD_DER_Method.lcd, ???, ???, ???
PBQC_RTCheck01.lcd, ???, ???, ???
Thanks,
Brian |
| |
| Wesley Vermaelen responded: |
2025-12-04 15:16 |
I have had no indication that there would be a software update from Shimadzu.
The LC/MS have had a service by the engineer, maybe he installed new software without telling us.
The version of Realtime analysis (the software that records the data) for 8060RX is still v 5.128 and the version for the data-analysis (labsolutions insight) is also still v 4.2.SP1. So that hasn't changed.
I think this is a better representation:
Shimadzu Mass Spectrometer,File, status v25.1.1.271, status SkylineTester, notes on method type
Shimadzu8060NX (older machine),N/A, No issues,Not tested,Mainly run Lipidomics, method made by Shimadzu, modified by me
Shimadzu8060RX (newer machine),SH_STD_DER_Method.lcd,Intensities ~100 times lower,Opens correctly,Steroid Hormones, Method made by me
Shimadzu8060RX (newer machine),PBQC_RTCheck01.lcd,Opens Correctly,ERROR: Object reference not set to an instance of an object,Lipid-Mediators, method made by Shimadzu, modified by me
The 8060RX is having a service next Monday/Tuesday, I will ask the Shimadzu engineer if there were any updates.
I hope this makes it a little clearer, and thanks for all your help.
Wesley
|
| |
| Brian Pratt responded: |
2025-12-04 16:20 |
Thanks, that does help. The NX version is 4.2 SP1 - does the RX version include an SP (service pack, presumably) value?
There was another RX file "Shimadzu8060RX.lcd" - which way did that one swing? I'm guessing this is partially correct:
Shimadzu8060RX (newer machine), Shimadzu8060RX.lcd, Intensities ~100 times lower, Opens correctly, ???, ???
I'm very curious to know what the Shimadzu engineer has to say about the (complete, please!) update history of the RX system. I'm guessing the key to fixing this is going to be teasing the version and SP number out of the file to know whether or not we need to give it special treatment.
Brian
|
| |
| Wesley Vermaelen responded: |
2025-12-04 18:01 |
Hi,
Sorry I tried to find where those two files (Shimadzu8060NX.lcd, Shimadzu8060RX.lcd) come from but that I don't remember (I renamed the file so it would be easier to distinguish between NX and RX).
It has been more than a year...
But it must have been something like this:
Shimadzu8060RX (newer machine),Shimadzu8060RX.lcd,ERROR: Contains no usable data,Not tested,Probably a method I made myself
I'll know more on Monday from the engineer.
Wesley
|
| |
| Wesley Vermaelen responded: |
2025-12-08 14:50 |
Hi,
I spoke to the engineer and he hasn't changed any software, and the software on the machine is still the original software from when the machine was first installed.
Wesley
|
| |
| Brian Pratt responded: |
2025-12-08 15:52 |
OK, thanks. I'll keep trying to understand how these files differ.
|
| |
| Brian Pratt responded: |
2025-12-08 17:34 |
Can you please supply the result of using Shimadzu's mzML converter on each of these .lcd files, so I can see what they think the contents should look like?
Thanks!
Brian
|
| |
 Cortisol_121_Skyline.png
 Cortisol_121_PostrunAnalysis.png
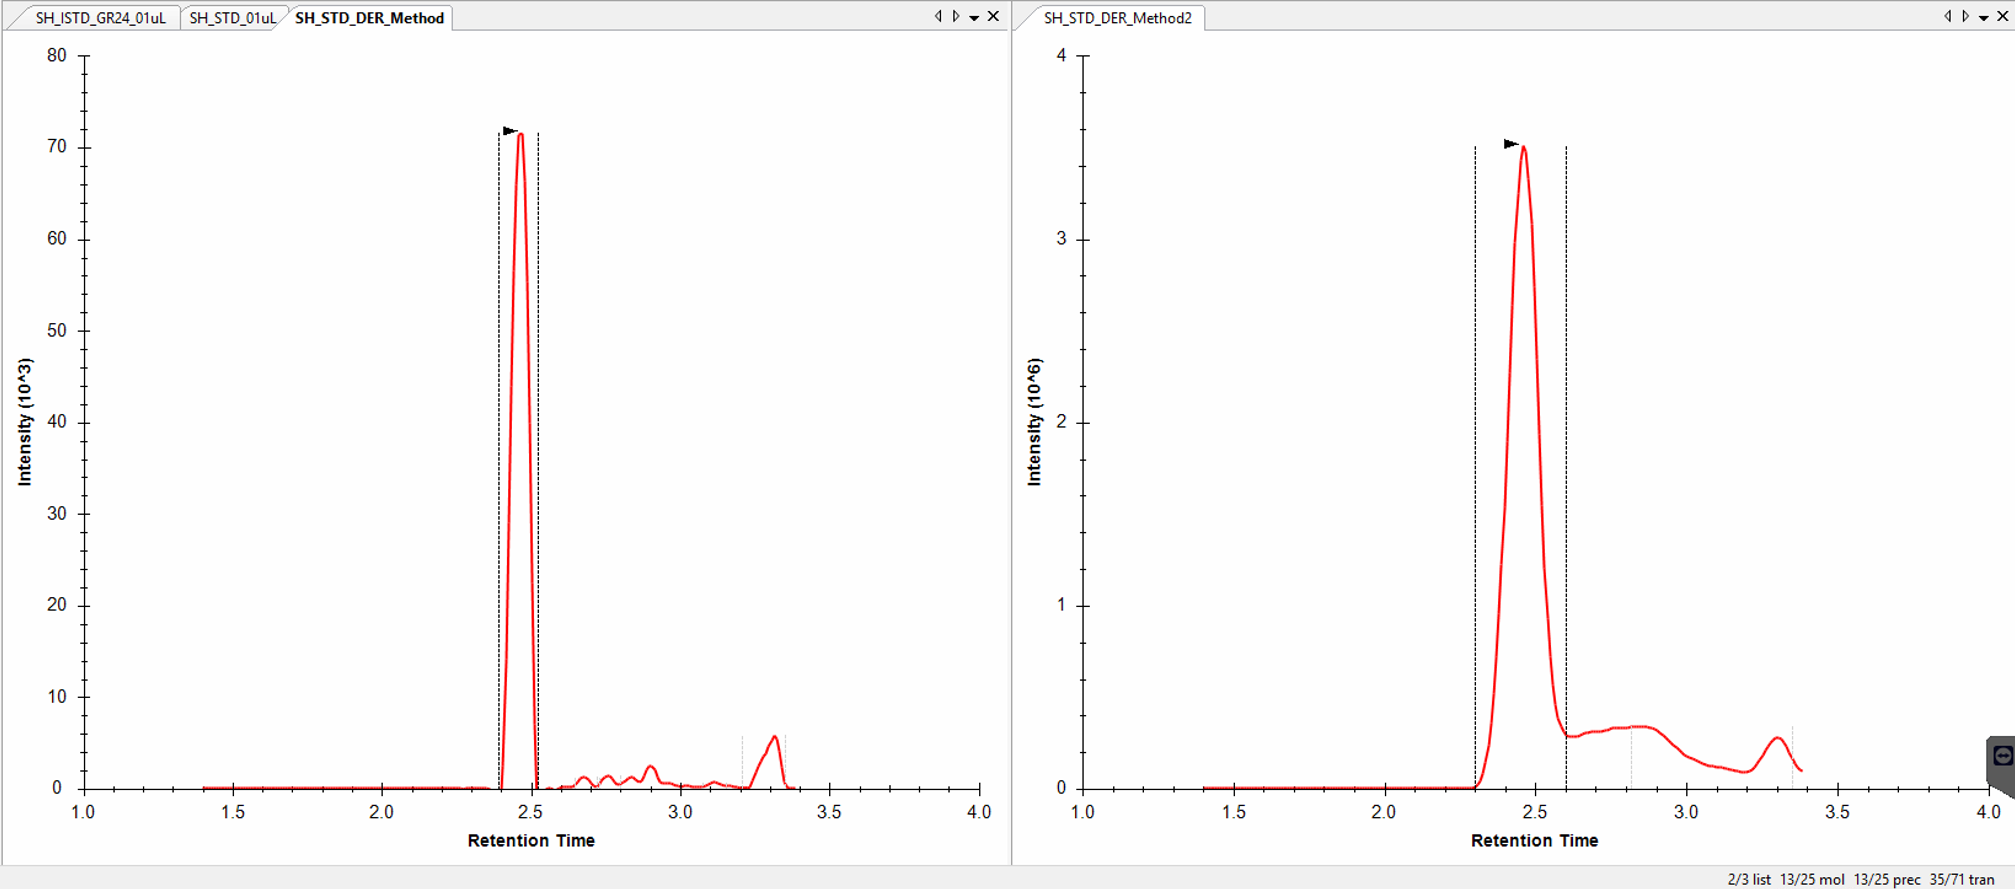 LCDvsMZML363_121.png
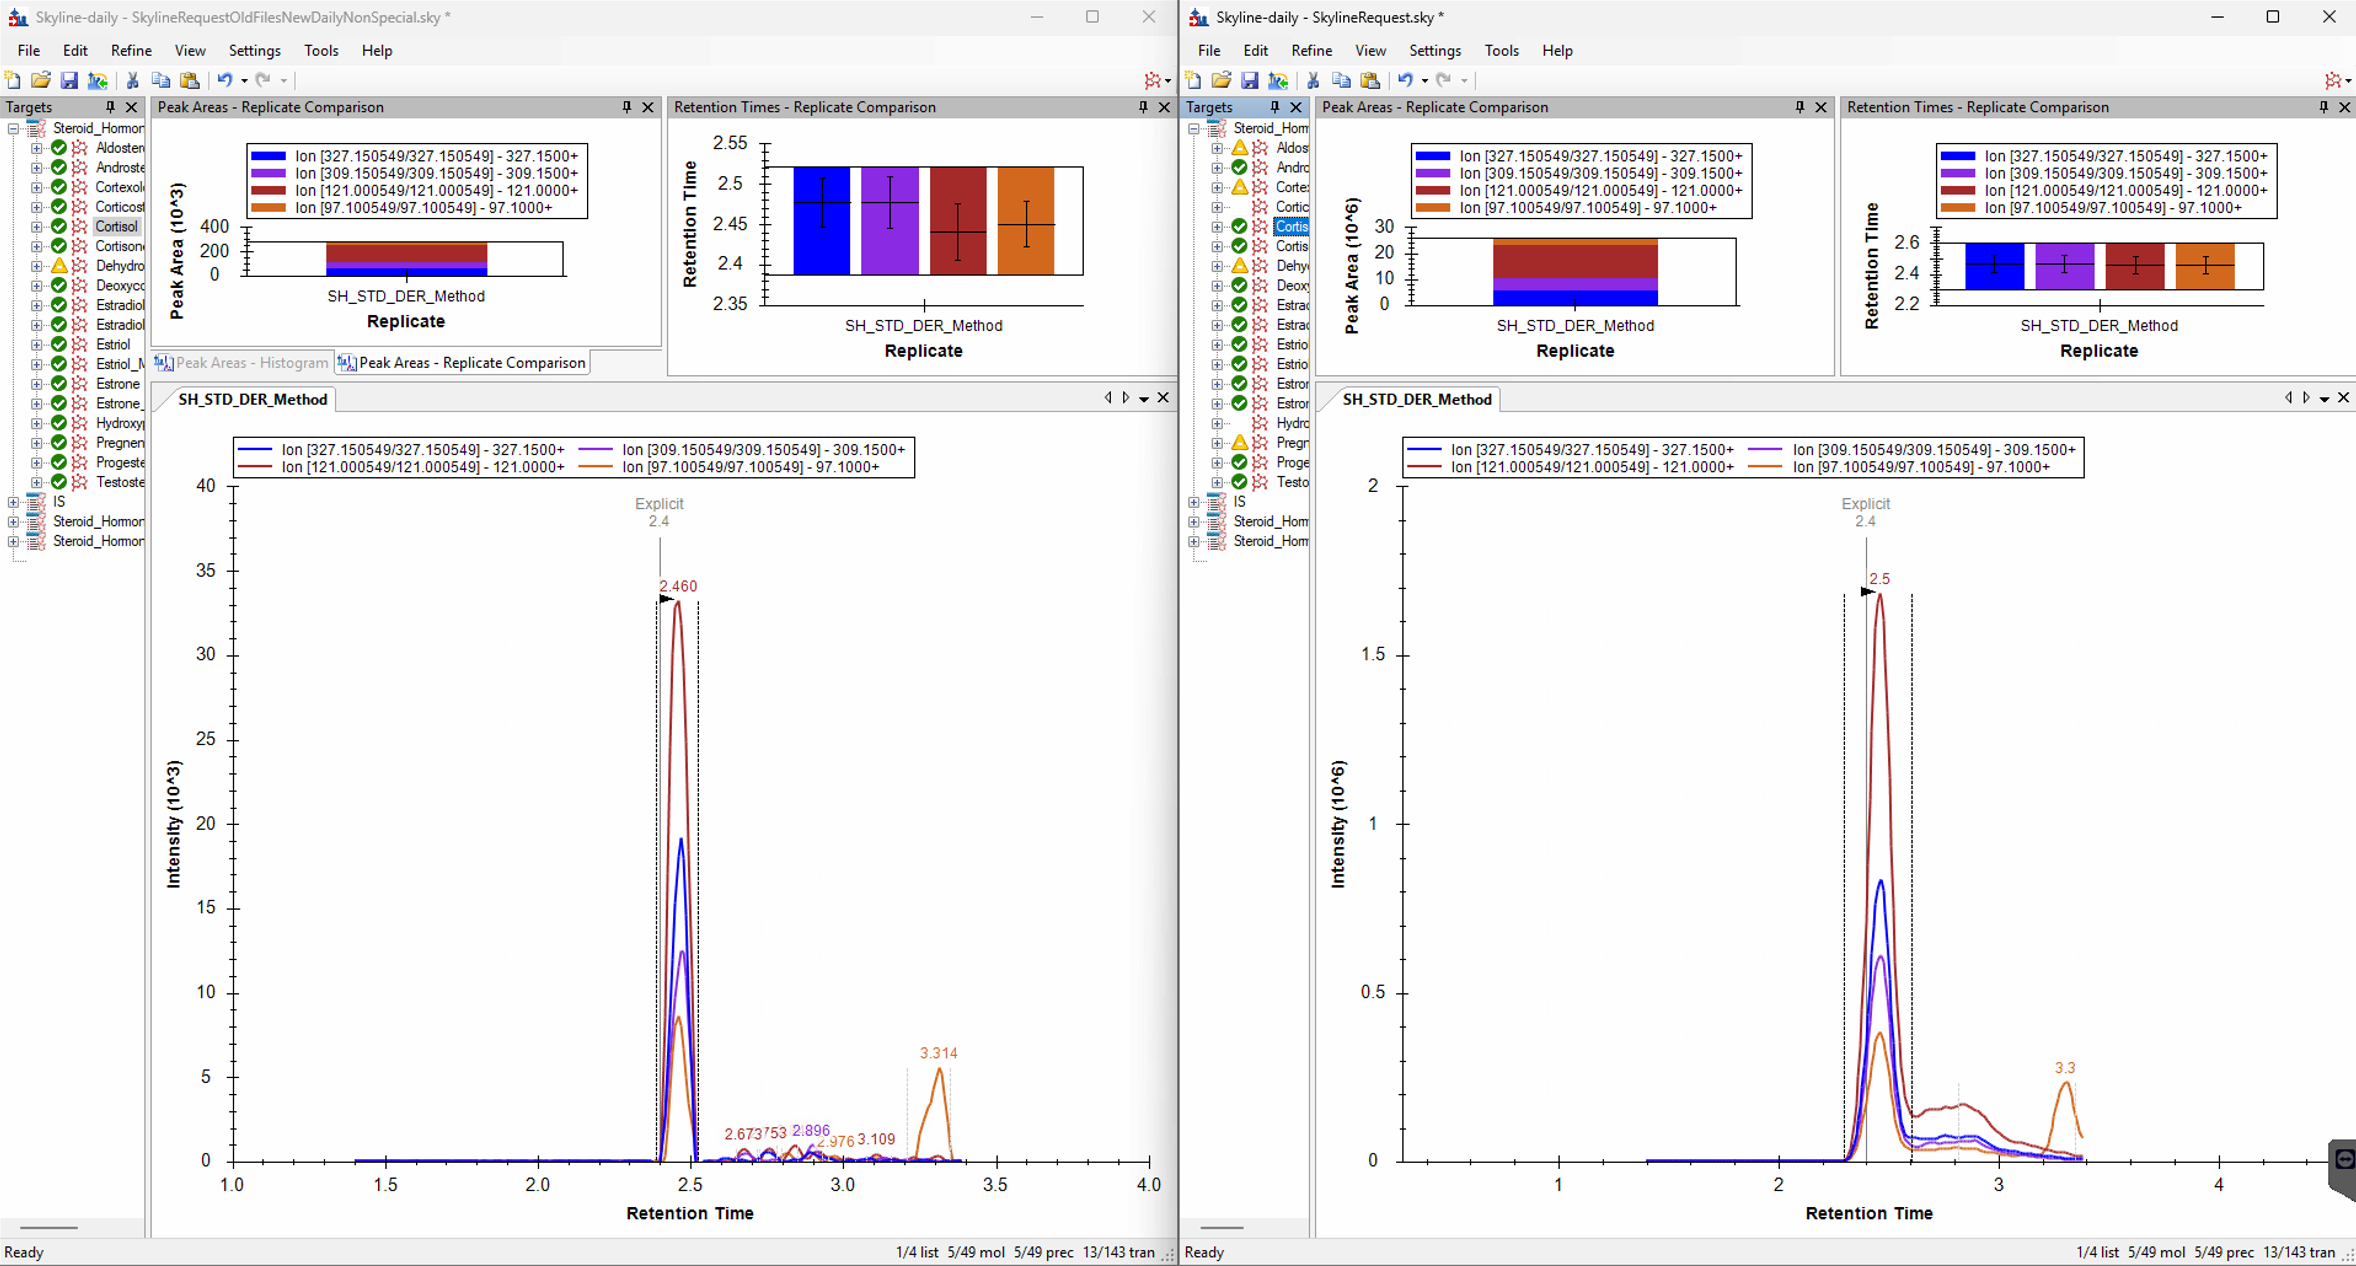 20251202_DailyVsSpecial.png
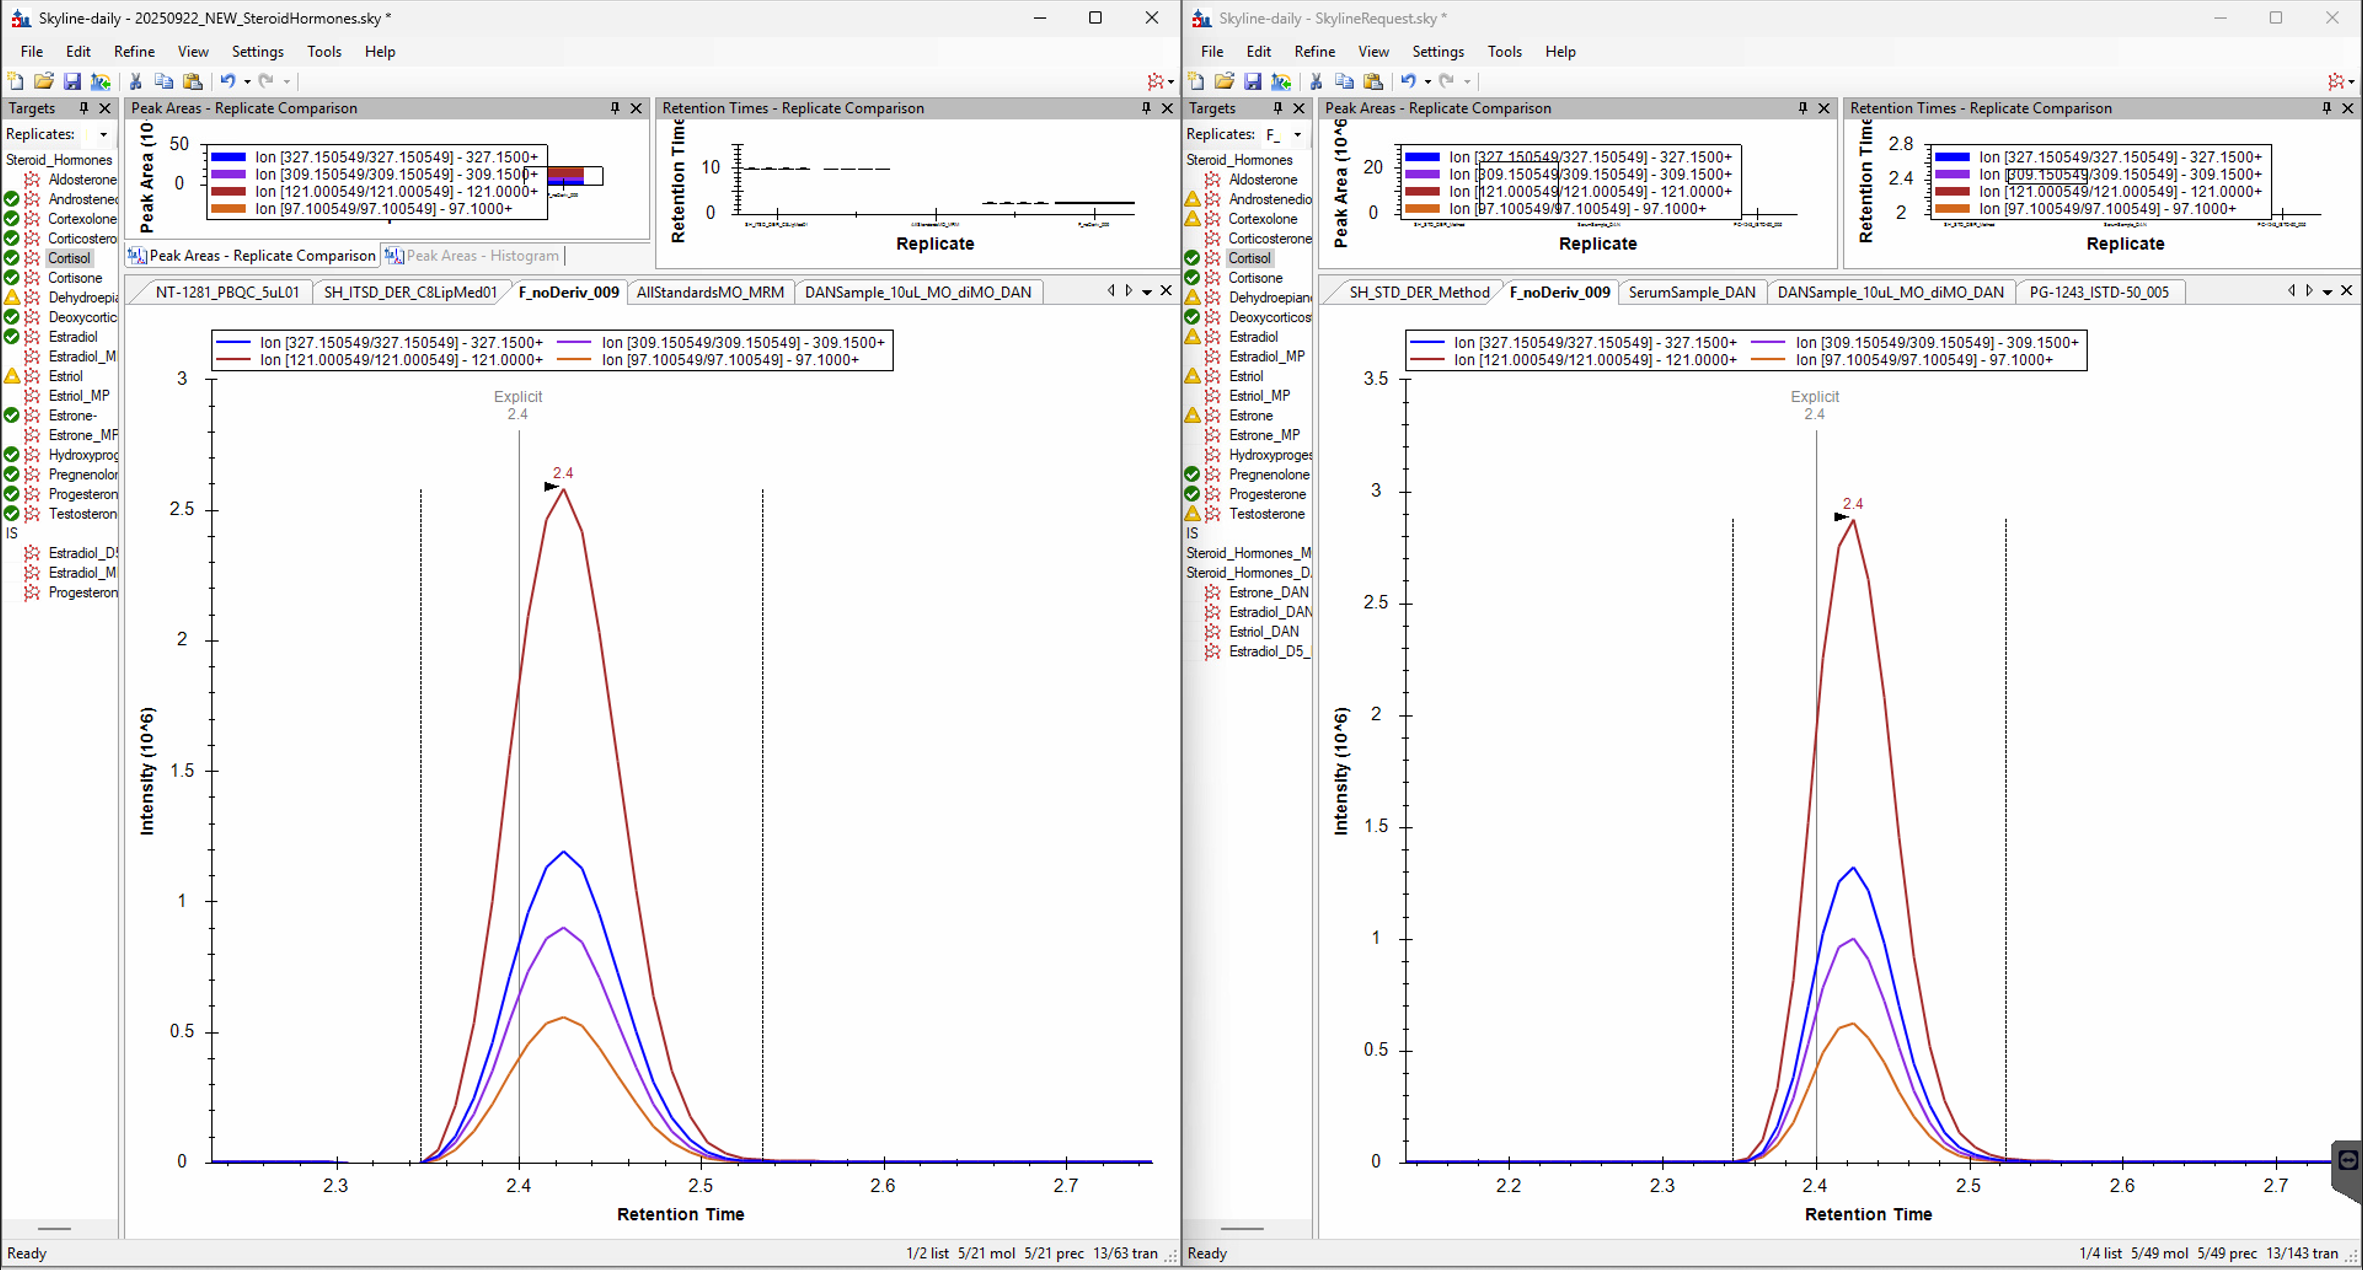 20251202_DailyVsSpecial_New.png
 20251202_SpecialError.PNG