Peak Area or Intensity for both Heavy and Light Peptides

support
Peak Area or Intensity for both Heavy and Light Peptides colin mcdowell  2023-09-11 10:51
 

Hello Skyline Team,

I have set up my skyline document to look for both heavy and light peptides. Is there a way, once i've imported my MS data, to have skyline show me the intensities and/or peak areas of the precursors and fragments for both the heavy and light peptides? Currently it only shows me the light peptides. Thanks!
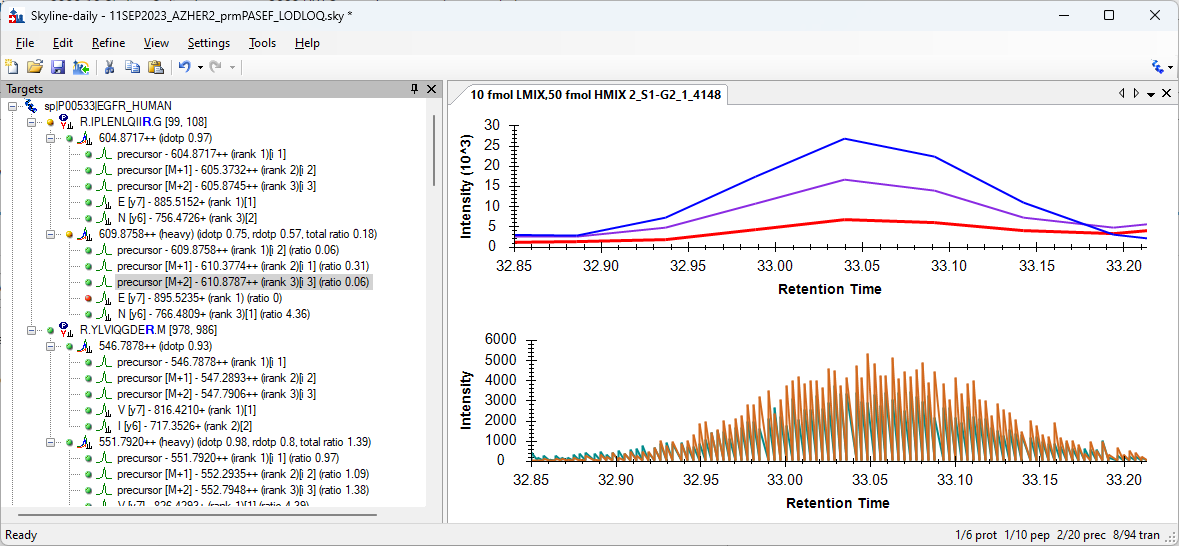
 
 
Nick Shulman responded:  2023-09-11 11:03
It sounds like Skyline is not extracting chromatograms for your heavy peptides.

The usual reason for that is that none of the MS2 spectra in your .raw file matched your heavy precursors. That might have something to do with the settings at "Settings > Transition Settings > Full Scan", or it might be that something else is going wrong.

Can you send us your Skyline document and one of your .raw files?
In Skyline you can use the menu item:
File > Share
to create a .zip file containing your Skyline document and supporting files including whatever chromatograms you managed to extract.

If that .zip file and/or your .raw file are less than 50MB you can attach the to this support request.
You can upload larger files here:
https://skyline.ms/files.url
-- Nick
 
colin mcdowell responded:  2023-09-11 12:36
Hi Nick,

I uploaded my skyline document but when I go to upload the .d folder for my raw files (bruker timsTOF) it wont upload the folder, is there a particular file within the .d folder which is the necessary file?
 
Nick Shulman responded:  2023-09-11 12:47
For .d folders, the best thing to do is to package the entire folder up into a .zip file and then upload the .zip file.
-- Nick
 
colin mcdowell responded:  2023-09-11 13:09
Hi Nick,

Just uploaded a compressed folder with the skyline docs and a .d file titled "11SEP2023_forSkylineSupport". Thanks!
 
Nick Shulman responded:  2023-09-11 13:23
Thank you for sending those files.
I don't think I understand your original question. Can you post a screenshot of what you were seeing?

It appears that your data is from an ion mobility experiment. With data like this, you need to do some sort of ion mobility filtering because without that, the chromatograms appear to be very jagged.

You might find some helpful information in the Ion Mobility tutorial:
https://skyline.ms/wiki/home/software/Skyline/page.view?name=tutorial_ims
-- Nick
 
colin mcdowell responded:  2023-09-11 13:35
Hi Nick,

I think my question might be more basic than what I originally wrote. What I am looking for is for skyline to generate a list of peak intensities and/or peak areas for all precursors and fragments in my target list, which includes both heavy and endogenous peptides. Is there a way I can generate that sort of report?
 
Nick Shulman responded:  2023-09-11 14:10
If you want to export lists of numbers from Skyline you should look at the Custom Reports tutorial:
https://skyline.ms/wiki/home/software/Skyline/page.view?name=tutorial_custom_reports
-- Nick