The FWHM is calculated by Skyline looking at the chromatogram for a particular transition. You can see those FWHM values in the document grid by looking at the column:
Proteins > Peptides > Precursors > Transitions > Transition Results > Fwhm
There is also a column called "Max Fwhm" which can be found at:
Proteins > Peptides > Precursors > Precursor Results > Max Fwhm
This "Max Fwhm" column contains the maximum Fwhm value across all of the transitions for the particular Precursor in a particular Replicate.
This Max Fwhm column displays its value as a simple number, such as "0.36".
There is another column which is also called "Max Fwhm" which can be found on the "Precursor Result Summary" at:
Proteins > Peptides > Precursors > Precursor Results Summary > Max Fwhm
This precursor result summary Max Fwhm gets its value by looking at the "Max Fwhm" values for a particular Precursor across all of the Replicates.
This Max Fwhm column displays its value as the average of the "Max Fwhm" values across all of the replicates, with a "+/-" indicating the standard deviation of those same "Max Fwhm" values across all of the replicates.
The Precursor Result Summary Max Fwhm has some child columns which you could also add to your report:
"Mean Max Fwhm"
"Stdev Max Fwhm"
"Cv Max Fwhm"
I am not sure that I understand your question. Can you send us a screenshot of what you are seeing, and/or can you send us your Skyline document and the report that you are using?
You can make it so that your report definition is included in your Skyline document. To do this, go to:
Settings > Document Settings > Reports
and check the checkbox next to the report that you have questions about.
After you have done that, you can go to:
File > Share
and create a .zip file containing your Skyline document and supporting files including extracted chromatograms.
If that .zip file is less than 50MB you can attach it to this support request.
You can upload larger files here:
https://skyline.ms/files.url
-- Nick
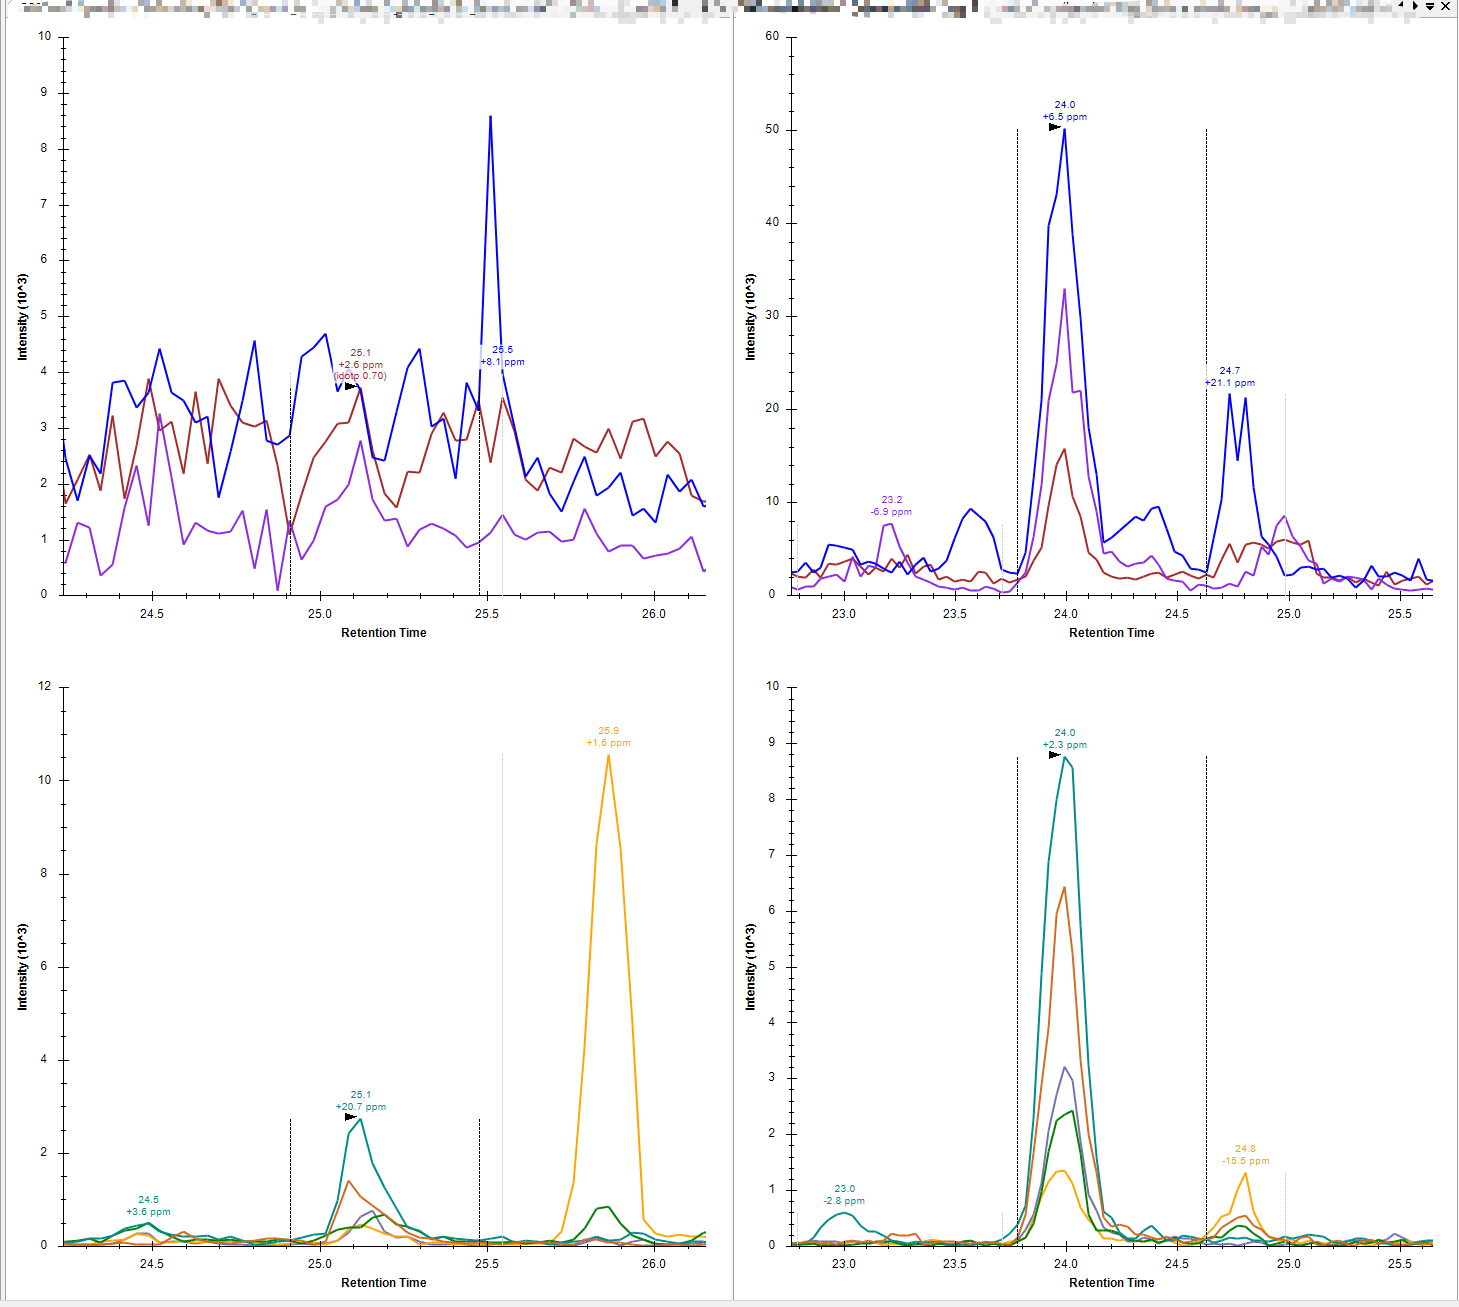 MS1_peak_CMP.png