What are those numbers in the legend of the 3D spectrum?

support
What are those numbers in the legend of the 3D spectrum? ho-tak lau  2021-12-20 15:26
 

Hi Skyline Team,

I am still new to IMS and trying to learn about the data using Skyline.
What do those numbers in the 3D spectrum legend mean? I have a 3D spectrum captured from Webinar 19. The 89407, 5024, 282 and 16. And there are always 4 different colors?

Thanks in advance.
Ho-Tak


Brian Pratt responded:  2021-12-20 15:36

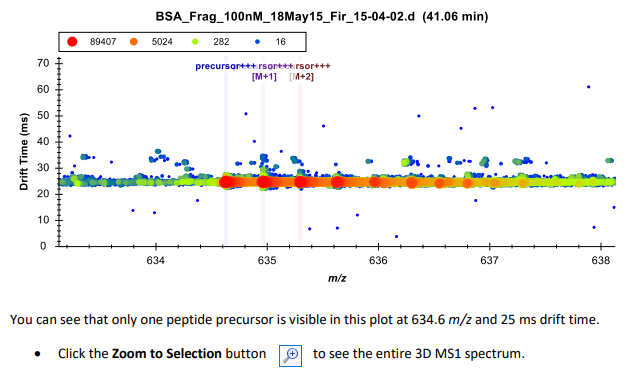
That heatmap has dimensions [m/z, ion mobility, intensity]. That legend is there to indicate the intensity range, which is continuously variable - those are just four selected points in the range to give you a sense of what the color scale is telling you.

Thanks for using the Skyline support board!

Brian Pratt