ehcan27006,
Unfortunately, no, there is still no way to customize the colors that Skyline chooses.
In the screenshot "Brad.jpg", those colors are actually a little different.
The first color is #027868 and the second is #007737.
The first color has more blue in it than the second.
The color that Skyline assigns to a molecule is based on the hash code of the molecule's name. It is a mathematical function that really does look at each character in the molecule's name.
There is also a second step which looks at the colors that have been assigned to all of the other molecules in the same molecule list, and if there are any colors which are too close to each other, then a different color is assigned to that one.
The amount of blue in the two colors in your screenshot is sufficiently different so that Skyline does not think that it needs to pick a different color.
The C Sharp code for this logic is here:
https://github.com/ProteoWizard/pwiz/blob/master/pwiz_tools/Skyline/Model/ColorGenerator.cs
I am not sure whether we have any plans to make this work better, but I agree there is some room for improvement.
-- Nick
 Colors Peaks skyline support.JPG
 mulitple peptide peak colors.JPG
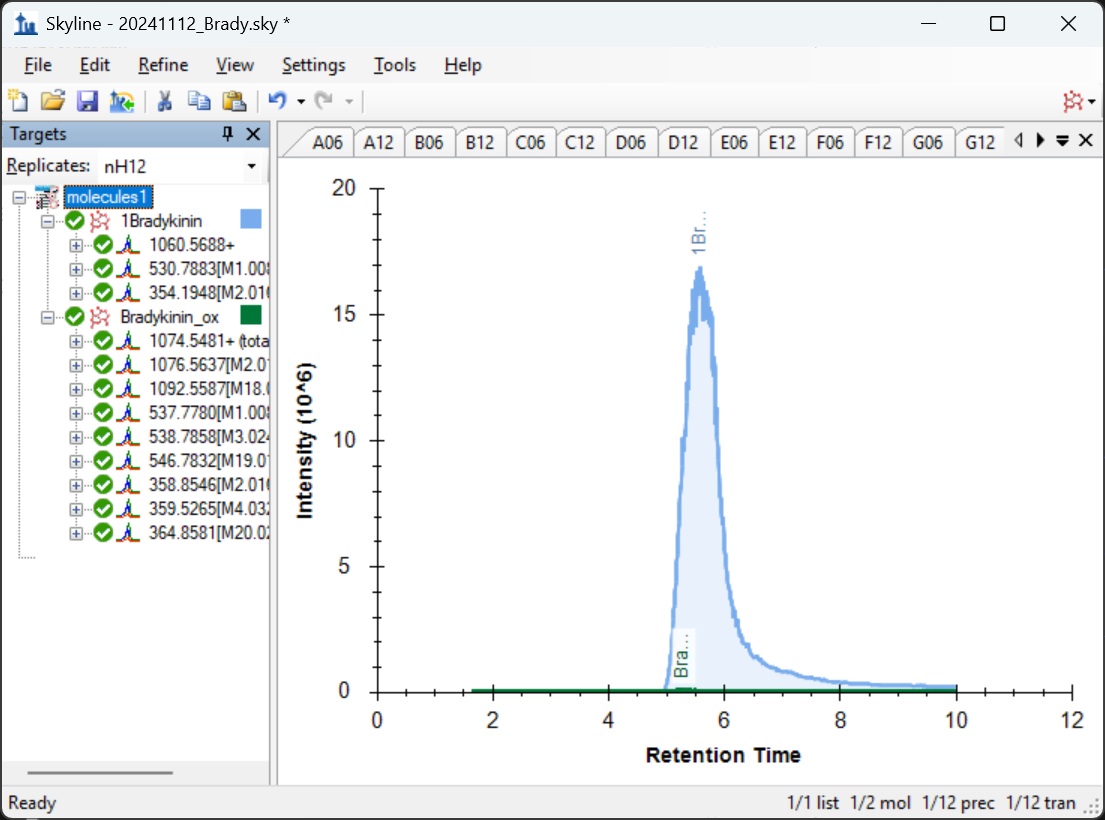 1Brad.jpg
 Brad.jpg