| Brian Pratt responded: |
2026-03-03 10:29 |
Hi Juan,
I can't reproduce that - I wonder if there's just a bad setting somewhere?
If you open the .sky file in a text editor you should find a line that looks like this:
<transition_full_scan precursor_isotopes="Count" precursor_isotope_filter="3" precursor_mass_analyzer="tof" precursor_res="10000" retention_time_filter_type="ms2_ids" retention_time_filter_length="5">
I wonder if precursor_mass_analyzer is set to some other value? In terms of the tutorial, consult the image after the phrase "The wizard will advance to the Configure MS1 Full-Scan Settings page, where you should do the following".
Cheers,
Brian Pratt |
| |
| Juan C. Rojas E. responded: |
2026-03-03 23:28 |
Hi Brian,
I have this displayed in Notepad++:
<transition_full_scan precursor_isotopes="Count" precursor_isotope_filter="3" precursor_mass_analyzer="tof" precursor_res="10000" retention_time_filter_type="ms2_ids" retention_time_filter_length="5">
It is the same as yours.
I just opened the file in Skyline-daily (v26.1.1.058) and it displayed the peaks in profile mode. It is only Skyline (v26.1.0.057) that is displaying the peaks as centroided even if the data was imported in profile mode.
I am attaching the Skyline v26.1.0.057 document.
Sincerely,
Juan C. |
|
| |
| Nick Shulman responded: |
2026-03-04 00:20 |
Juan,
Thank you for attaching that Skyline document.
Are you saying that when you click on a point along the chromatogram graph to display a spectrum, the window that comes up shows the spectrum in centroided mode instead of profile?
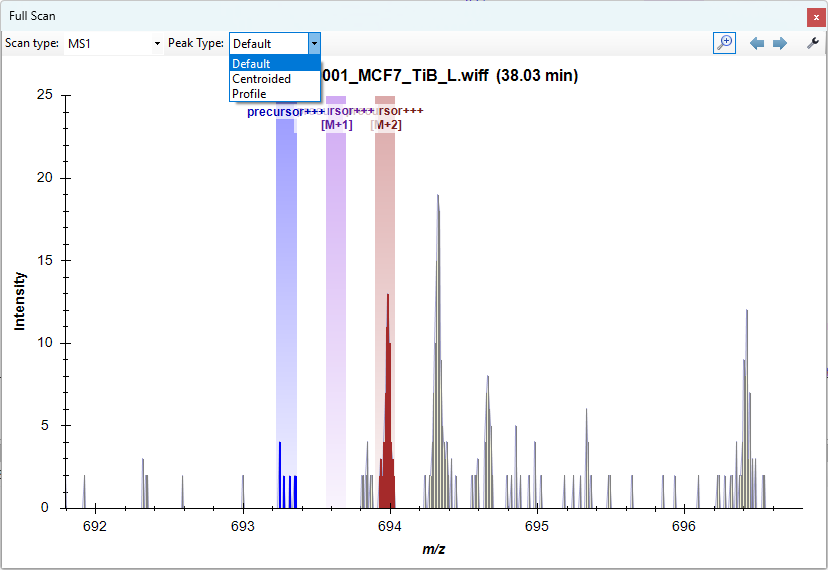
There is a "Peak Type" dropdown at the top of the top of the spectrum window. For a clean installation of Skyline, "Default" would be the chosen option in that dropdown and the profile spectrum would be displayed. You can also choose "Centroided" from that dropdown to see the centroided spectrum.
Skyline remembers the option that you chose.
If you go to the miscellaneous tab at "Tools > Options", there is a big button "Clear all saved settings".
If you push that button and then restart Skyline, does the spectrum viewer behavior go back to what you expect?
I might be misunderstanding the symptoms that you are describing. It might be helpful if you could attach a screenshot of what you are looking at.
The difference in behavior between Skyline-daily and Skyline 26.1 that you are describing sounds like the sort of thing that can happen because different versions of Skyline always store their settings in different folder. The settings file is always called "user.config", but the particular folder that it is stored in inside of the AppData folder in your home directory depends on the exact path to the Skyline executable.
-- Nick |
|
| |
| Juan C. Rojas E. responded: |
2026-03-05 06:15 |
Hi Nick,
Clearing the saved settings fixed the issue somehow.
It was quite strange because the drop-down menu for choosing the visualization option for "Peak Type" was not showing up.
If I can reproduce this scenario I will send a screenshot next time.
Thanks for the clear explanation!
Sincerely,
Juan C. |
| |
| Nick Shulman responded: |
2026-03-05 07:28 |
Thanks for the additional info.
There seems to be a bug in Skyline and the reason that Skyline was hiding the Peak Type dropdown is that it's remembering that the last time you looked at ion mobility data, you were looking at it as a 2-dimensional spectrum.
When you are now looking at an ordinary spectrum, Skyline is not displaying the "Show 2D Spectrum" button. However, Skyline's remembering of the fact that it used to be showing ta 2D spectrum is causing Skyline to not display the Peak Type dropdown.
We'll try to fix this bug.
-- Nick |
| |
 FullScanWindow.png