Usually people do SRM with a triple quadrupole instrument like the Xevo TQ.
It sounds like your mass spectrometer was run in scanning mode and has acquired what will look to Skyline to be ordinary MS1 and MS2 spectra.
I think what you have is a low resolution PRM experiment.
One of the things that you will have to do is go to the "Full Scan" tab at "Settings > Transition Settings" and make the settings look like the attached file. You should choose "QIT" for the precursor and product mass analyzers to tell Skyline that your instrument is low resolution and that Skyline should sum the signal across a wide m/z window when extracting chromatogram intensities.
Also, see that I have chosen "PRM" as the MS/MS filtering Acquisition Method. This means that the mass spectrometer was told to fragment particular precursor m/z's.
I would suggest that you do the "Small Molecule Targets" tutorial:
https://skyline.ms/wiki/home/software/Skyline/page.view?name=tutorial_small_molecule
The small molecule targets tutorial shows you how to add molecules to your document.
However, because your data are full scans instead of SRM chromatograms, before you do "File > Import > Results" you should go to the "Full Scan" tab at "Settings > Transition Settings" and change the settings so that they are like my attached screenshot.
If you get stuck, you should send us your files.
In Skyline you can use the menu item:
File > Share
to create a .zip file containing your Skyline document and supporting files including whatever chromatograms you have managed to extract.
You should also zip up and send us your Waters .raw folders.
Files which are less than 50MB can be attached to these support requests. You can always upload larger files here:
https://skyline.ms/files.url
-- Nick
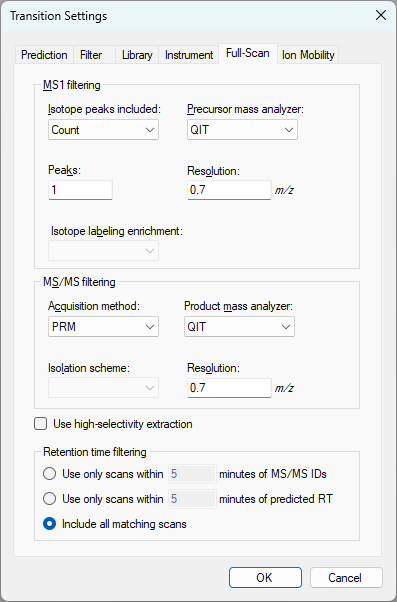 FullScanSettings.png
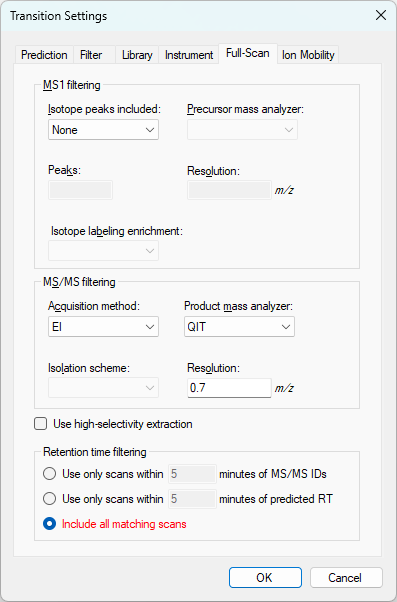 ElectronIonizationSettings.png
 1b3f0f3e-f99b-4f85-a147-f52a59fca627.png