Thank you for uploading that Skyline document.
One way to figure out why protein-level group comparisons are not working is to create a Report in the Document Grid which includes the "Protein Abundance" column.
When I make a report like that, I see that there are many cases where the Protein Abundance value is infinity, which is happening because the heavy peak area is zero.
Internal standards are supposed to be spiked into the sample at a high enough concentration so that Skyline has no trouble picking the correct peak. If any of those internal standards have an area of zero, then something has gone wrong.
Do you know why so many of your heavy standards seem to have zero chromatogram peak areas?
-- Nick |
Hi Nick,
Thank you for reviewing the file.
For protein quantification, I’ve selected one consistent transition per protein, choosing fragment ions that were consistently identified across samples (excluding y1 and b1 ions). Is this approach acceptable?
In some samples, I’m observing missing heavy peptide peaks. Since I spiked the heavy standards into all samples and was able to detect most fragments during calibration curve generation (using scheduled PRM), I’m uncertain whether the missing peaks are due to matrix effects or technical issues.
Given this, I’d appreciate your thoughts on the following options:
1) Using total area and excluding samples that lack a heavy peak (considered separately for each protein). If some samples are omitted, is it acceptable to proceed with statistical analysis involving different sample sizes across the groups?
2)Using normalized area values and imputing missing data (via Perseus, R, or MSstats), followed by fold change and p-value calculations.
Do you have any other suggestions or preferred strategies for handling this type of dataset?
-Akhila |
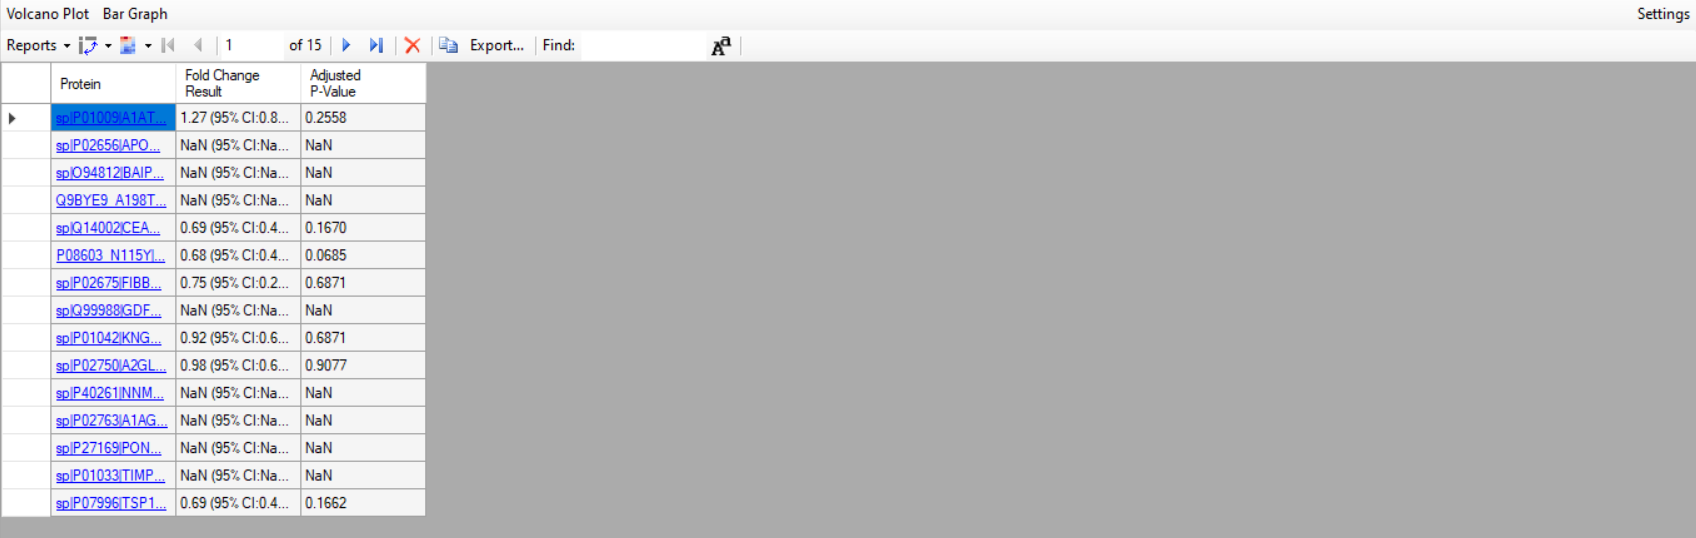 Comparison_foldchange.PNG