Hello! I love the Skyline Software.
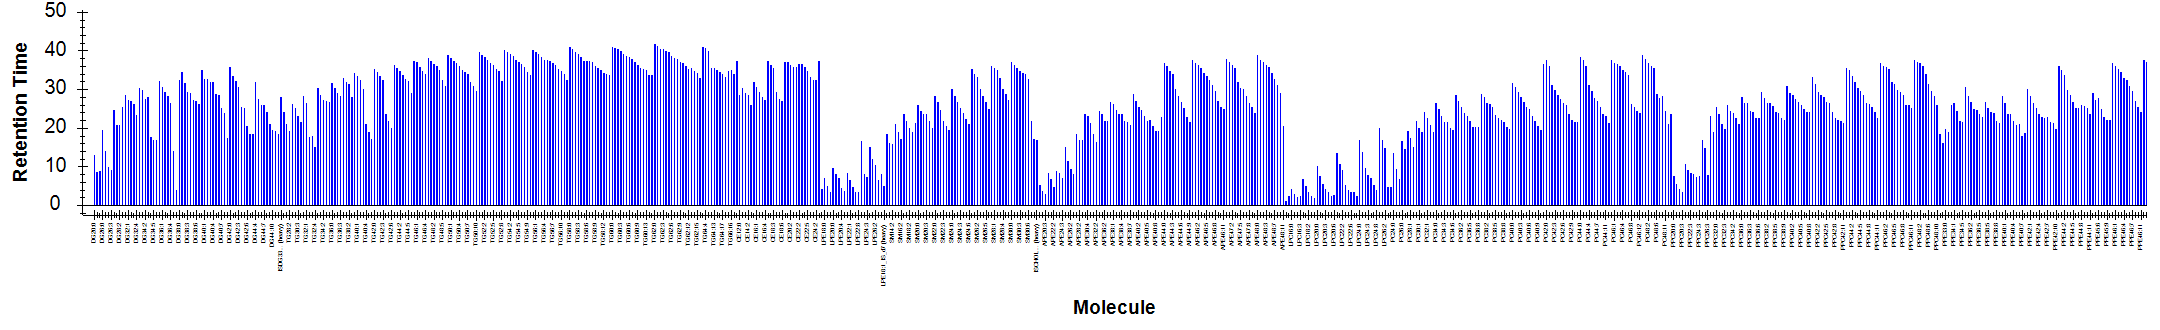
I just have one request: I work a lot with the Retention Times > Molecule Comparison Graph.
However, I have a lot of small molecules in a bunch of separate molecule lists (see picture). Is there a way to view that graph for one molecule list only instead of having one huge graph with all molecules from all lists combined? It would really help me work.
Best regards
Helena
 retentiontime.png
 Screenshot 2025-03-12 151414.png