The usual reason that a Protein would be missing from the fold change results is that some of the transitions had missing values or the peaks were truncated.
If any particular replicate is missing a value for any transition, then that replicate is excluded from the group comparison. If there are zero valid replicates for either group in the group comparison, then that protein will be missing from the results.
If you change the Group Comparison settings and check the checkbox "Use zero for missing peaks" then you will probably get results for a few more Proteins.
One reason that the Tukey's media polish might have results for more Proteins is that Tukey's media polish ignores a particular Transition if there not at least two replicates that have a peak area greater than 1. For this reason, the complete set of transitions that a Replicate needs is less, so there might be a few more Proteins included in the results.
If you still have questions about why a particular Protein has been excluded you can send us your Skyline document.
In Skyline you can use the menu item:
File > Share
to create a .zip file containing your Skyline document and supporting files including extracted chromatograms.
Files which are less than 50MB can be attached to these support requests. You can always upload larger files here:
https://skyline.ms/files.url
-- Nick
 volcano plot question.png
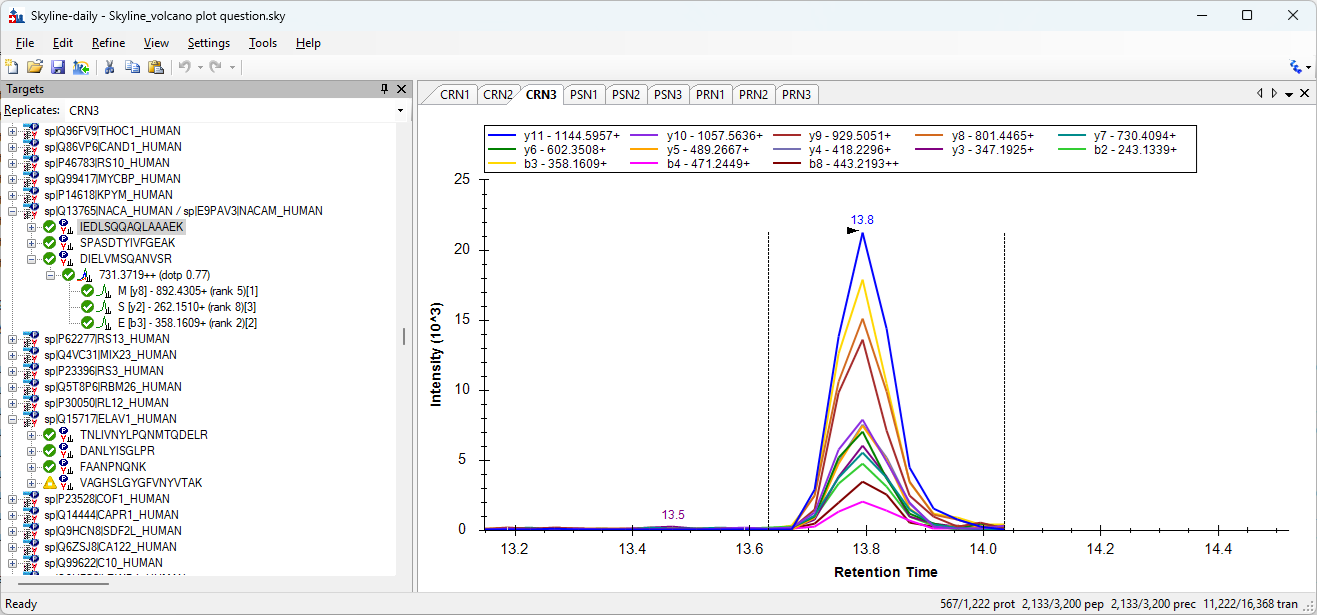 TruncatedPeaks.png
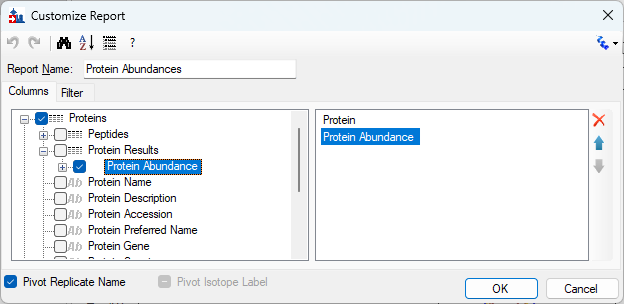 ProteinAbundanceReportEditor.png
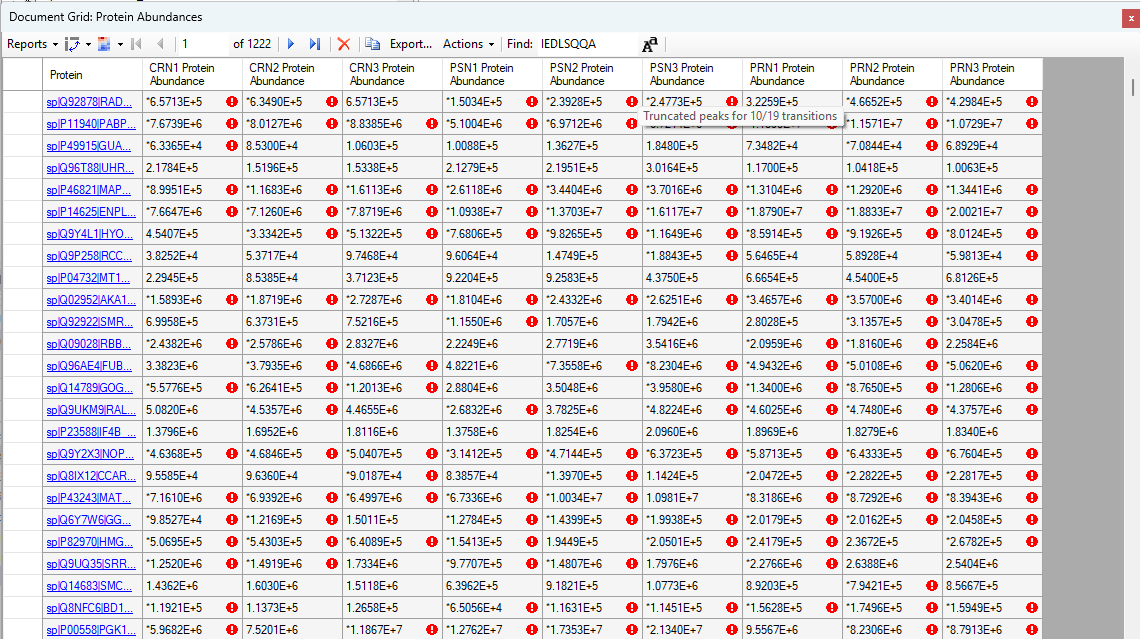 ProteinAbundancesReportWithTooltip.png