When a chromatogram has long straight lines it often means that there were very few spectra from which to extract chromatogram points.
This happens a lot with DDA data where there might be a long time between points where the mass spectrometer happens to have chosen to fragment a matching precursor.
This is not something that we see very often with MS1 chromatograms, because, usually, MS1 spectra are collected at regular intervals. However, I could imagine this happening because of something to do with ion mobility filtering.
Another thing that might be going on is that Skyline might be getting confused about whether an MS1 spectrum is a real MS1 spectrum or is actually a SIM scan. This had been a problem with Agilent centroided data, but it's conceivable that it might happen any time that Skyline is unable to figure out the m/z range over which data in MS1 spectra was collected. It's a long shot, but here is a support request which talks about what happens if Skyline is confused about the m/z range of MS1 spectra:
https://skyline.ms/announcements/home/support/thread.view?rowId=52933
If you send us your Skyline document and your Bruker .d folder we would probably be able to figure out what is going on.
In Skyline you can use the menu item:
File > Share
to create a .zip file containing your Skyline document and supporting files including extracted chromatograms.
That Share Document dialog gives you the option to include the .d folders in the .zip, or you can send those to us separately.
Files which are less than 50MB can be attached to these support requests.
You can always upload larger files here:
https://skyline.ms/files.url
-- Nick
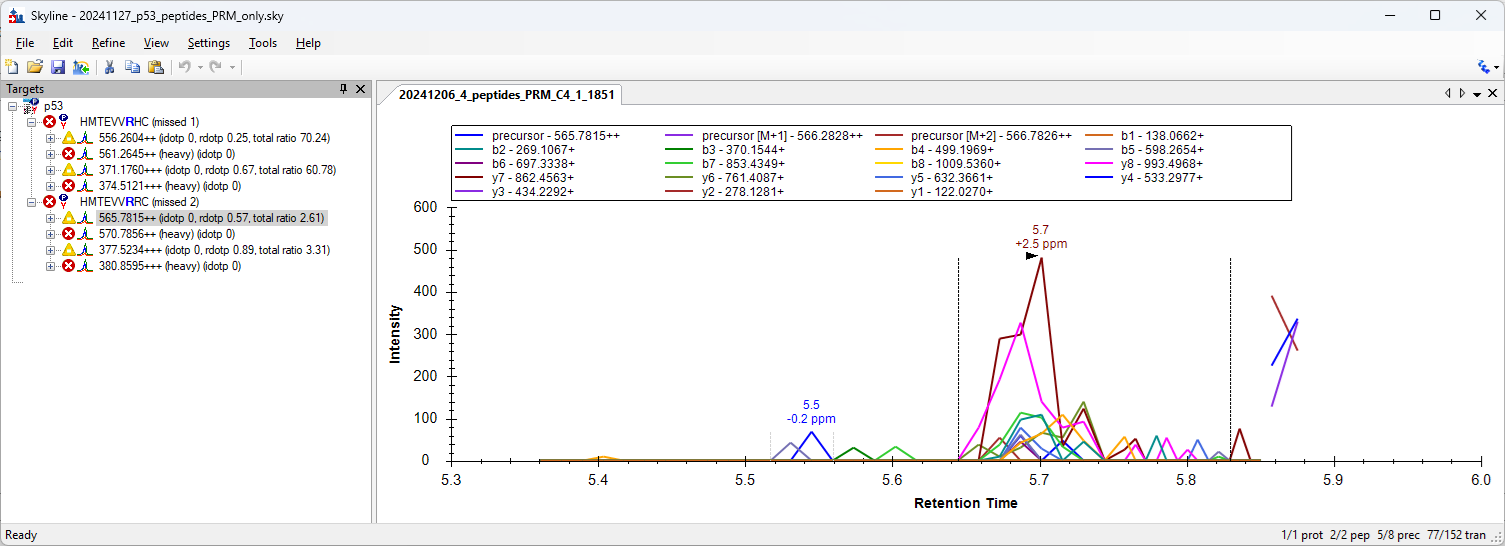 Chromatograms.png