| Nick Shulman responded: |
2024-06-18 08:38 |
Can you send us your Skyline document and one or more of your .raw files?
In Skyline you can use the menu item:
File > Share
to create a .zip file containing your Skyline document and supporting files including spectral libraries and whatever chromatograms might have been extracted.
Files which are less than 50MB can be attached to these support request. If that .zip file and/or your .raw files are larger than that you can zip everything up together and upload it here:
https://skyline.ms/files.url
-- Nick |
| |
| jaenyeon responded: |
2024-06-18 08:47 |
Thank you for your response Nick.
I've just uploaded the some raw files and skyline file as your instructions. |
| |
| Nick Shulman responded: |
2024-06-18 09:06 |
Thank you for sending those files.
I see that you have many chromatograms that are completely flat because there was no observed signal, but I am not sure what you are expecting to see.
If you click on a point along the chromatogram, Skyline will bring up a spectrum viewer that will show you the spectrum that contributed to that extracted chromatogram intensity. The spectrum viewer will highlight the m/z channels around your transition product m/z's. If you want to increase the width of the channel that Skyline is summing across, you can set the "Resolving Power" to a lower number at "Settings > Transition Settings > Full Scan".
Can you maybe post a screenshot of what you are seeing and describe what you were hoping it would look like?
-- Nick |
| |
| jaenyeon responded: |
2024-06-18 09:48 |
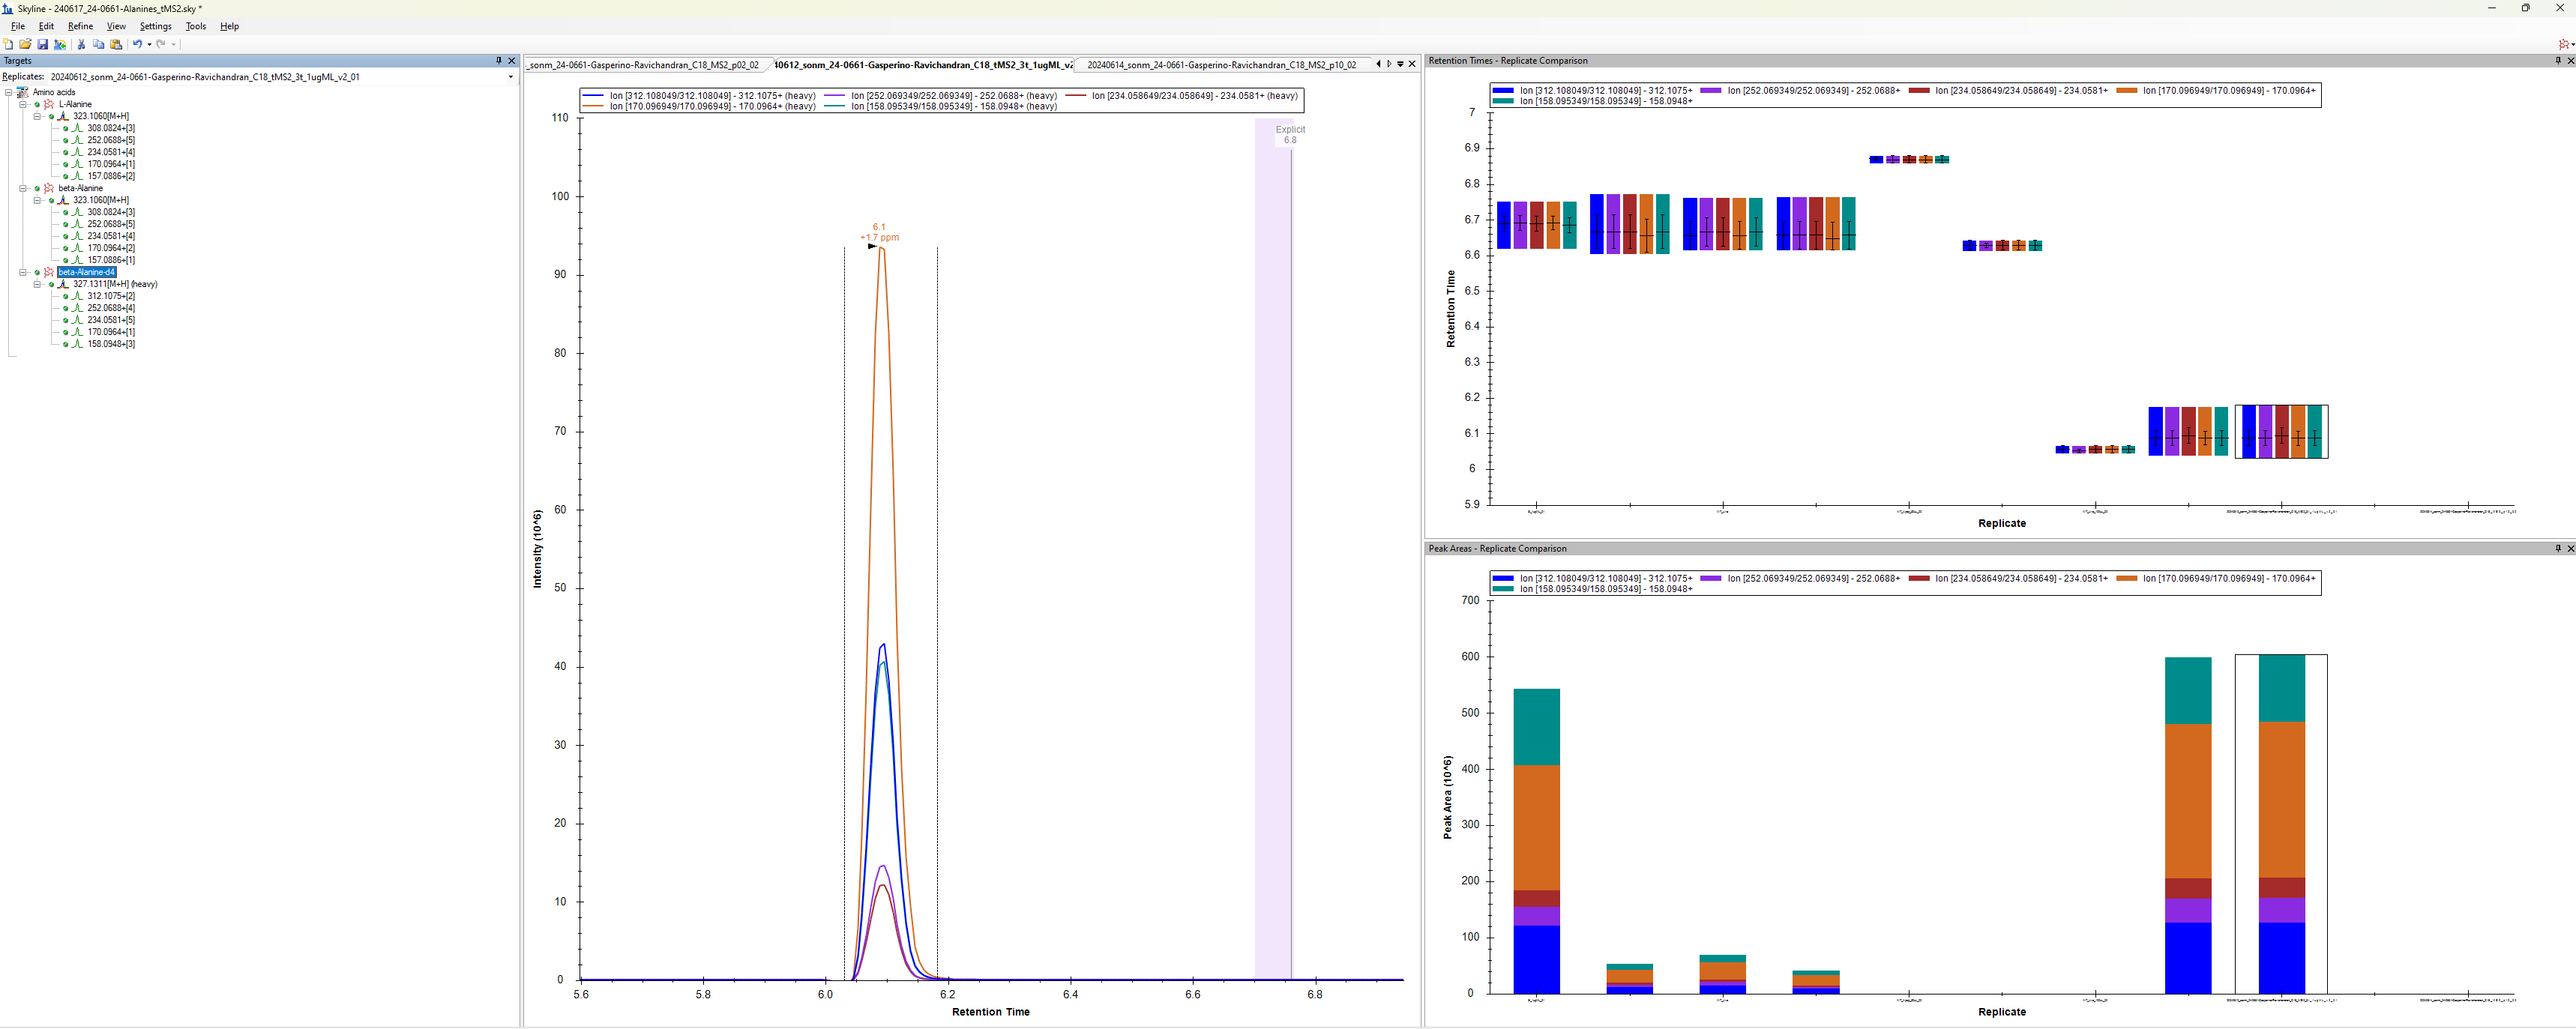
From sample of ss1(20240612_sonm_24-0661-Gasperino-Ravichandran_C18_tMS2_3t_1ugML_v2_01),
we can see the peaks of the target but not on ss2(20240614_sonm_24-0661-Gasperino-Ravichandran_C18_MS2_p10_02).
Using Freestyle from Thermo, we could have detected peaks in same RT and Mass but wasn't able to seen in Skyline. |
|
| |
| Nick Shulman responded: |
2024-06-18 10:14 |
Thank you for clarifying.
The problem is that the "Explicit Retention Time" has been set on these molecules to a number which is outside the time range of available spectra in the .raw files.
Skyline always discards chromatograms that do not overlap with the molecule's Explicit Retention Time.
In Skyline-daily, a warning message will be displayed in the Immediate Window when this happens, but in regular Skyline 23.1 right now, Skyline discards the chromatograms without telling you.
You can fix this by using the Document Grid to change the Explicit Retention Time values to a number which is within the time range of available matching spectra in the .raw file, or by setting the Explicit Retention Time to be blank.
-- Nick |
| |
| jaenyeon responded: |
2024-06-18 10:37 |
Thank you so much for the solution.
I tried to change "Explicit Retention Time" as your instruction but it seems that all those results are not in the criteria were not presented in document grid. Should I make a blank skyline file with transition list and to import only those files which can't be loaded? |
|
| |
| Nick Shulman responded: |
2024-06-18 10:46 |
If you choose "Molecules" from the Reports dropdown in the Document Grid you will be able to set the Explicit Retention Time values.
The Document Grid is very customizable and is a great way to see all of your data and potentially export it to CSV files.
The Custom Reports tutorial is a great place to learn about the Document Grid:
https://skyline.ms/wiki/home/software/Skyline/page.view?name=tutorial_custom_reports
-- Nick |
| |
| jaenyeon responded: |
2024-06-18 11:44 |
It worked.
After deleting ERT the peaked were present.
Thank you so much for the help. |
| |
 ss1.png
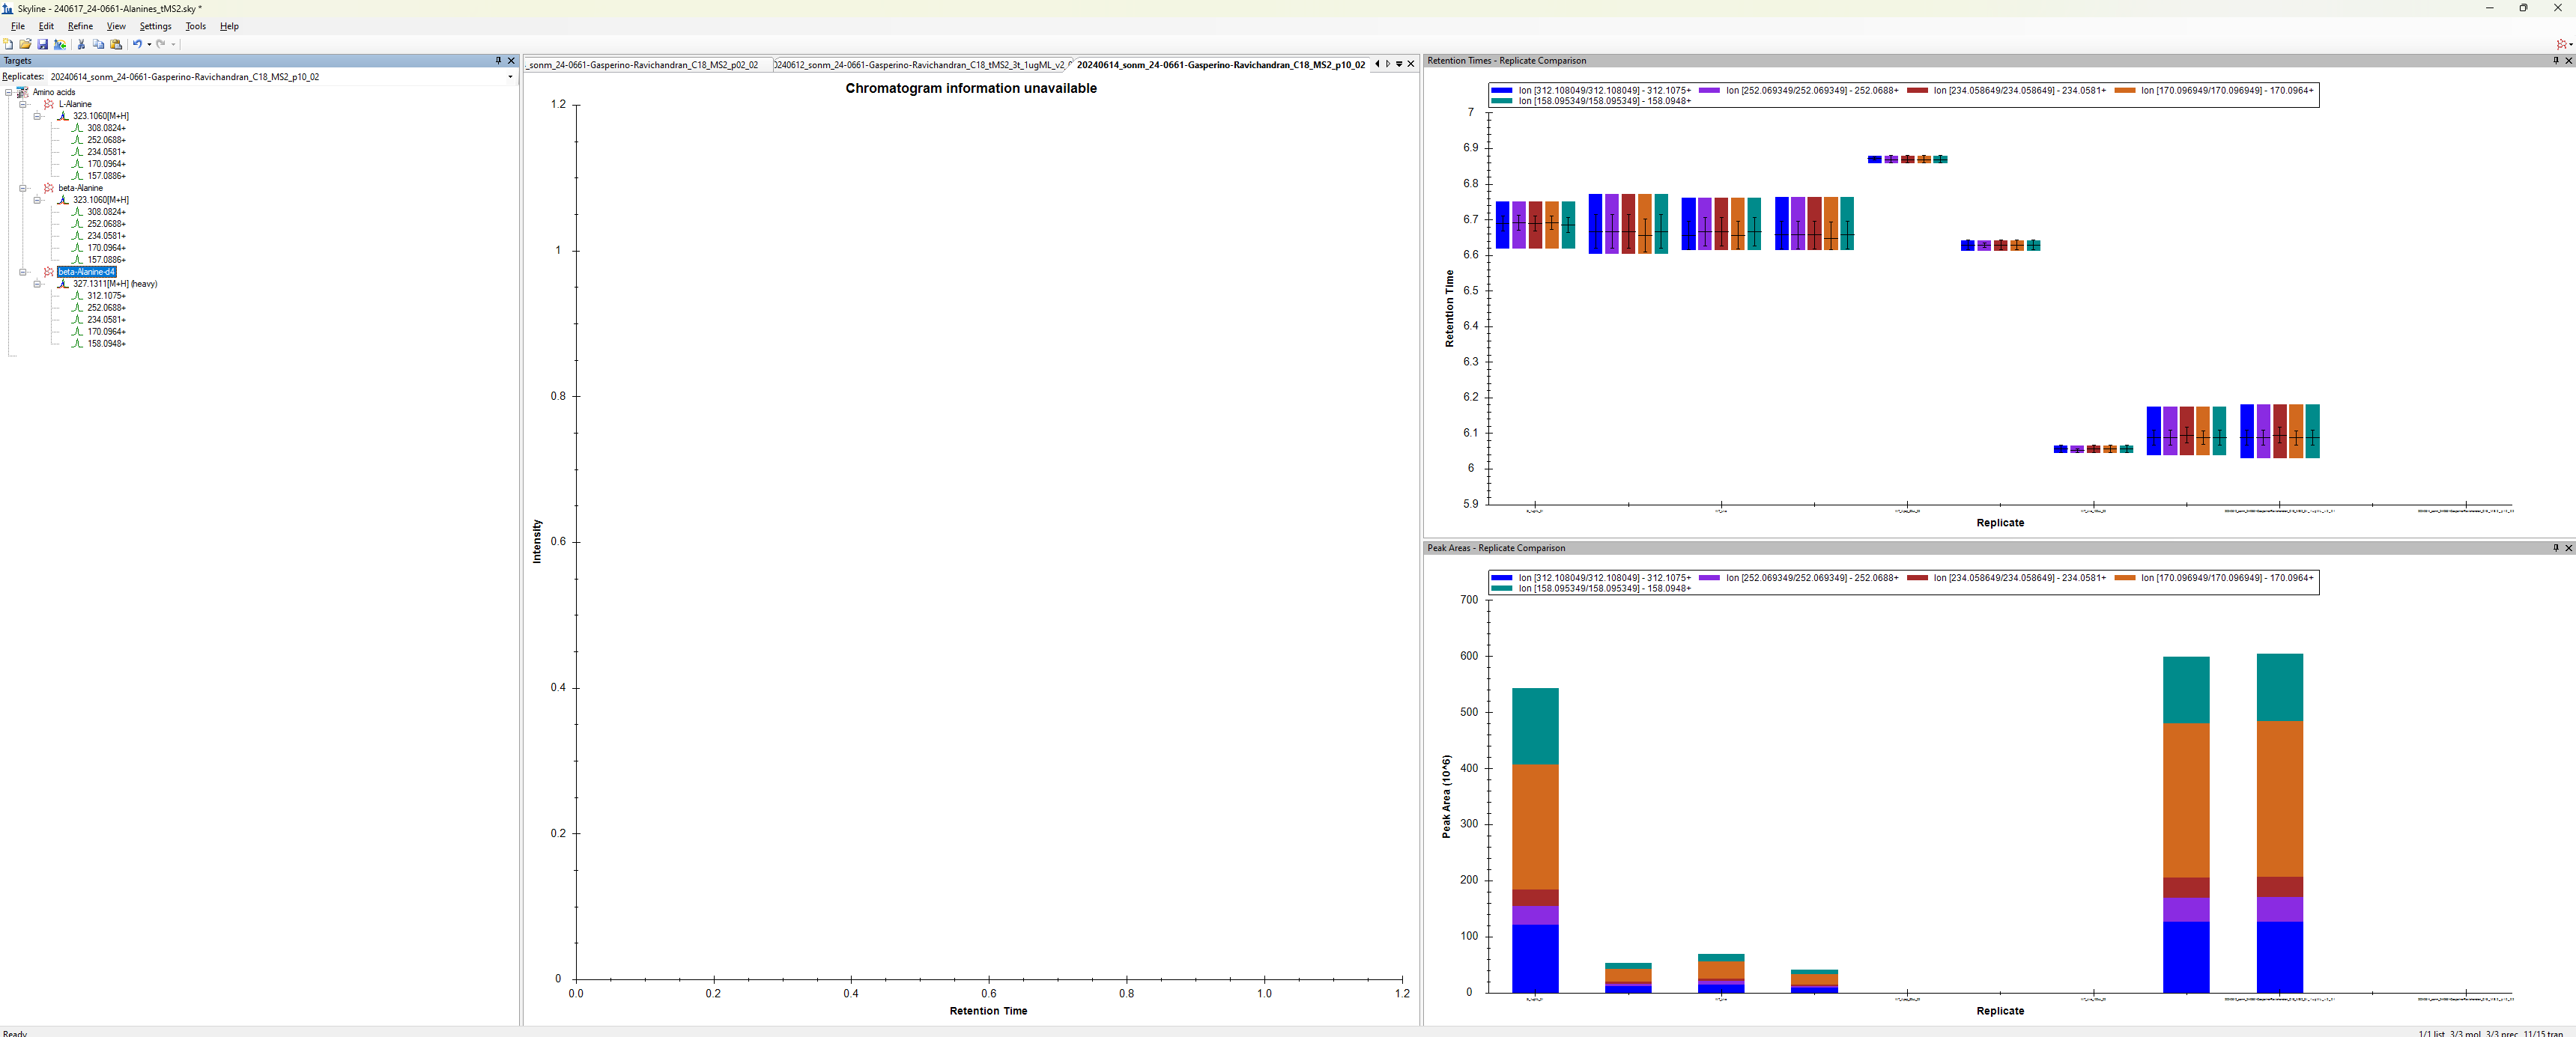 ss2.png
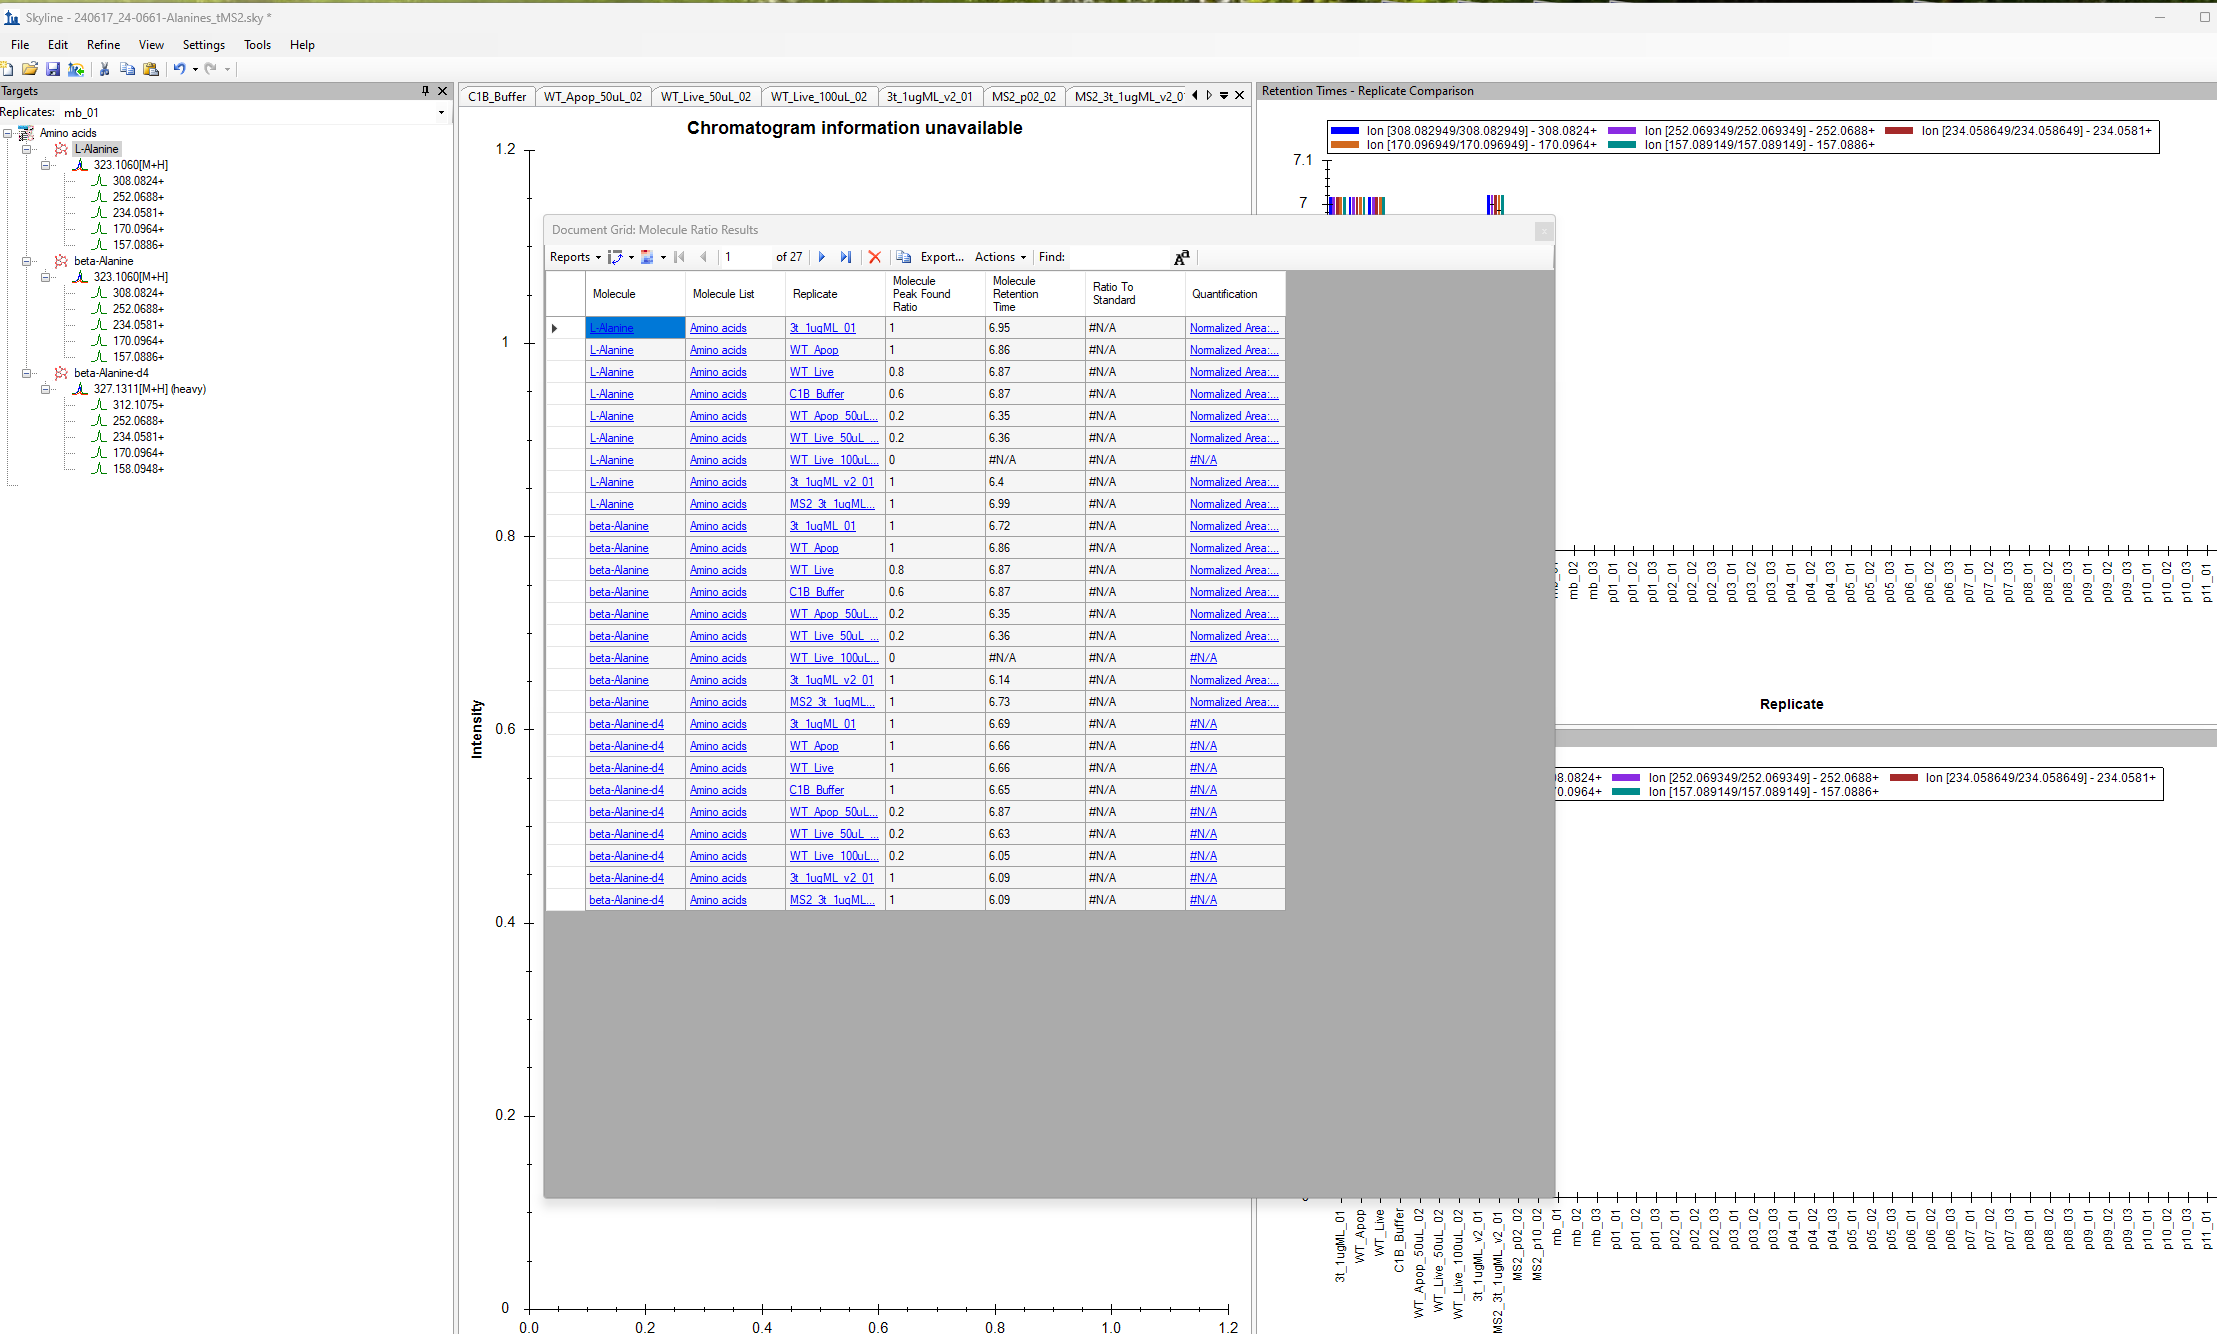 ss3.png