If you send us your Skyline document I would be able to tell you what is going wrong.
In Skyline you can use the menu item:
File > Share
to create a .zip file containing your Skyline document and supporting files including extracted chromatograms.
If that .zip file is less than 50MB you can attach it to this support request. You can always upload larger files here:
https://skyline.ms/files.url
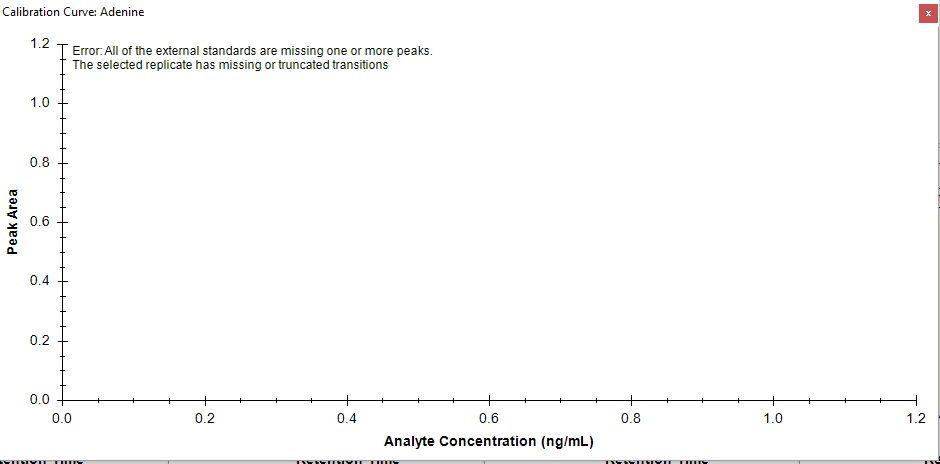
One common reason that you might see the "all of the external standards are missing one or more peaks" can happen if everything is an internal standard. That is, if you go to "Settings > Molecule Settings > Labels" there might be a checkmark next to the only type of precursors that you have in your document.
Skyline assumes that the internal standard will be spiked into each replicate in the same amount. Therefore, quantification must be done using something else. If this is the problem, then you can fix it by unchecked the checkbox next to the label types at "Settings > Molecule Settings > Labels".
There are other things that might be going wrong involving the settings at "Settings > Molecule Settings > Quantification".
After I see your Skyline document I will probably be able to tell you what is going wrong.
-- Nick
 Capture.PNG
 Adenine peak intensity.PNG
 Calibration curve concentration.PNG