| Distinguishing between heavy carbon and heavy hydrogen | molly hopper | 2024-02-22 11:24 | |||||||||||||||||||||||||||||||||||||||||||||||||
I'm working on a small molecule tracing experiment where we've added a duterated molecutle (D5 Glutamate) as in internal standard in our study, and have a heavy labeled carbon tracer. We're trying to trace the heavy carbons, and in an unlabeled control, we've noticed a slight signal for [M5C13-H]. I am interpreting this as an issue with the masses being so close that skyline believes them to be the same peak. We have the resolution to see the difference between [M5H2-H] and [M5C13-H] on the instrument (Thermo Exploris 240). I'm hoping for some help with how we can resolve the peaks in skyline, as we're soon to start a study that uses C13N15 tracers. Current Transition Settings: I've tried changing both of these settings with no change to the integrations. Windows 10, Skyline 64-bit 23.1.0.380 Thanks! |
|||||||||||||||||||||||||||||||||||||||||||||||||||
| |||||||||||||||||||||||||||||||||||||||||||||||||||
 Screenshot 2024-02-22 142143.png
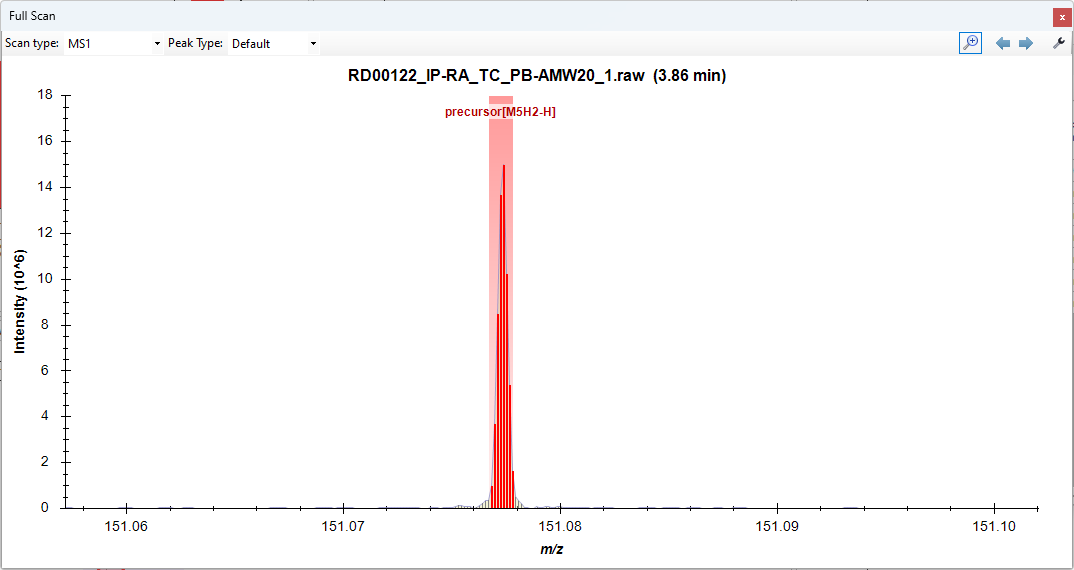 D5.png
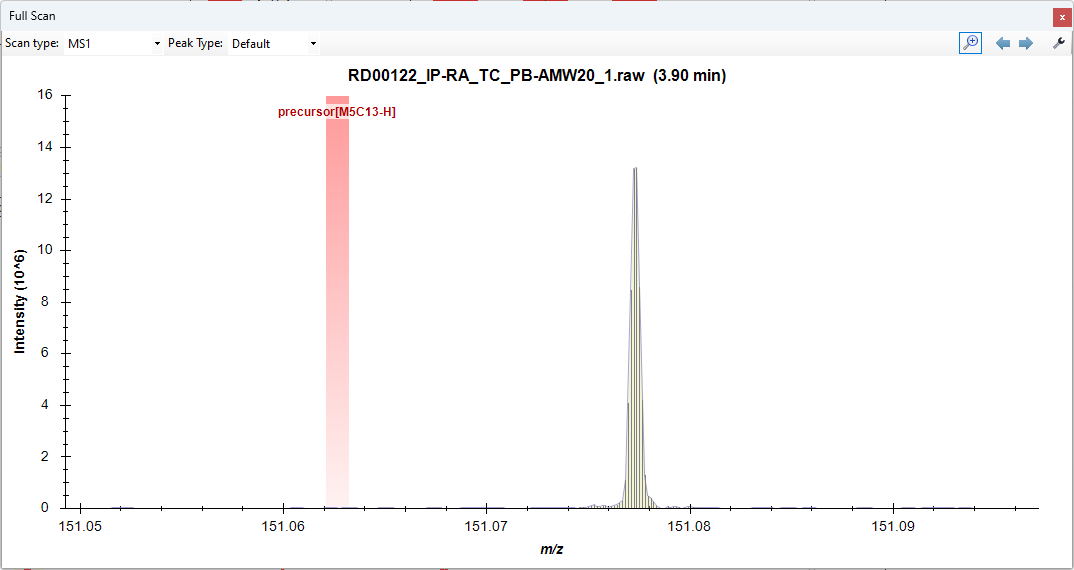 13C5.png