log2 scale for group comparison

support
log2 scale for group comparison hwang2  2024-01-04 07:30
 

I'm using Skyline 22.2.0.527 and 23.09. For group comparison and p-value calculation, current version has three normalization methods: none, equalize to medians and ratio to heavy. Could you add log2 option for p-value calculation?

Thanks

honghui


Nick Shulman responded:  2024-01-04 08:28
I do not understand your question.
The purpose of normalization is to correct for differences which might be observed in the raw data which are not caused by the biology that you are trying to measure. That might be differences in the amount of sample that was loaded onto the column, or differences in digestion efficiency of the enzyme that was used.
The p-value is a number that you get after performing calculations on the observed data.
It does not really make sense to talk about "normalizing" the p-value. Is there a different word that you might have been thinking of?

By the way, if you would like to learn more about how Skyline calculates fold changes, there is some information here:
https://skyline.ms/announcements/home/support/thread.view?rowId=43007
-- Nick
 
hwang2 responded:  2024-01-04 11:46
Hi Nick,

Thank for the link. This is the same question I asked. I'm processing lipid data for group comparison. Manually, I can export the raw data (area peak intensity) and calculate adjusted p-value. To calculate p-value, area peak intensity is generally transformed to log2 scale. The reason for log2 transformation is well-explained by a review paper (Analytical and Bioanalytical Chemistry, 
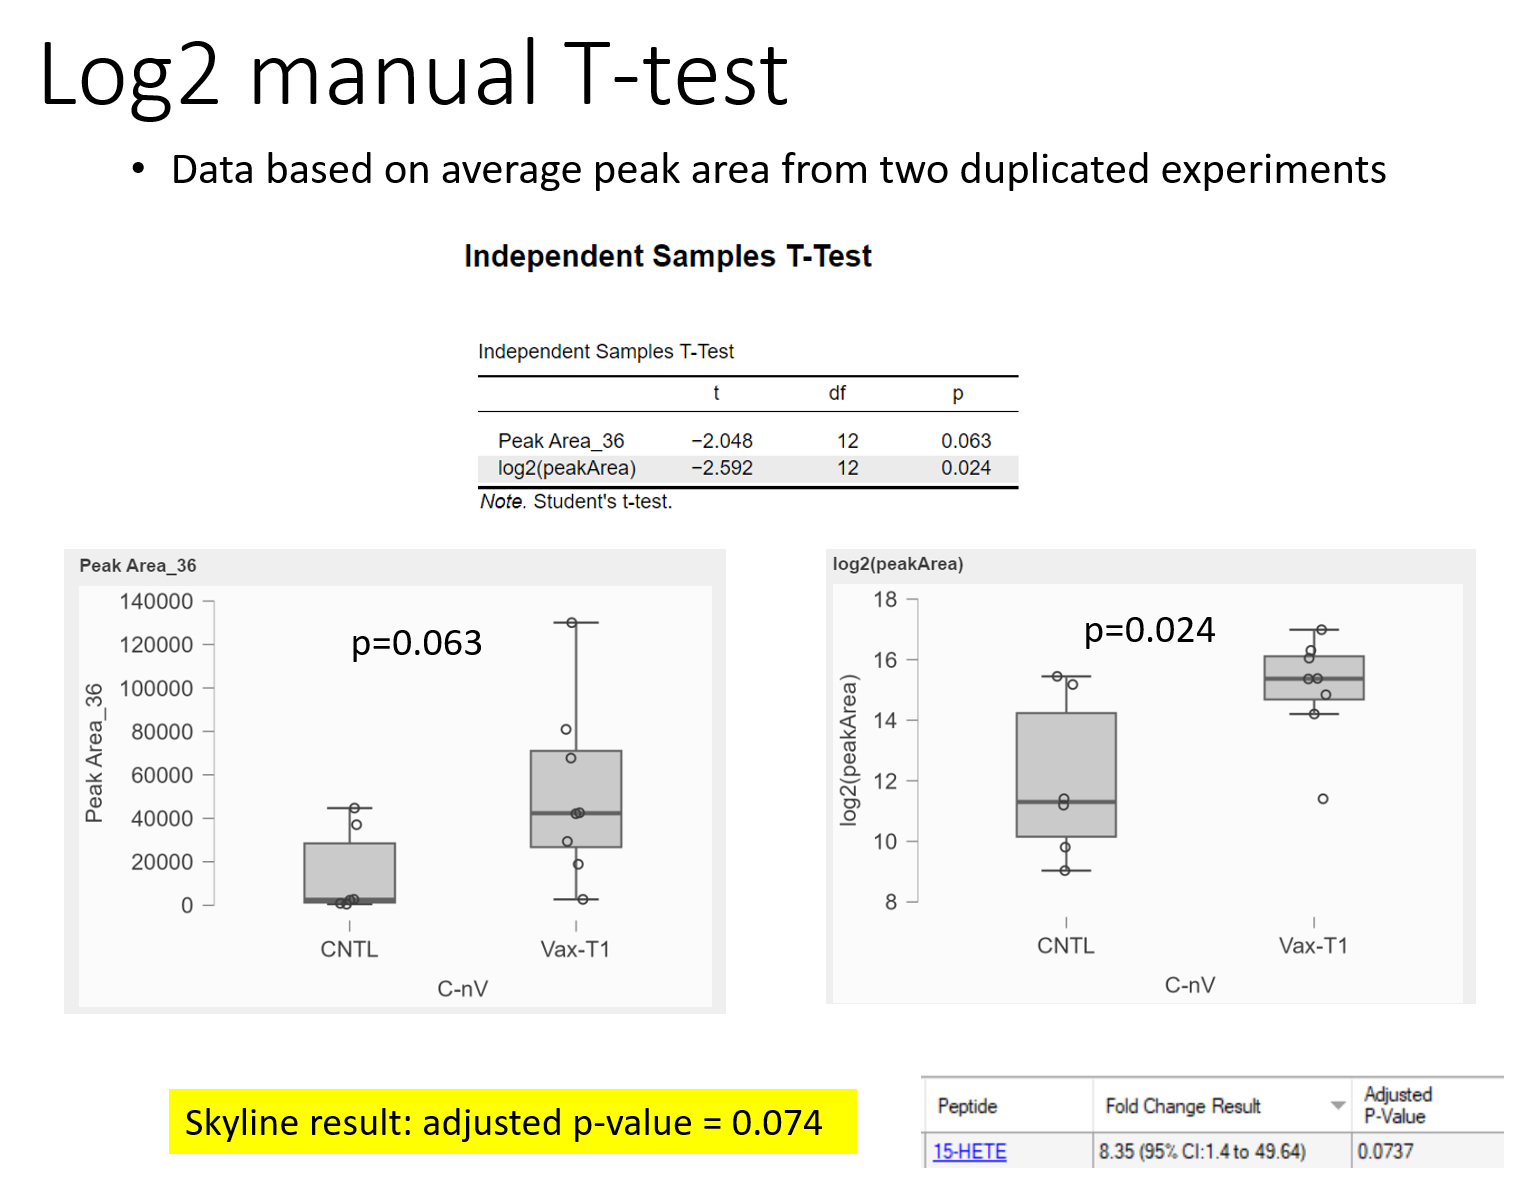
https://doi.org/10.1007/s00216-023-04991-2).I copy a few sentences here: "One common assumption in univariate hypothesis tests is the normality of abundances. In lipidomic data, a strong right skew
in the raw abundances is often observed due to the presence of a few lipids with exceptionally high concentrations, so it is standard practice to apply data transformations in an attempt to obtain normality. Specifically, raw lipid abundances are often log transformed, and/or normalized, using values such as the total ion current (TIC), median abundance value, or others." Attached screenshot picture (log2.png) shows an example of t-test using area peak intensity and log2 scale. The log2 transformation yields better p-value. Boxplots were also shown.

Thus, I would like to have an option in group comparison to have data in log2 scale instead of area of peak intensity. Otherwise, I will have to export the abundance data (area of peak intensity) and calculate adjusted p-value and fold change manually for each lipid.

Honghui
 
Nick Shulman responded:  2024-01-04 15:20
Note that the "Adjusted p-value" has been adjusted using the Benjamini-Hochberg procedure to compensate for false positives caused by multiple testing. In order to do that adjustment, you need to take into account the p-values of all of the other molecules in your Skyline document.

If you want to compare the results from Skyline with results that you are getting from other software, that other software might be using the unadjusted p-values.
The unadjusted p-values can be found in Skyline, but they are a little bit hidden so that you don't accidentally use them instead of the adjusted p-values.
If you customize the Report that you are looking at in the Group Comparison grid, you can find the raw p-value at "Fold Change Result > Linear Fit > P-Value".

Skyline does take the logarithm of the abundances before plotting them on a graph and doing the linear regression.
The reason that Skyline does this is so that the slope of the linear regression becomes the logarithm of the fold change.
If Skyline had not taken the logarithm of everything, then the slope of the linear regression would not have anything to do with the fold change.

I do not know enough about t-tests to know whether this linear regression between the logarithms of the abundances is the same as what you are suggesting with the log2 scale.
-- Nick