Thank you for sending that Skyline document.
If you go to:
View > Retention Times > Score to Run
it is possible to see the iRT scores of your peptides.
When the "Retention Times - Score To Run Regression" window first comes up, by default, Skyline looks through all of the retention time predictors that it knows about and chooses the predictor which best fits the data. This is the reason that you are seeing "SSRCalc 3.0 (100A)" on the X-axis.
However, you can tell Skyline to use the iRT database that you have by choosing "Calculator > FAIMS_TPD_lib-assay" from the right-click menu.
When you are using the "FAIMS_TPD_lib-assay" predictor in the "Retention Times - Score To Run Regression", Skyline will display on the graph some statistics about how good of a fit the linear regression value was. Skyline tells you that the "r" value (i.e. the Pearson correlation coefficient) of that linear regression was 0.9623.
Whenever the r value of the linear regression is less than 0.99, Skyline will try to exclude a few points in order to get an r value which is greater than 0.99.
If Skyline is unable to find a set of points which result in a Pearson correlation coefficient which is greater than 0.99, then Skyline will not display the predicted retention time on the chromatogram graph.
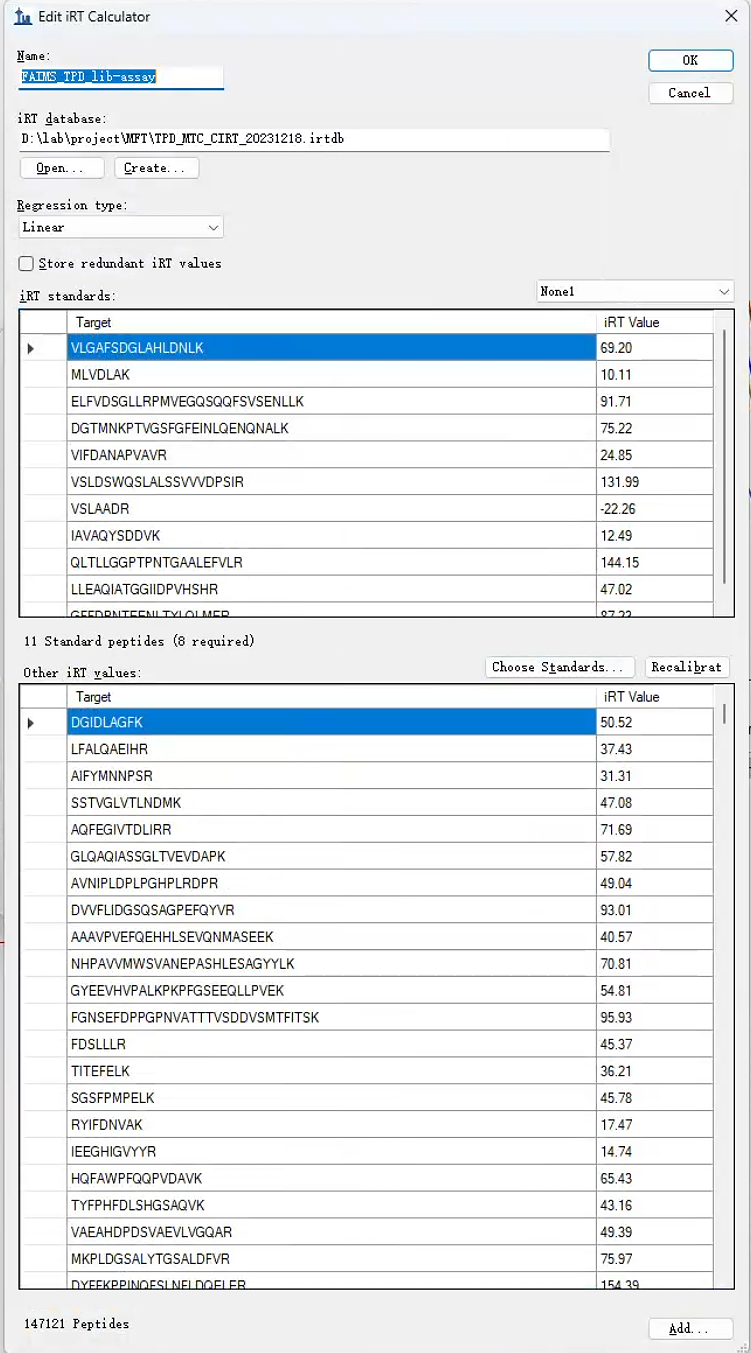
You can tell Skyline to change the iRT values for these peptides by going to:
Settings > Peptide Settings > Prediction
and then push the calculator button and "Edit Current"
and then push the "Recalibrate" button and then "Use results"
After you do that, and press OK on all of the settings dialogs, you will be able to see the predicted retention time on the chromatogram graph.
Also, the r value of the linear regression in the "Retention Times - Score To Run Regression" window will now be equal to 1.
-- Nick |
 1703565973741.png
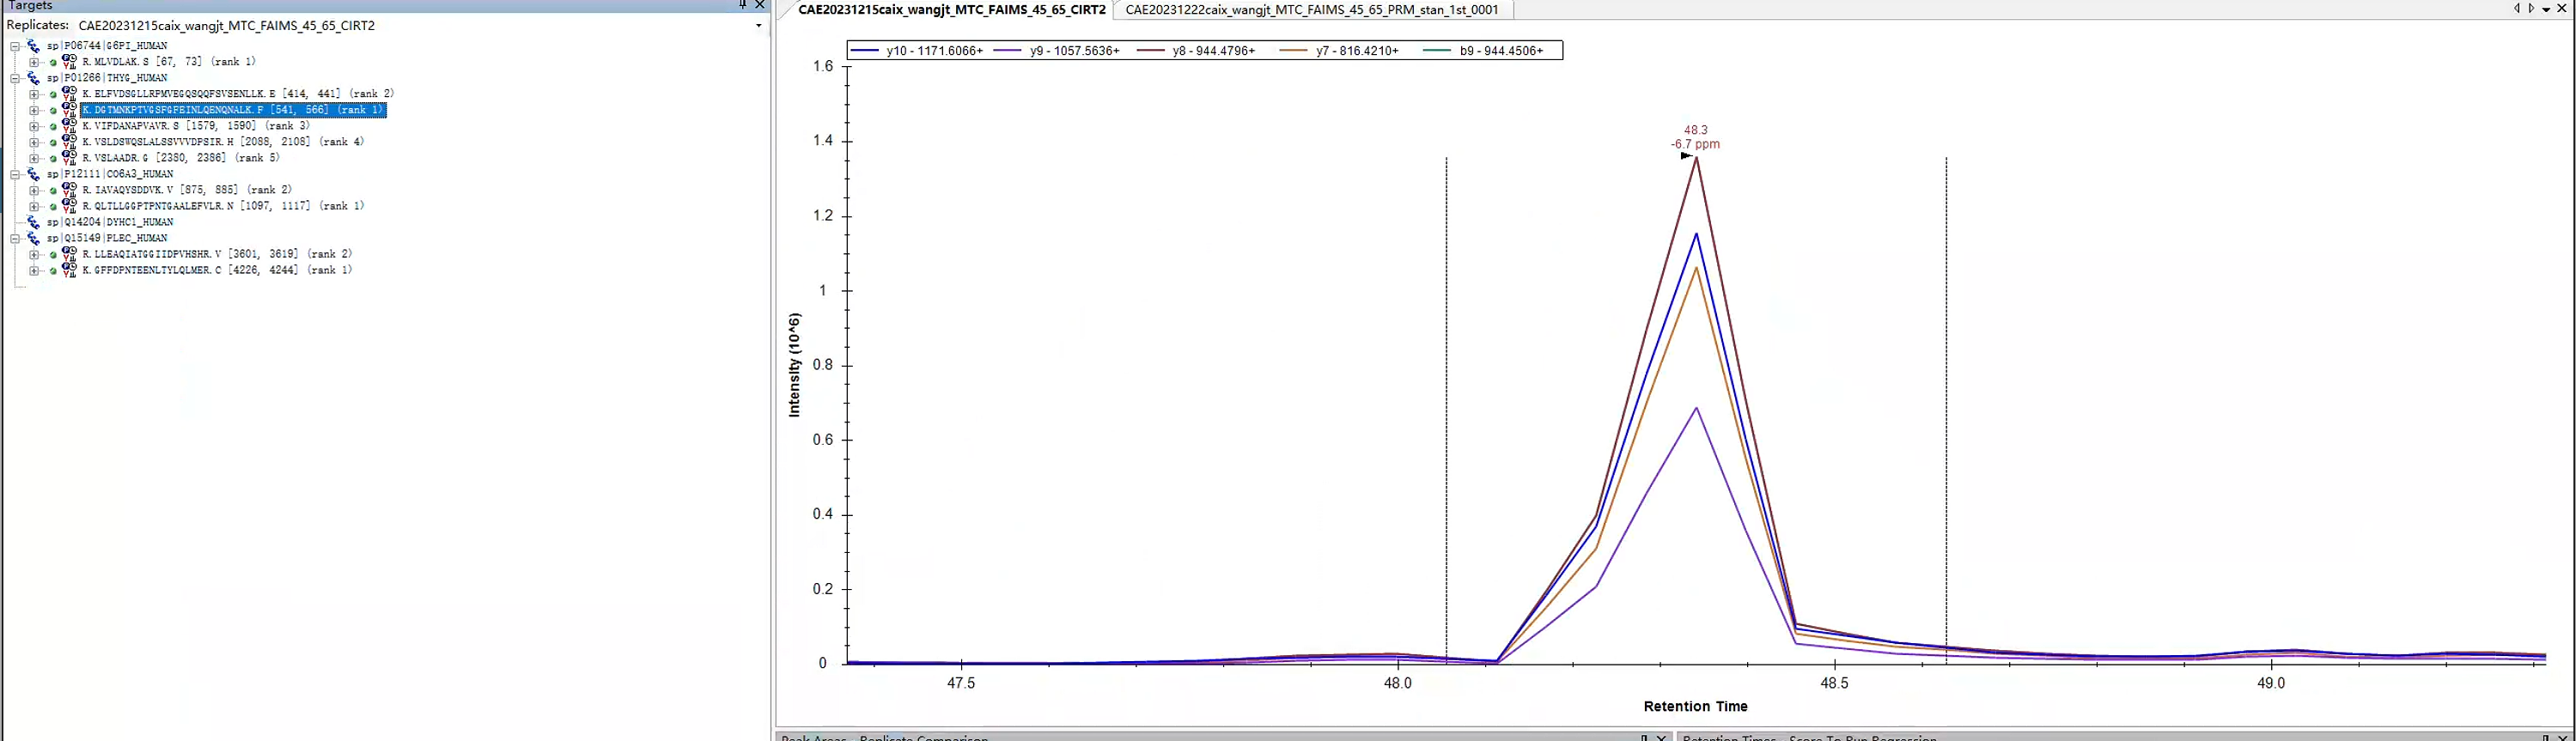 1703565931622.png
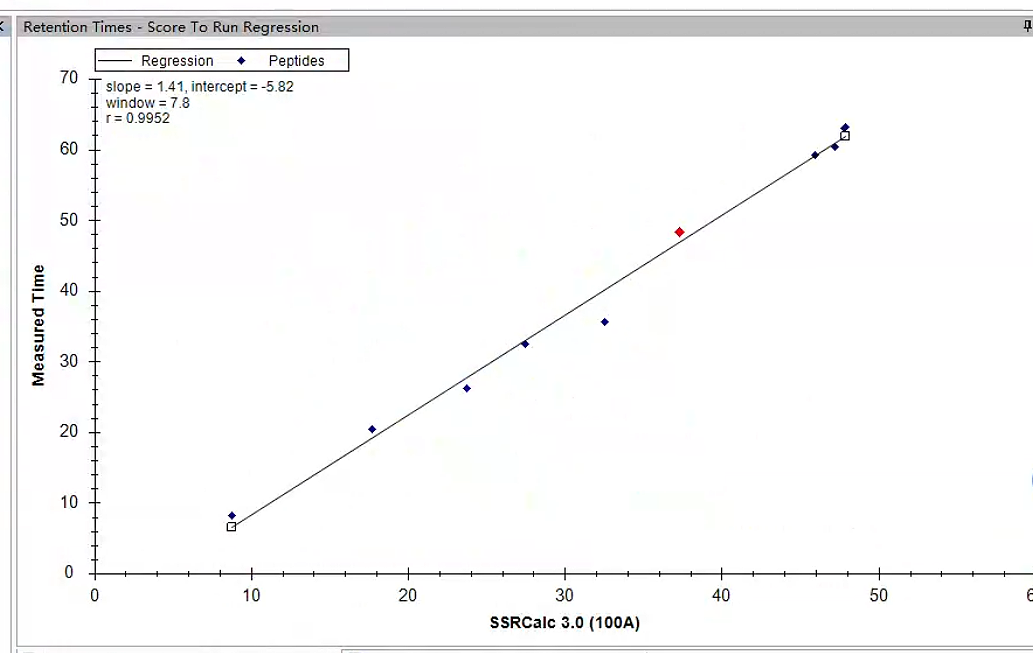 1703565907792.png