Which normalization method is your Group Comparison using?
The Peak Area Replicate Comparison graph in your screenshot is showing you unnormalized values. In the Skyline document that you sent me last week your Group Comparison was using the normalization method "Equalize Medians".
You can right click on the Peak Areas graph and choose to display a different normalization method.
In your Skyline document, when I choose "Normalized To > Equalize Medians" on the Peak Area graph, all of the bar graphs except one seem to disappear.
The reason that this happens is that you have one replicate "S17" where more than half of the transition peak areas are zero.
For this reason, when Skyline normalizes observed values to the median peak area, the normalized values for the replicate S17 end up being much much larger numbers than for all of the other replicates, and so you only end up being able to see one bar in the Peak Area Replicate Comparison bar graph.
-- Nick |
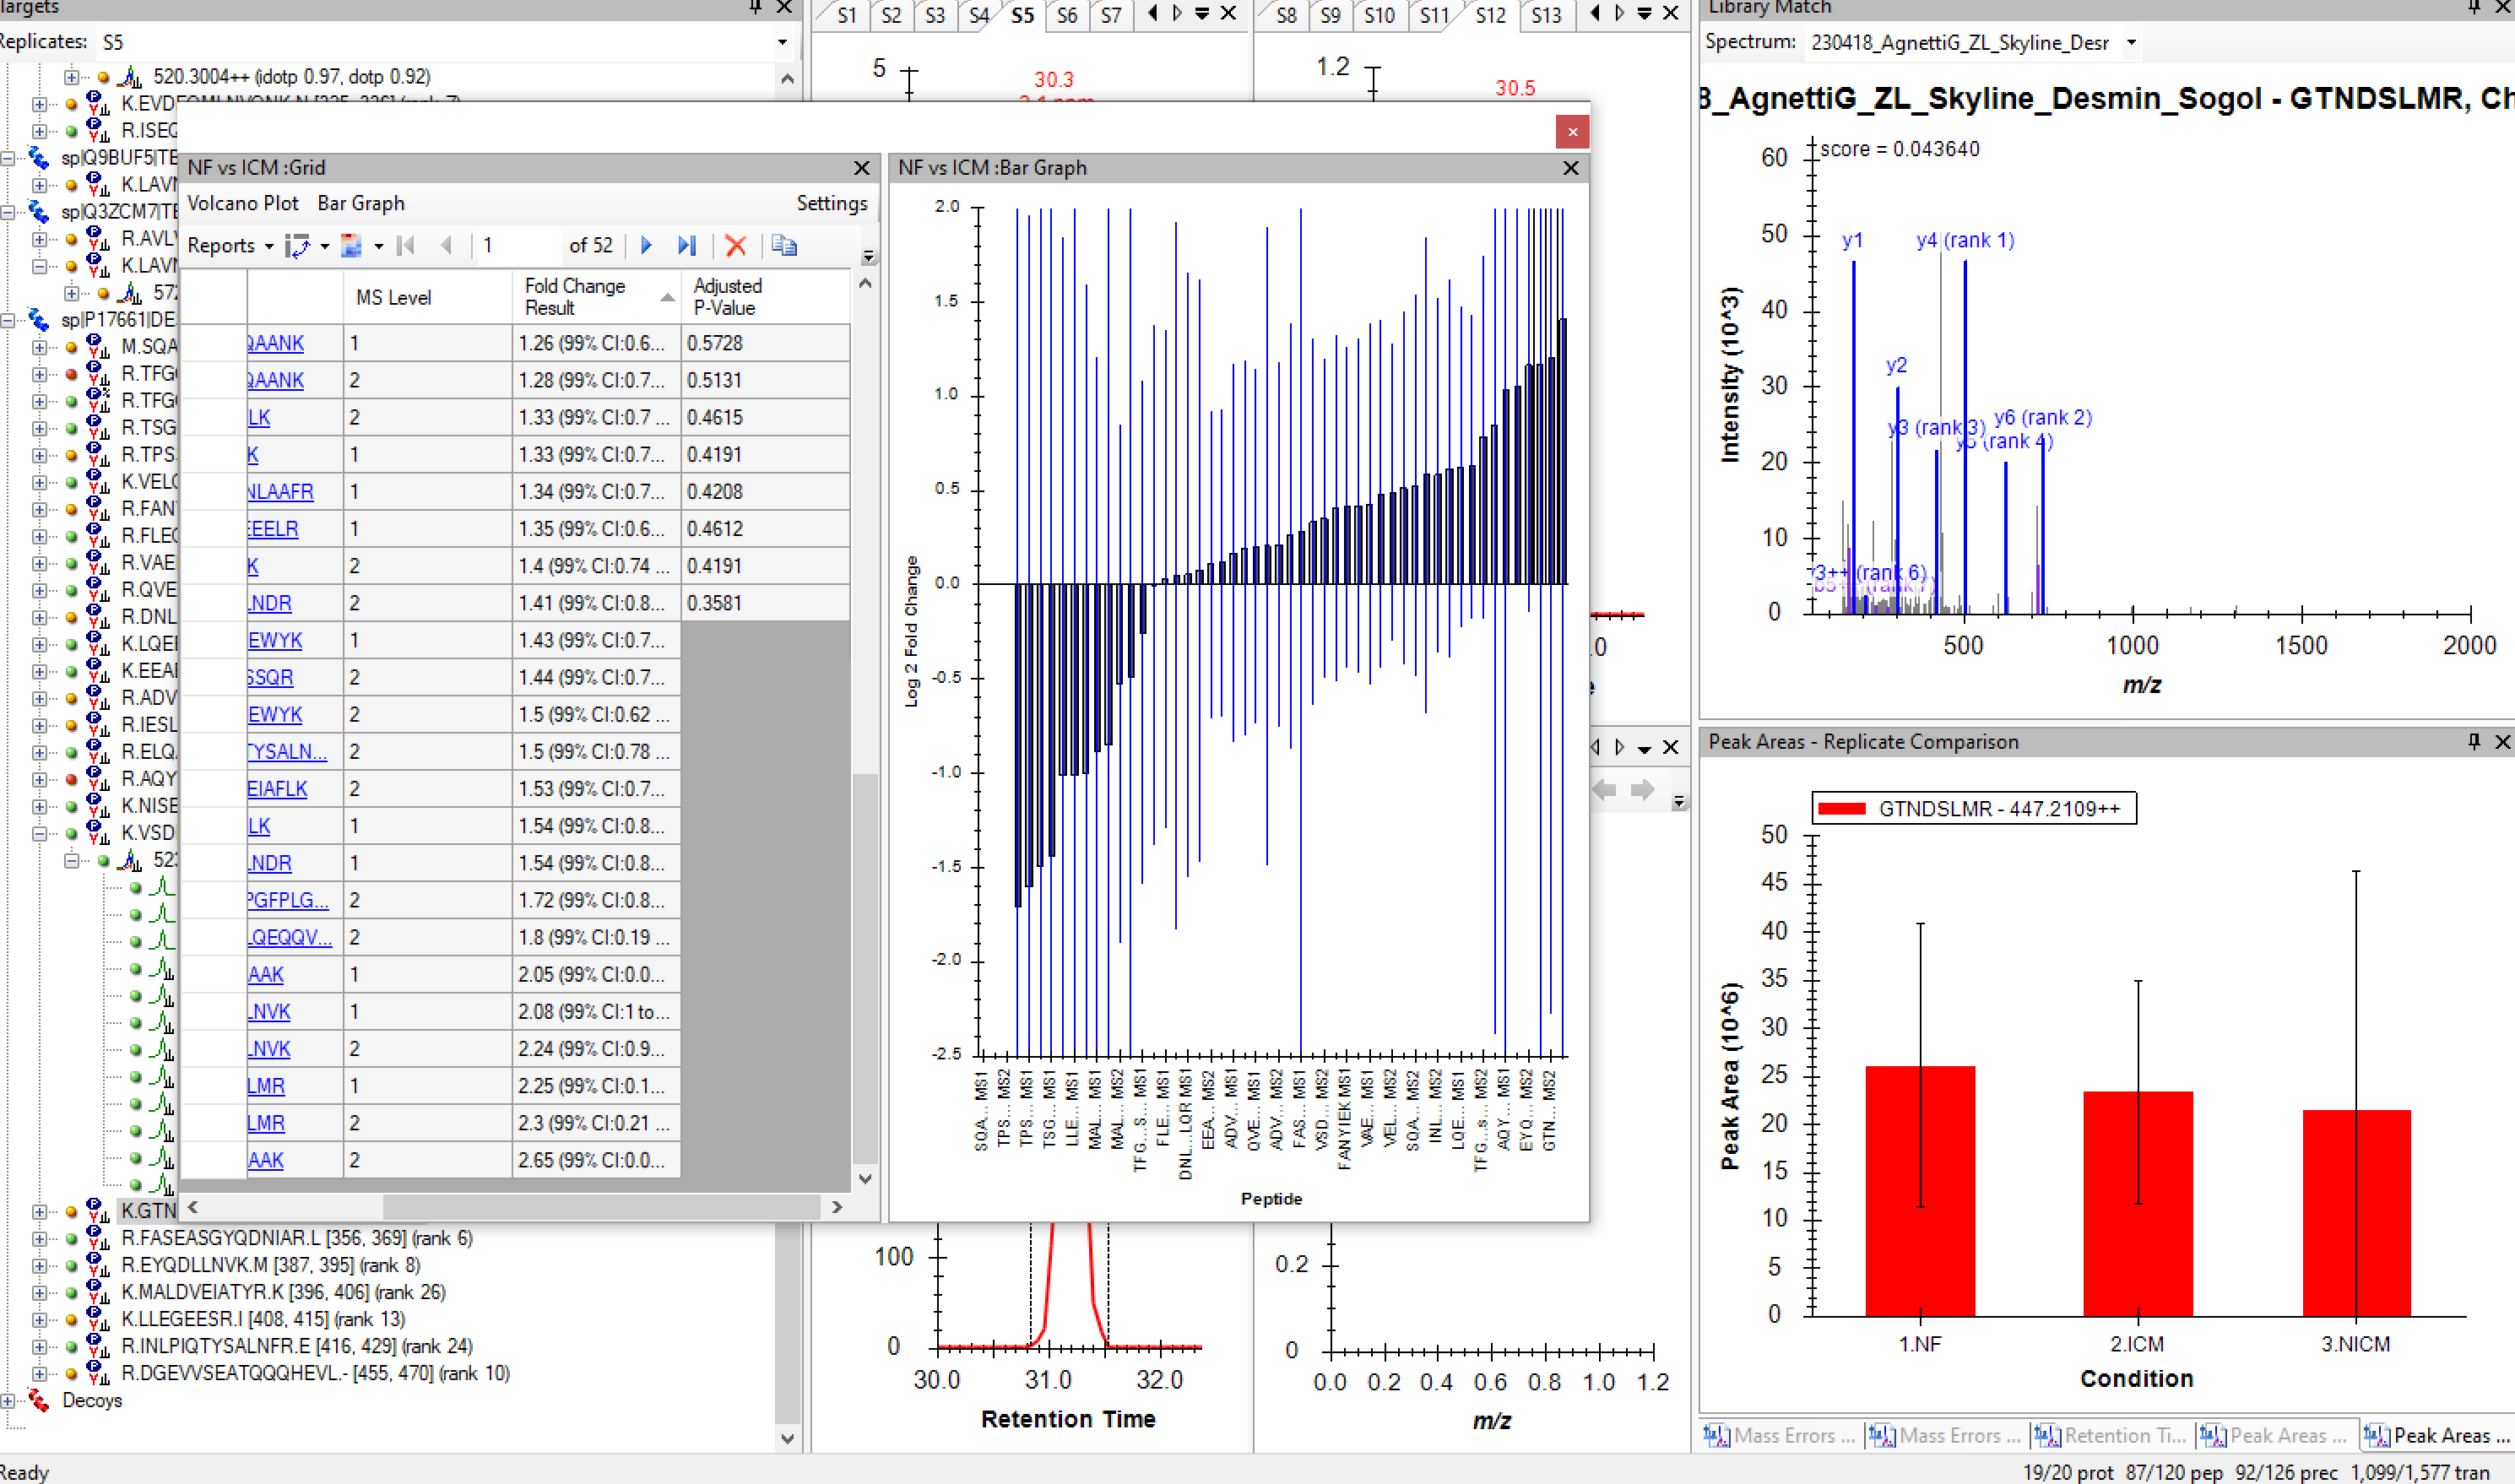 scr.PNG