| Trouble viewing MS2 data from Bruker maXis for systyem suitability applications | paul mathews | 2023-03-08 13:57 | |||||||||||||||||||||||||||||
Hi Skyline team, I am in the process of building SS protocols across our LC systems using Skyline and Panorama AutoQC function. In this request I am investigating DDA MS2 data acquired on a bruker maXis 2 for a single compound, resperine, ran on with a c18, 4 min uplc method with bruker autoMSMS detection. I have followed the tutorials for small molecule quantitation and generated two skyline documents, one from scratch and one using the "Auto MSMS_MS and MSMS filtering" template. In the scratch generated document, I am unable to see MS2 information. In the modified template, I can see my MS2 transition of interest, but the chromatogram appears wonky with a straight line. It seems selecting "DIA" or "none" I see in another post this may just be a bug. Is there something I can do within my transition settings or transition list to get the transition ion (which appears in the MS2 scan of m/z 609) to appear and be useful for SS? We may ultimately just quantify on the MS1 TIC, but for further use (including using GCMS data) I'd like to find a way to use a fragment ions in quantitation, without a MRM method. Attached are screenshots of the skyline documents. For the auto MSMS template file there are two shots, one with DIA and one with the targeted(obsolete) method (which strangely disappears once you modify the template) |
|||||||||||||||||||||||||||||||
| |||||||||||||||||||||||||||||||
 skyline automsms troubleshooting.PNG
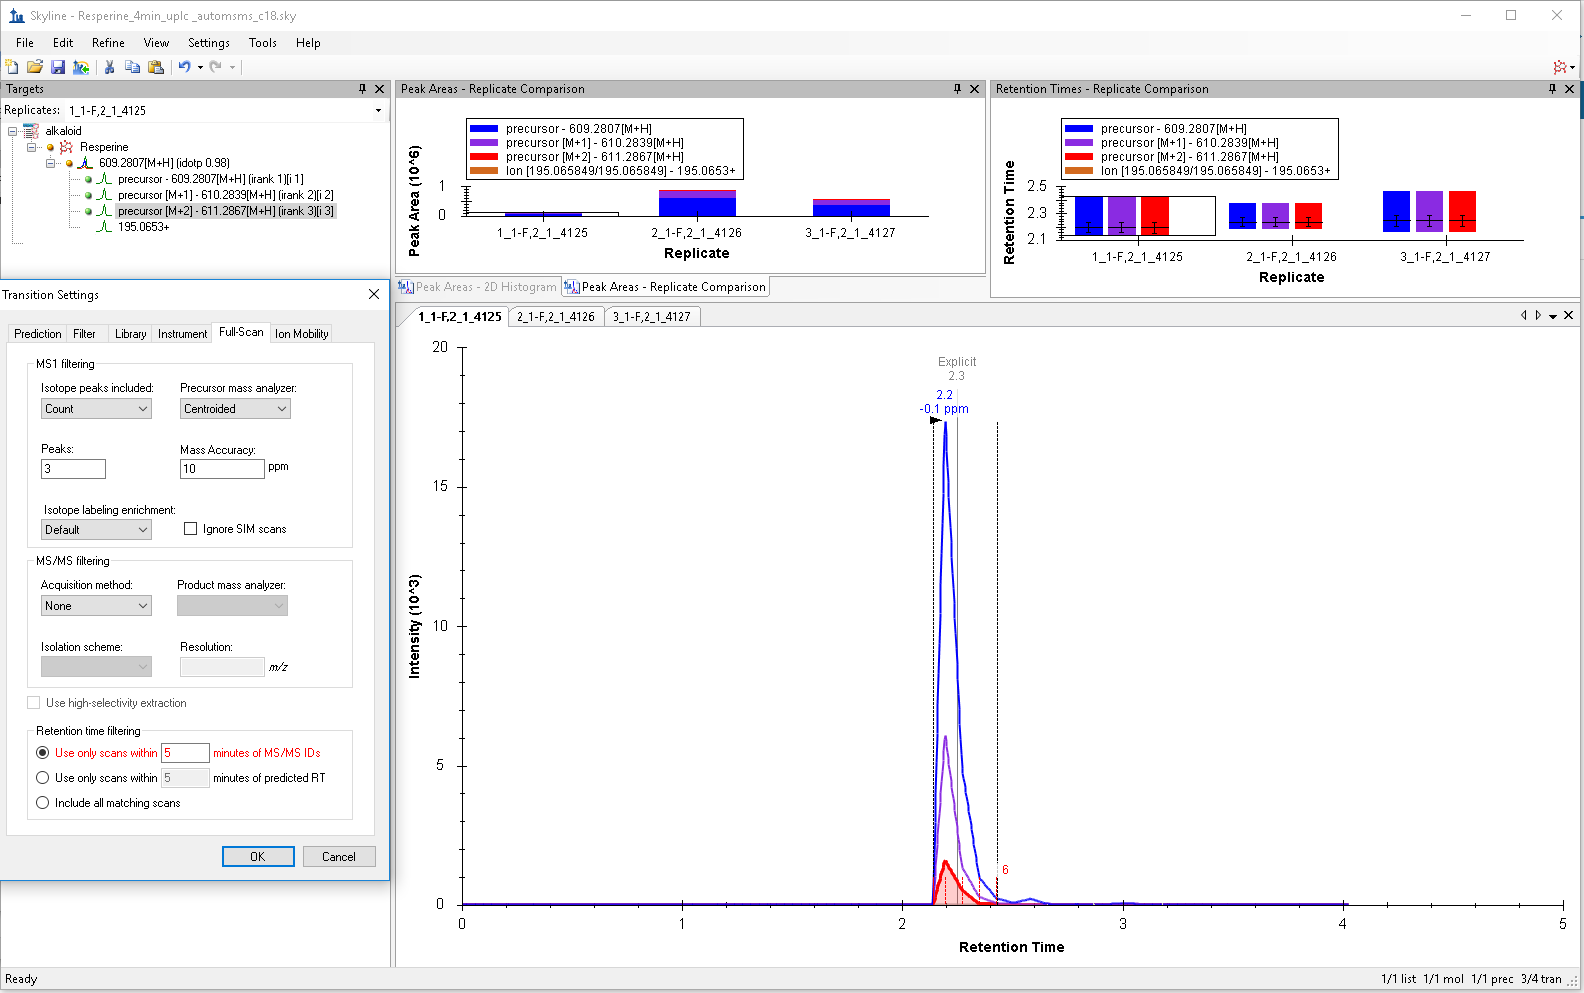 skyline resperine troubleshooting.PNG
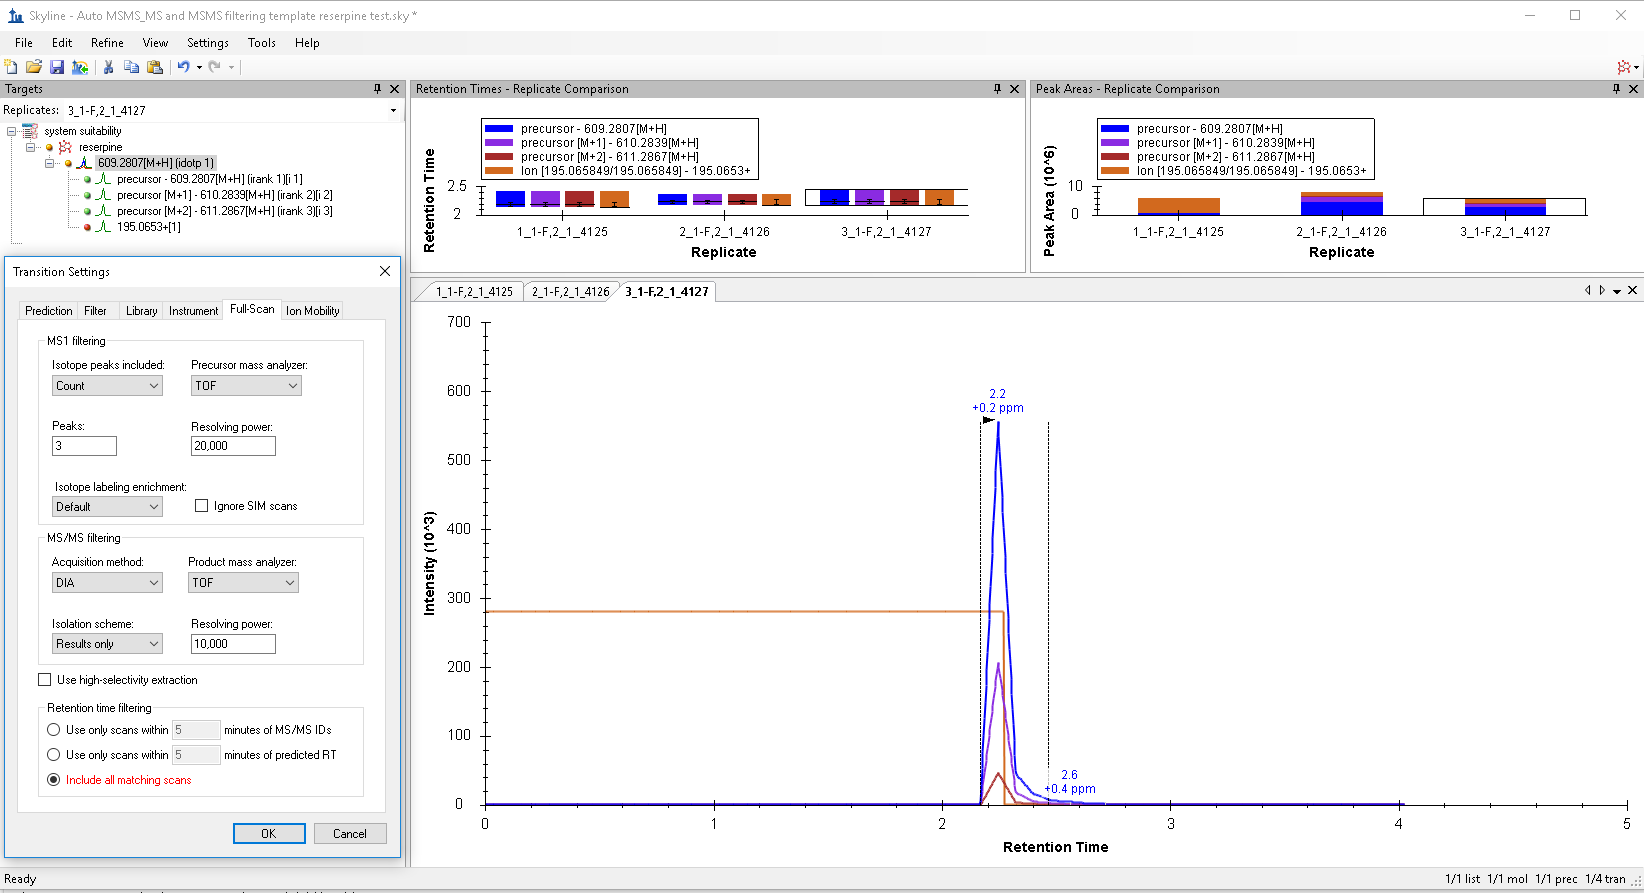 skyline automsms troubleshooting_DIA.PNG