Can you send us your .raw file ("20220923_E_1_ControlOyster_0ng.raw")?
If that file is less than 50MB you can attach it to this support request. You can upload larger files here:
https://skyline.ms/files.url
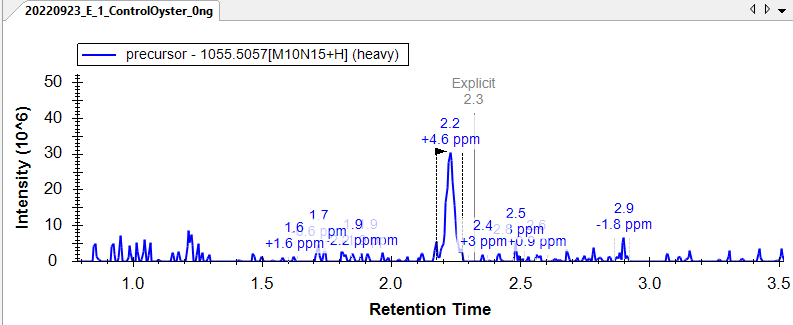
When Skyline is extracting chromatograms, Skyline looks at each spectrum and sums up the intensities that are observed in a m/z range around the target transition's m/z. If you are seeing a peak in the Skyline chromatogram that you are not seeing in the chromatogram extracted by your Thermo software, then it is probably because Skyline is summing intensities across a wider m/z window than your other software.
The width of the m/z channel that Skyline sums across is controlled by the "Resolving Power" or "Mass Accuracy" setting that you have at "Settings > Transition Settings > Full Scan".
For the chromatogram in your screenshot, that's going to be controlled by the Resolving Power that you have specified in the "MS1 filtering" section. Your Resolving Power is set to 60,000, which should result in summing across a narrow channel (also, the "Use high-selectivity extraction" that you have checked on that page also means that Skyline will use a window which is half as wide as it would otherwise.
If you want to see how wide of a channel Skyline is summing across, you can click on any point along the chromatogram graph.
When you click on the chromatogram graph, Skyline brings up the "Full Scan" graph which will have shaded rectangles on it which show what m/z windows Skyline was summing across.
-- Nick
 221007_Skyline_GhostPeak.PNG
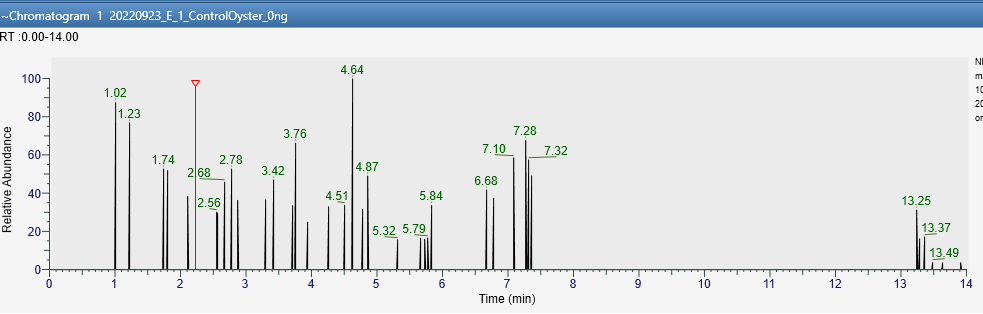 221007_GhostPeak_Thermo.PNG
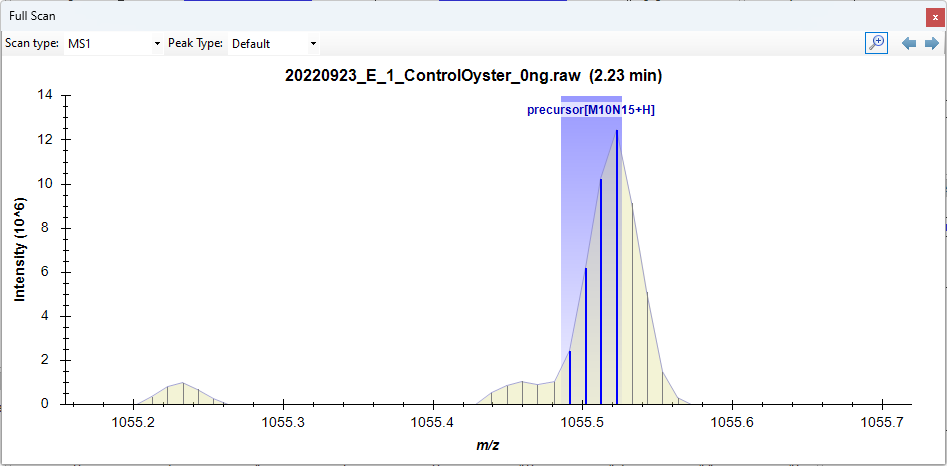 SpectrumWithOriginalSettings.png
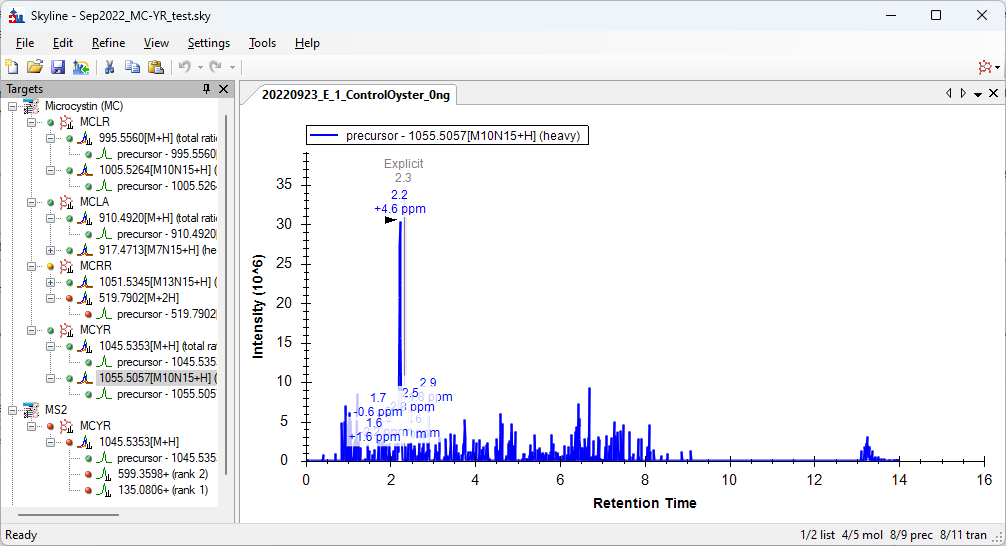 OriginalChromatogram.png
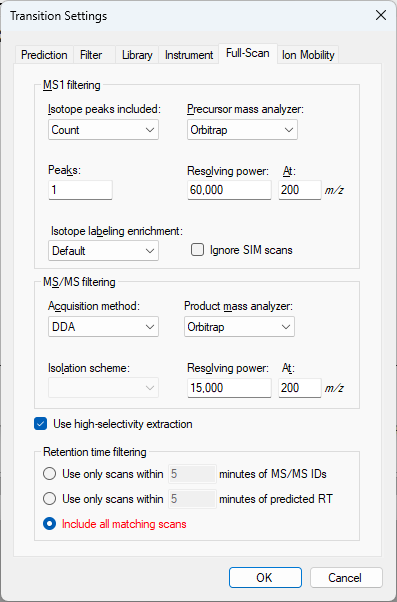 OriginalSettings.png
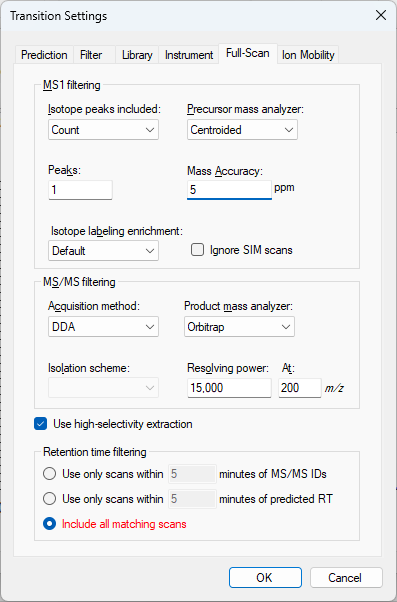 Centroided5ppmSettings.png
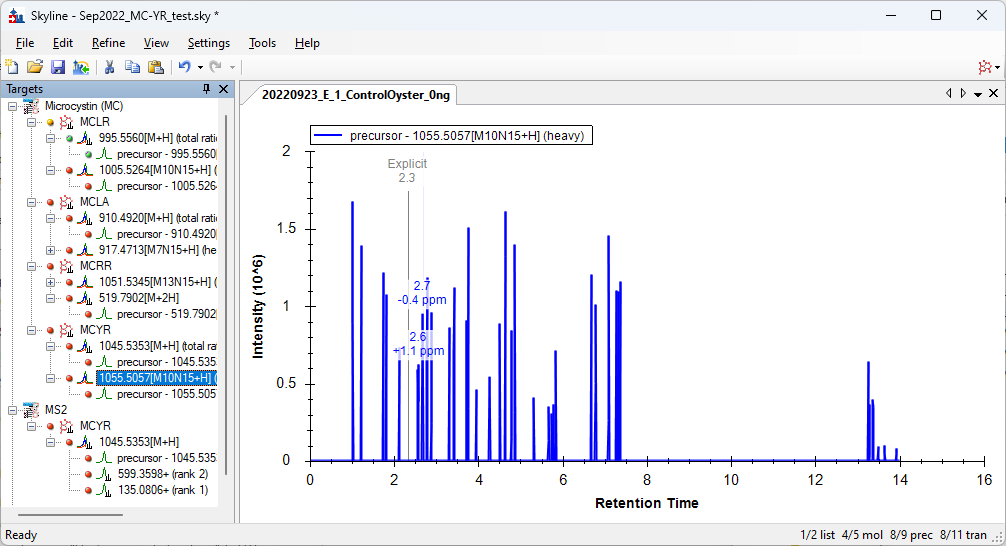 Centroided5ppmChromatogram.png
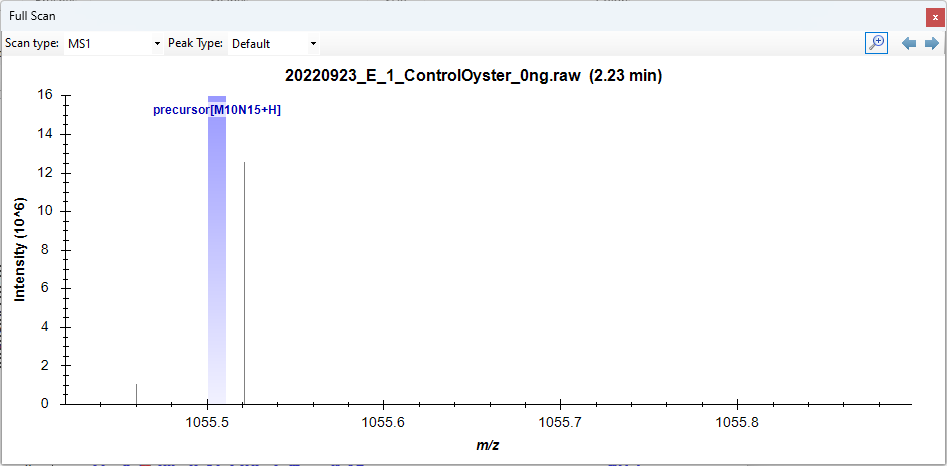 SpectrumWIthCentroided5ppm.png