| Nick Shulman responded: |
2022-05-03 08:54 |
Finn,
It looks like you might have tried to attach a file to this support request, but it did not work.
The maximum file size that you can attach to these support request is 50 megabytes.
You can upload larger files here:
https://skyline.ms/files.url
-- Nick |
| |
| jingyangzhang0222 responded: |
2022-05-03 08:57 |
|
| |
| Nick Shulman responded: |
2022-05-03 09:52 |
Thanks for uploading that Skyline document.
I see that I can download the supplemental data from the paper from here:
http://proteomecentral.proteomexchange.org/cgi/GetDataset?ID=PXD026600-1&test=no
It looks like I can download the .sky.zip files from the paper in this folder on the MassIVE server:
/MSV000087597/quant/RD139_Software_Files
I would have thought that it would be straightforward for me to look at "RD139_Skyline_Narray.sky.zip" and compare it to your Skyline document and see why your chromatograms do not look good. Unfortunately, for some reason, the .sky.zip on the MassIVE server only contains the Biognosys iRT peptides and decoy peptides. I have no idea why a document like this would exist which was missing all of the target peptides.
One thing I noticed about your Skyline document is that at:
Settings > Transition Settings > Full Scan
you have Retention time filtering set to "Only use scans within 5 minutes of MS/MS IDs".
That setting tells Skyline to use the retention times of the spectra in your spectral library to decide what time range to extract chromatograms over. That is only a good idea if the chromatography in the DDA runs that the spectral library was built from is the same as the chromatography in the DIA files that you are extracting chromatograms from.
In this case, since it looks like the data does contain iRT peptides, you should set up an iRT predictor and use the option about using scans within 10 minutes of the predicted retention time.
It is hard for me to say what might be going wrong in your Skyline document because I am not sure how things are supposed to look. Do you have any information about what any particular peptide's chromatogram is supposed to look like?
-- Nick |
| |
| jingyangzhang0222 responded: |
2022-05-04 08:21 |
Hi Nick,
I was expecting that the shapes of precursors' peaks and the shapes of fragment ions' peaks are similar, as shown in the "Good_shape.jpg", you can check "Bad_shape.jpg" to see the bad peak shapes.
Is there any way to filter out the result with good peak shapes, or improve the overall data validity?
Best,
Finn |
|
| |
| Nick Shulman responded: |
2022-05-04 10:38 |
Which peptides are you looking at in those screenshots? The precursor m/z's in the screenshots do not match any of the peptides in the .sky.zip that you uploaded. |
| |
| jingyangzhang0222 responded: |
2022-05-05 11:11 |
Hi Nick,
I am attaching some more screenshots from my project to show some "bad shapes", along with their peptide information. |
|
| |
| Nick Shulman responded: |
2022-05-05 12:47 |
I think the biggest problem is that the retention times of the IDs in your spectral library are very different from where the peptide can actually be found in the DIA runs that you are extracting chromatograms from.
So, that peptide "TITLEVEPSDTIENVK" could have been found at retention time 55.2 minutes, but, because of the Transition Full Scan settings, the chromatogram that Skyline extracted only goes from 60 minutes to 70 minutes.
You should go to:
Settings > Transition Settings > Full Scan
and change "Retention time filtering" to "Include all matching scans".
Then, you should tell Skyline to extract the chromatograms again by going to:
Edit > Manage Results
selecting all the replicates and pushing the "Reimport" button.
The Skyline documents in the supplemental information for the paper use Biognosys iRT peptides. For this reason, it would be better to use an iRT predictor instead of doing the "Include All Matching Scans".
I took one of the Skyline documents from the paper, and then I went to "View > Spectral Library" and did "Add All" and then extracted chromatograms from "RD139_Narrow_UPS1_50fmol_inj1.raw" and I have put the document here:
https://proteome.gs.washington.edu/~nicksh/jingyangzhang0222/Nick.sky.zip
If you would like to learn more about iRT predictors, you can look at the iRT tutorial:
https://skyline.ms/wiki/home/software/Skyline/page.view?name=tutorial_irt
-- Nick |
| |
| jingyangzhang0222 responded: |
2022-05-06 20:02 |
Hi Nick,
Thanks for your answer, it looks a lot better now! Still, I have questions about how Skyline filters out the peptide with good "peak shapes".
I notice there are dots with different colors(red, yellow, and green) on the left side of the peptides, precursors, and fragment ions. I suppose they are the result scores calculated by some rules(see the attached Dots.jpg), the elements with red dots have the relatively poorest "peak shapes", and the elements with green dots are the best.
Is there any way to export these "quantified scores" for each peptide, not just qualitative data(dots)? I tried but failed to find such data. Besides, can I change some settings to show the peptides with green dots only?
Please refer to the attached pictures to check the examples. |
|
| |
| Nick Shulman responded: |
2022-05-06 21:01 |
There is a bit of an explanation about the color of those dots here:
https://skyline.ms/announcements/home/support/thread.view?rowId=37839
However, with a DIA dataset like this one (especially since your document already contains decoy peptides), the way to figure out which are the good peaks is by training an mProphet peak picking model and then looking at the "Detection Q Value" scores that get assigned to the newly chosen peaks.
You can learn about training an mProphet model in the advanced peak picking tutorial:
https://skyline.ms/wiki/home/software/Skyline/page.view?name=tutorial_peak_picking
The first step of training an mProphet model after you have extracted chromatograms is to go to:
Refine > Reintegrate
and choose "Add New" from the dropdown.
-- Nick |
| |
| jingyangzhang0222 responded: |
2022-05-11 01:20 |
Hi Nick,
I have tried to train an mProphet model, but there is no "Add q value annotation" check box in the interface, which is different from the tutorial. Is the software version difference causing this? I am attaching a screenshot to show my problem. |
|
| |
| jingyangzhang0222 responded: |
2022-05-11 01:21 |
And BTW, there is no "annotation_Qvalue" option in the available report columns. |
| |
| Nick Shulman responded: |
2022-05-11 06:26 |
The tutorial is a few years out of date.
There are always two columns available in the Document Grid: "Detection Q Value" and "Detection Z Score", and so we've removed the checkbox you're referring to.
There's a binoculars button at the top of the Edit Report dialog which you can use to find any column by name.
-- Nick |
| |
 Good_shape.jpg
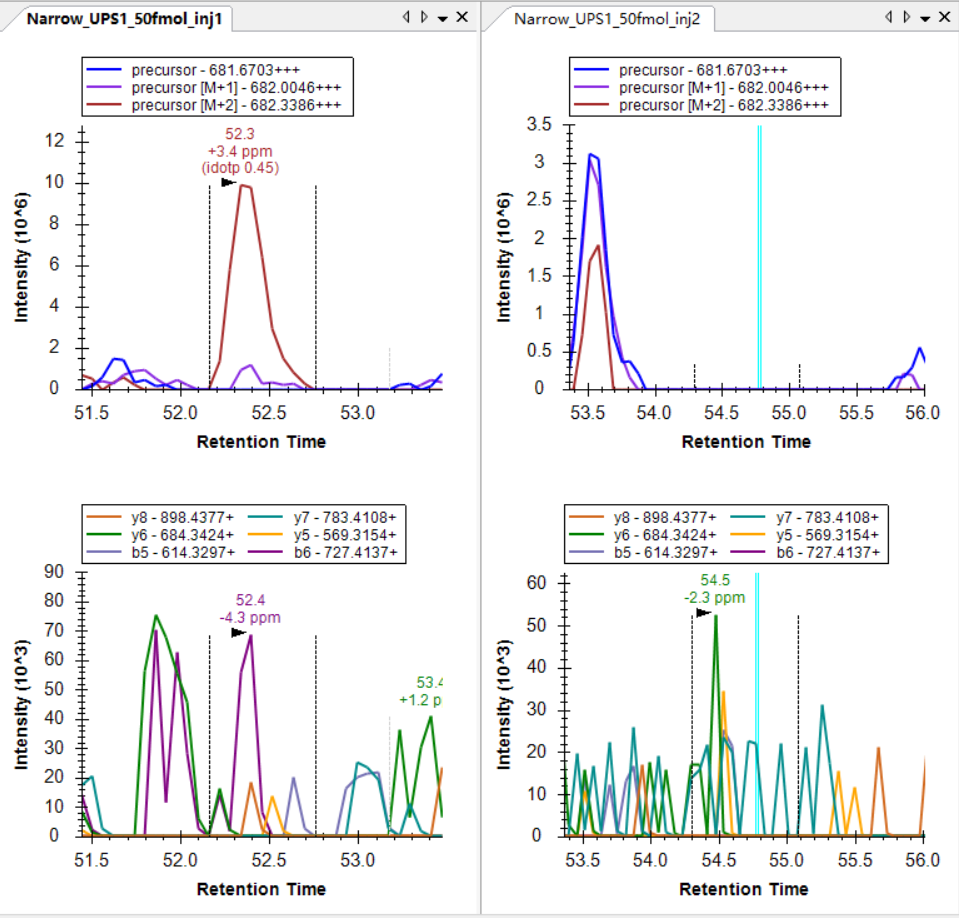 Bad_shape.jpg
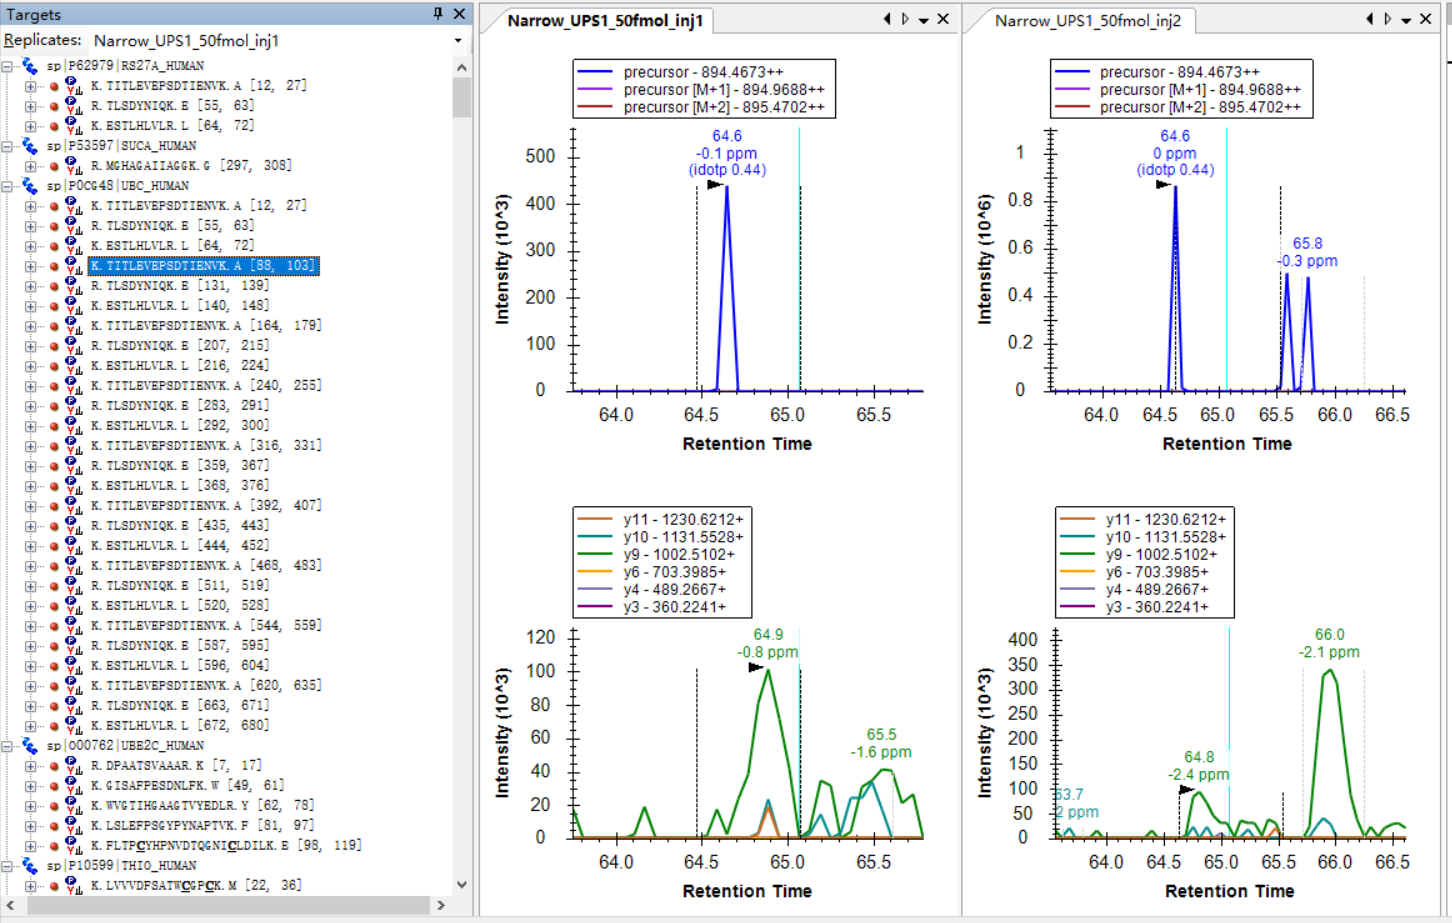 example_1.jpg
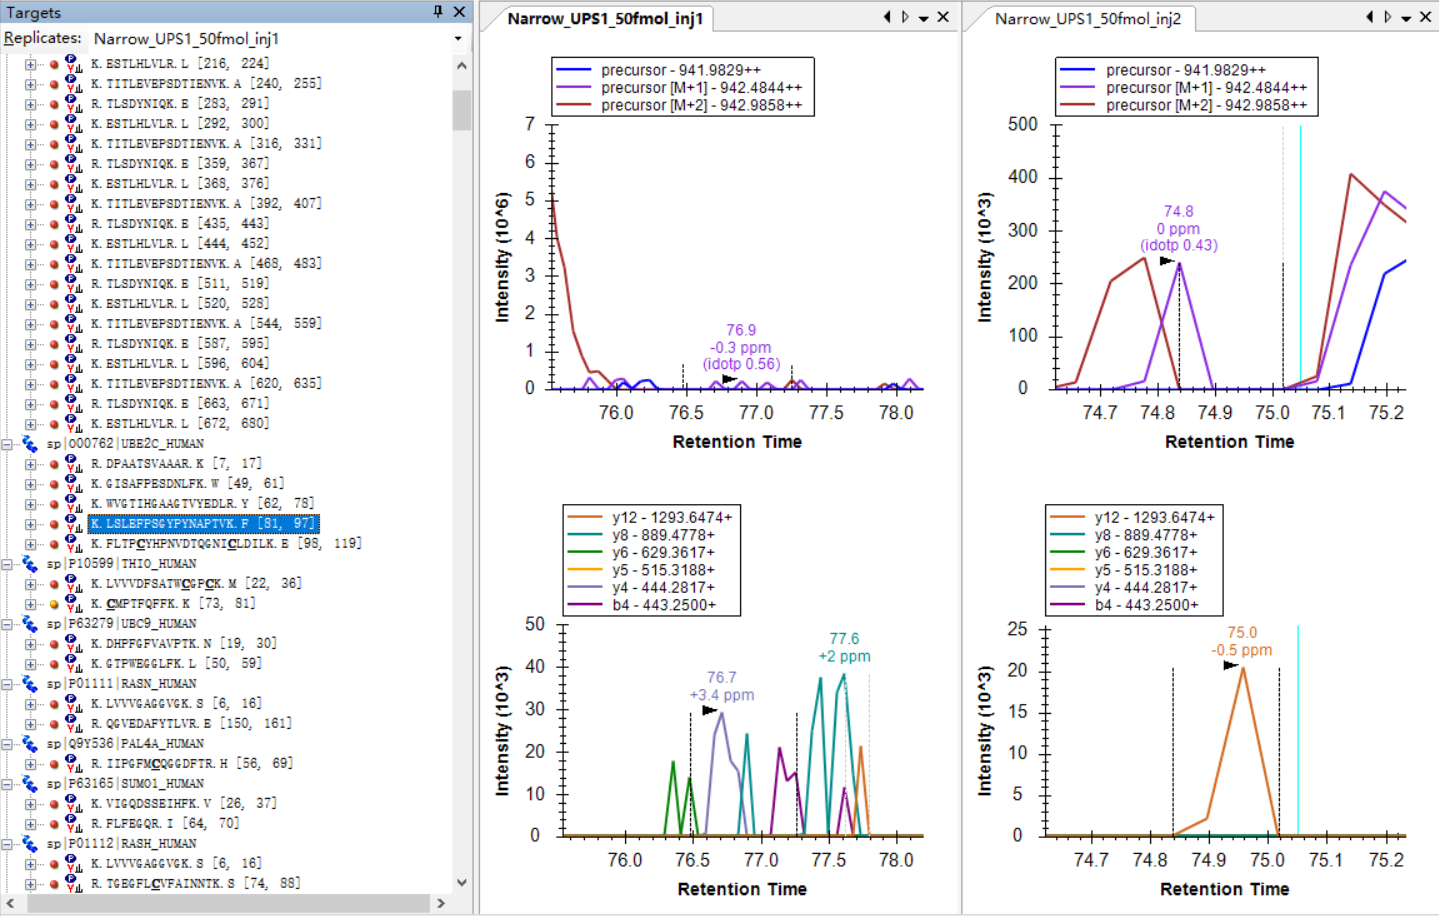 example_2.jpg
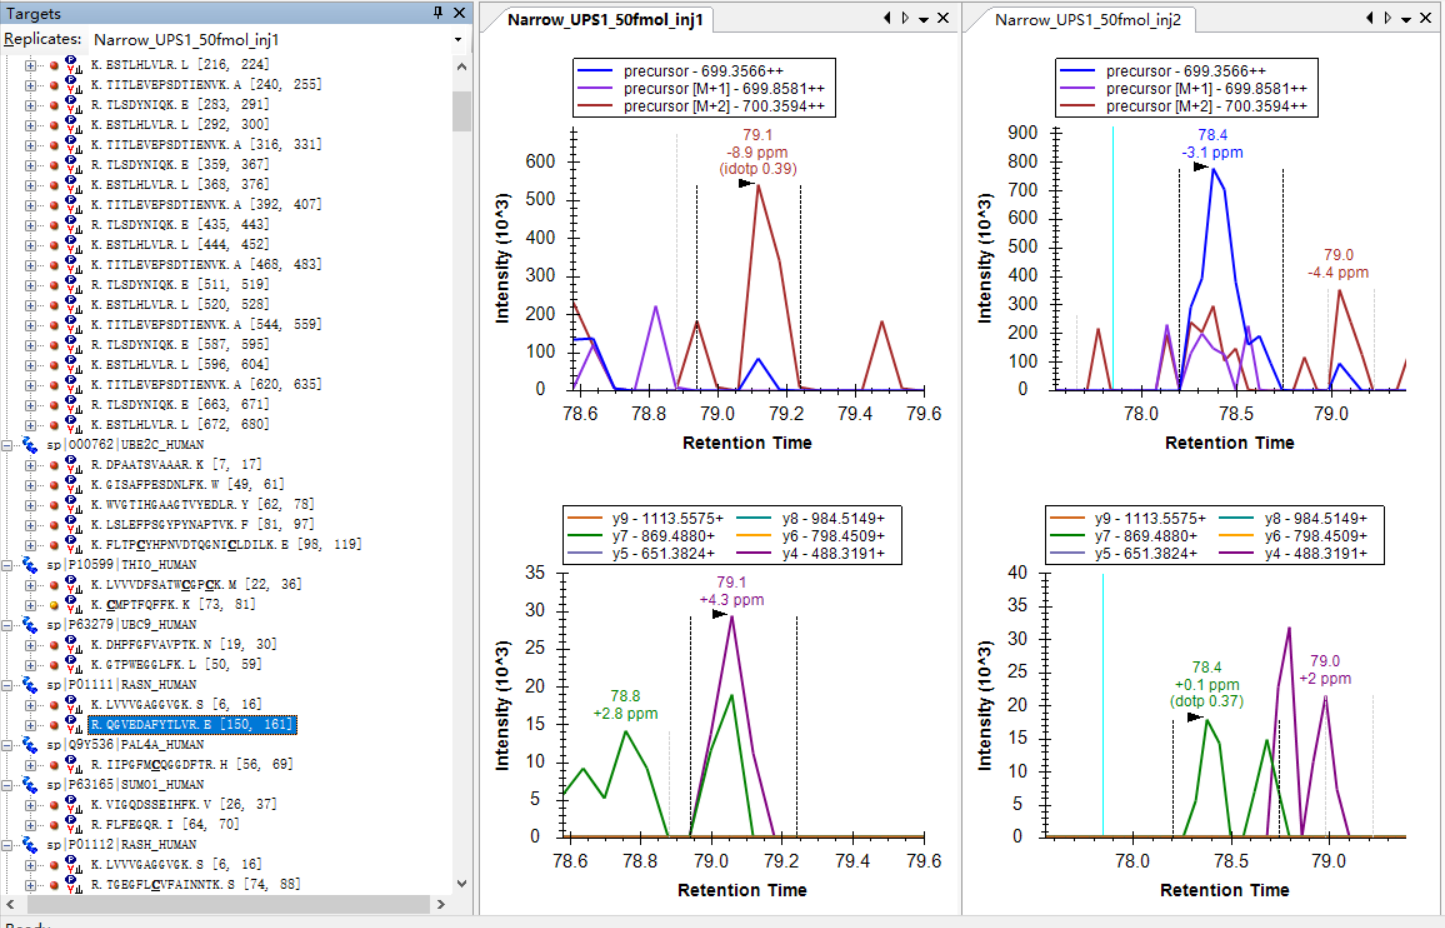 example_3.jpg
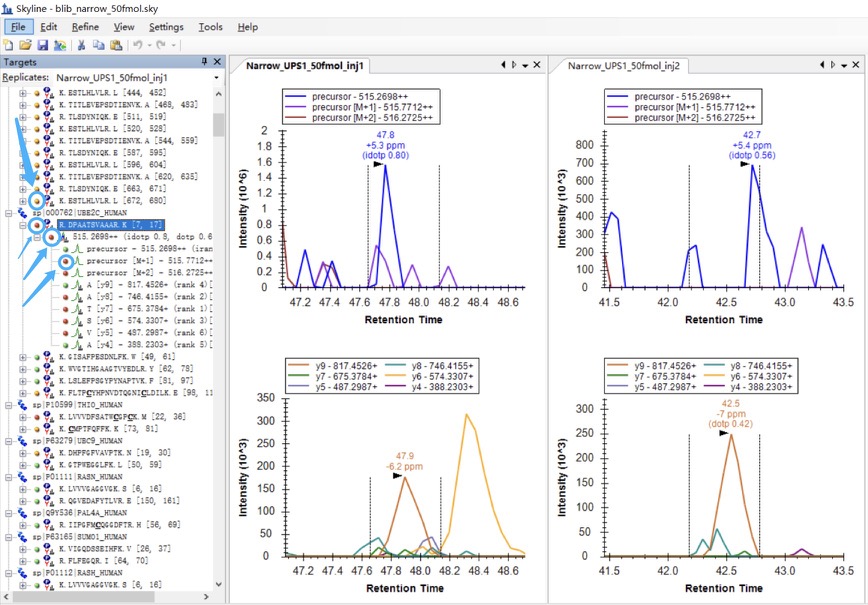 Dots.jpg
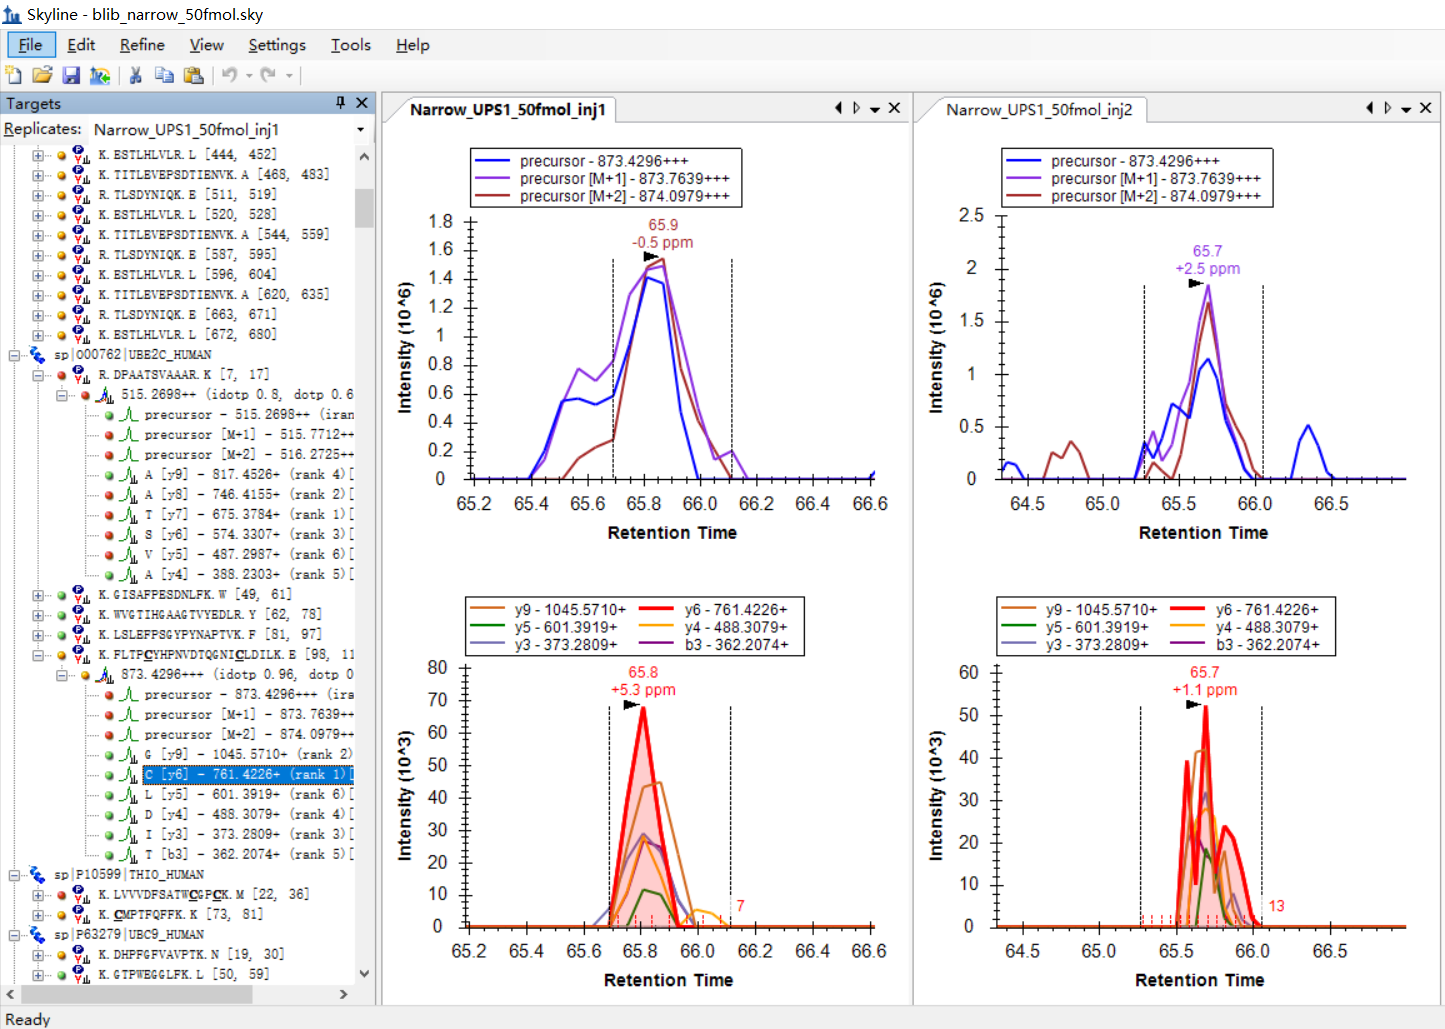 Green_Dot_Ion.png
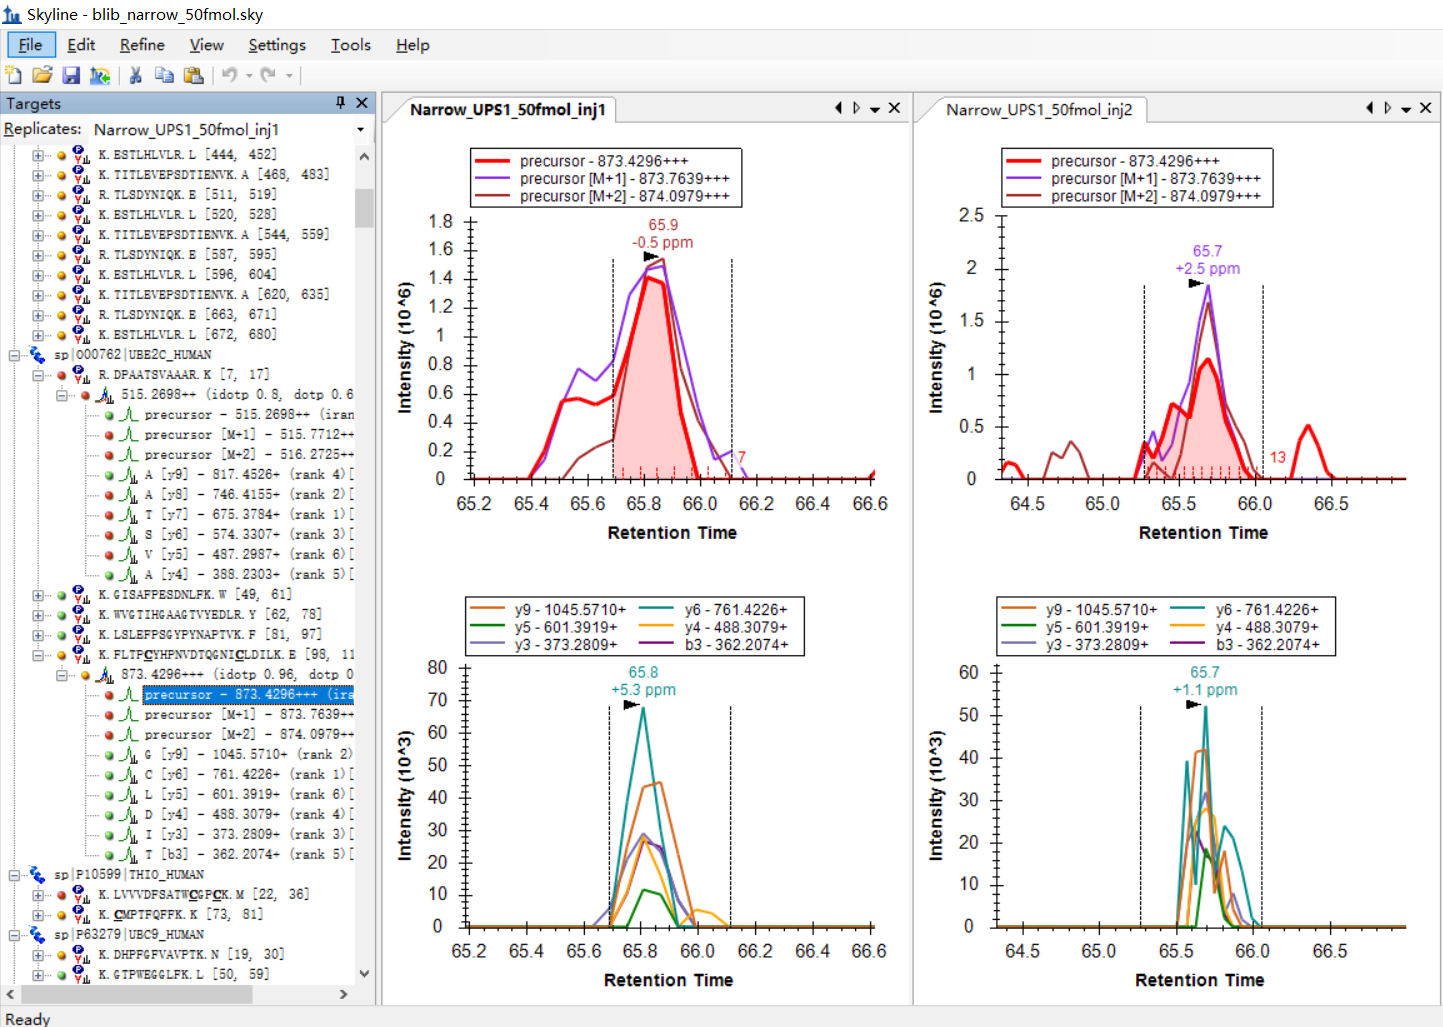 Red_Dot_Precursor.png
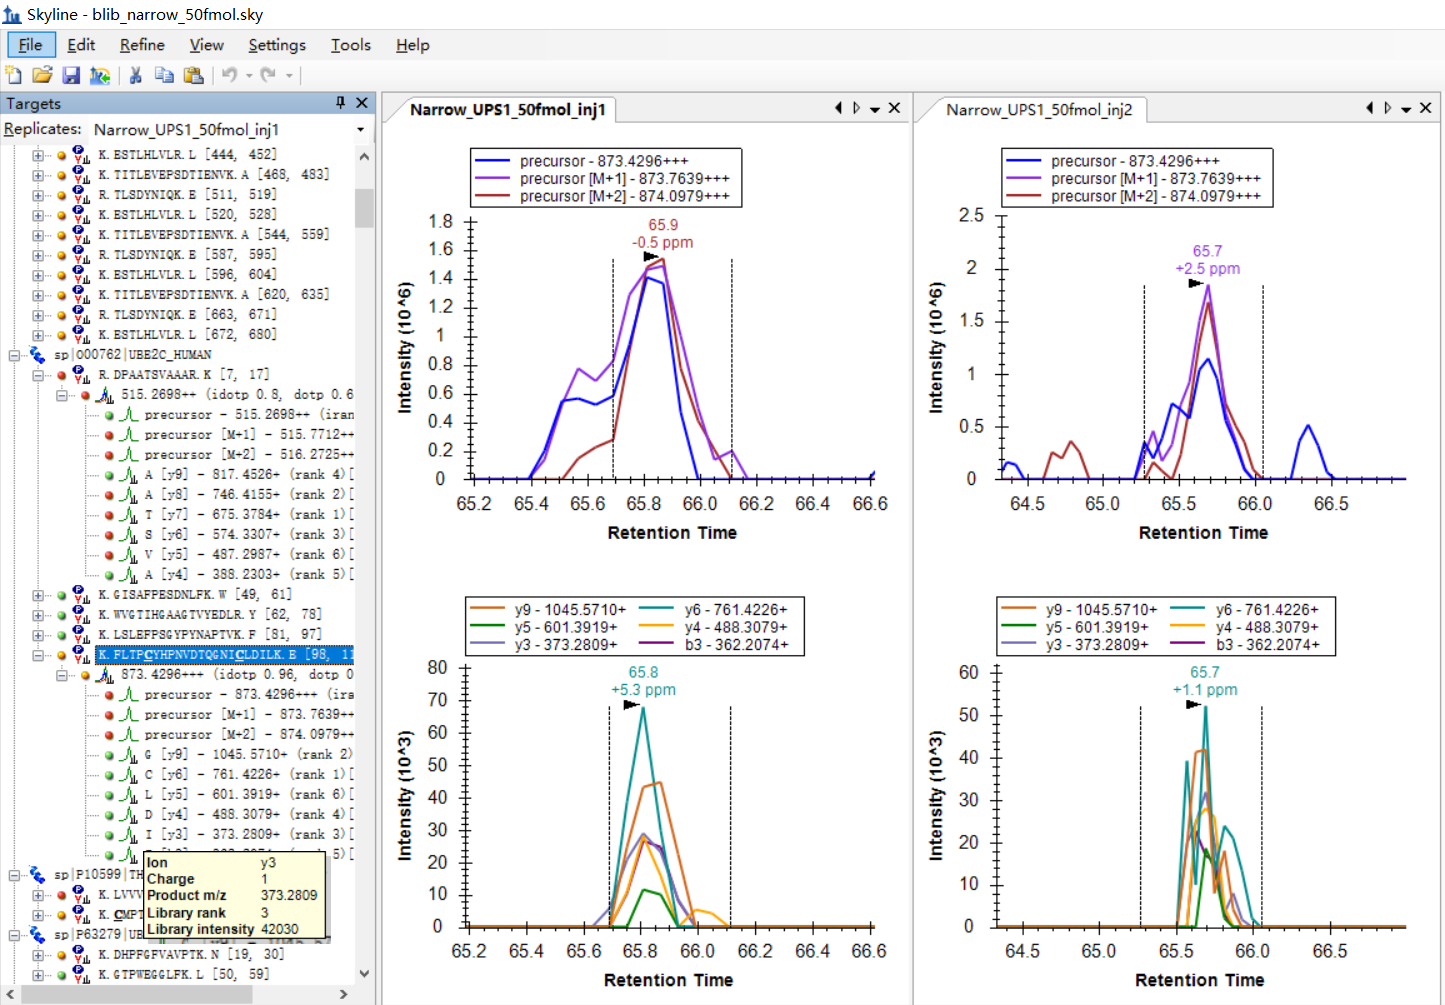 Yellow_Dot_Peptide.png
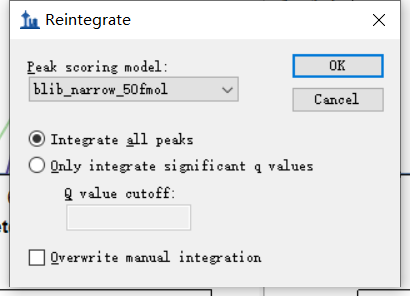 UI.png