| |
| Nick Shulman responded: |
2022-03-12 09:47 |
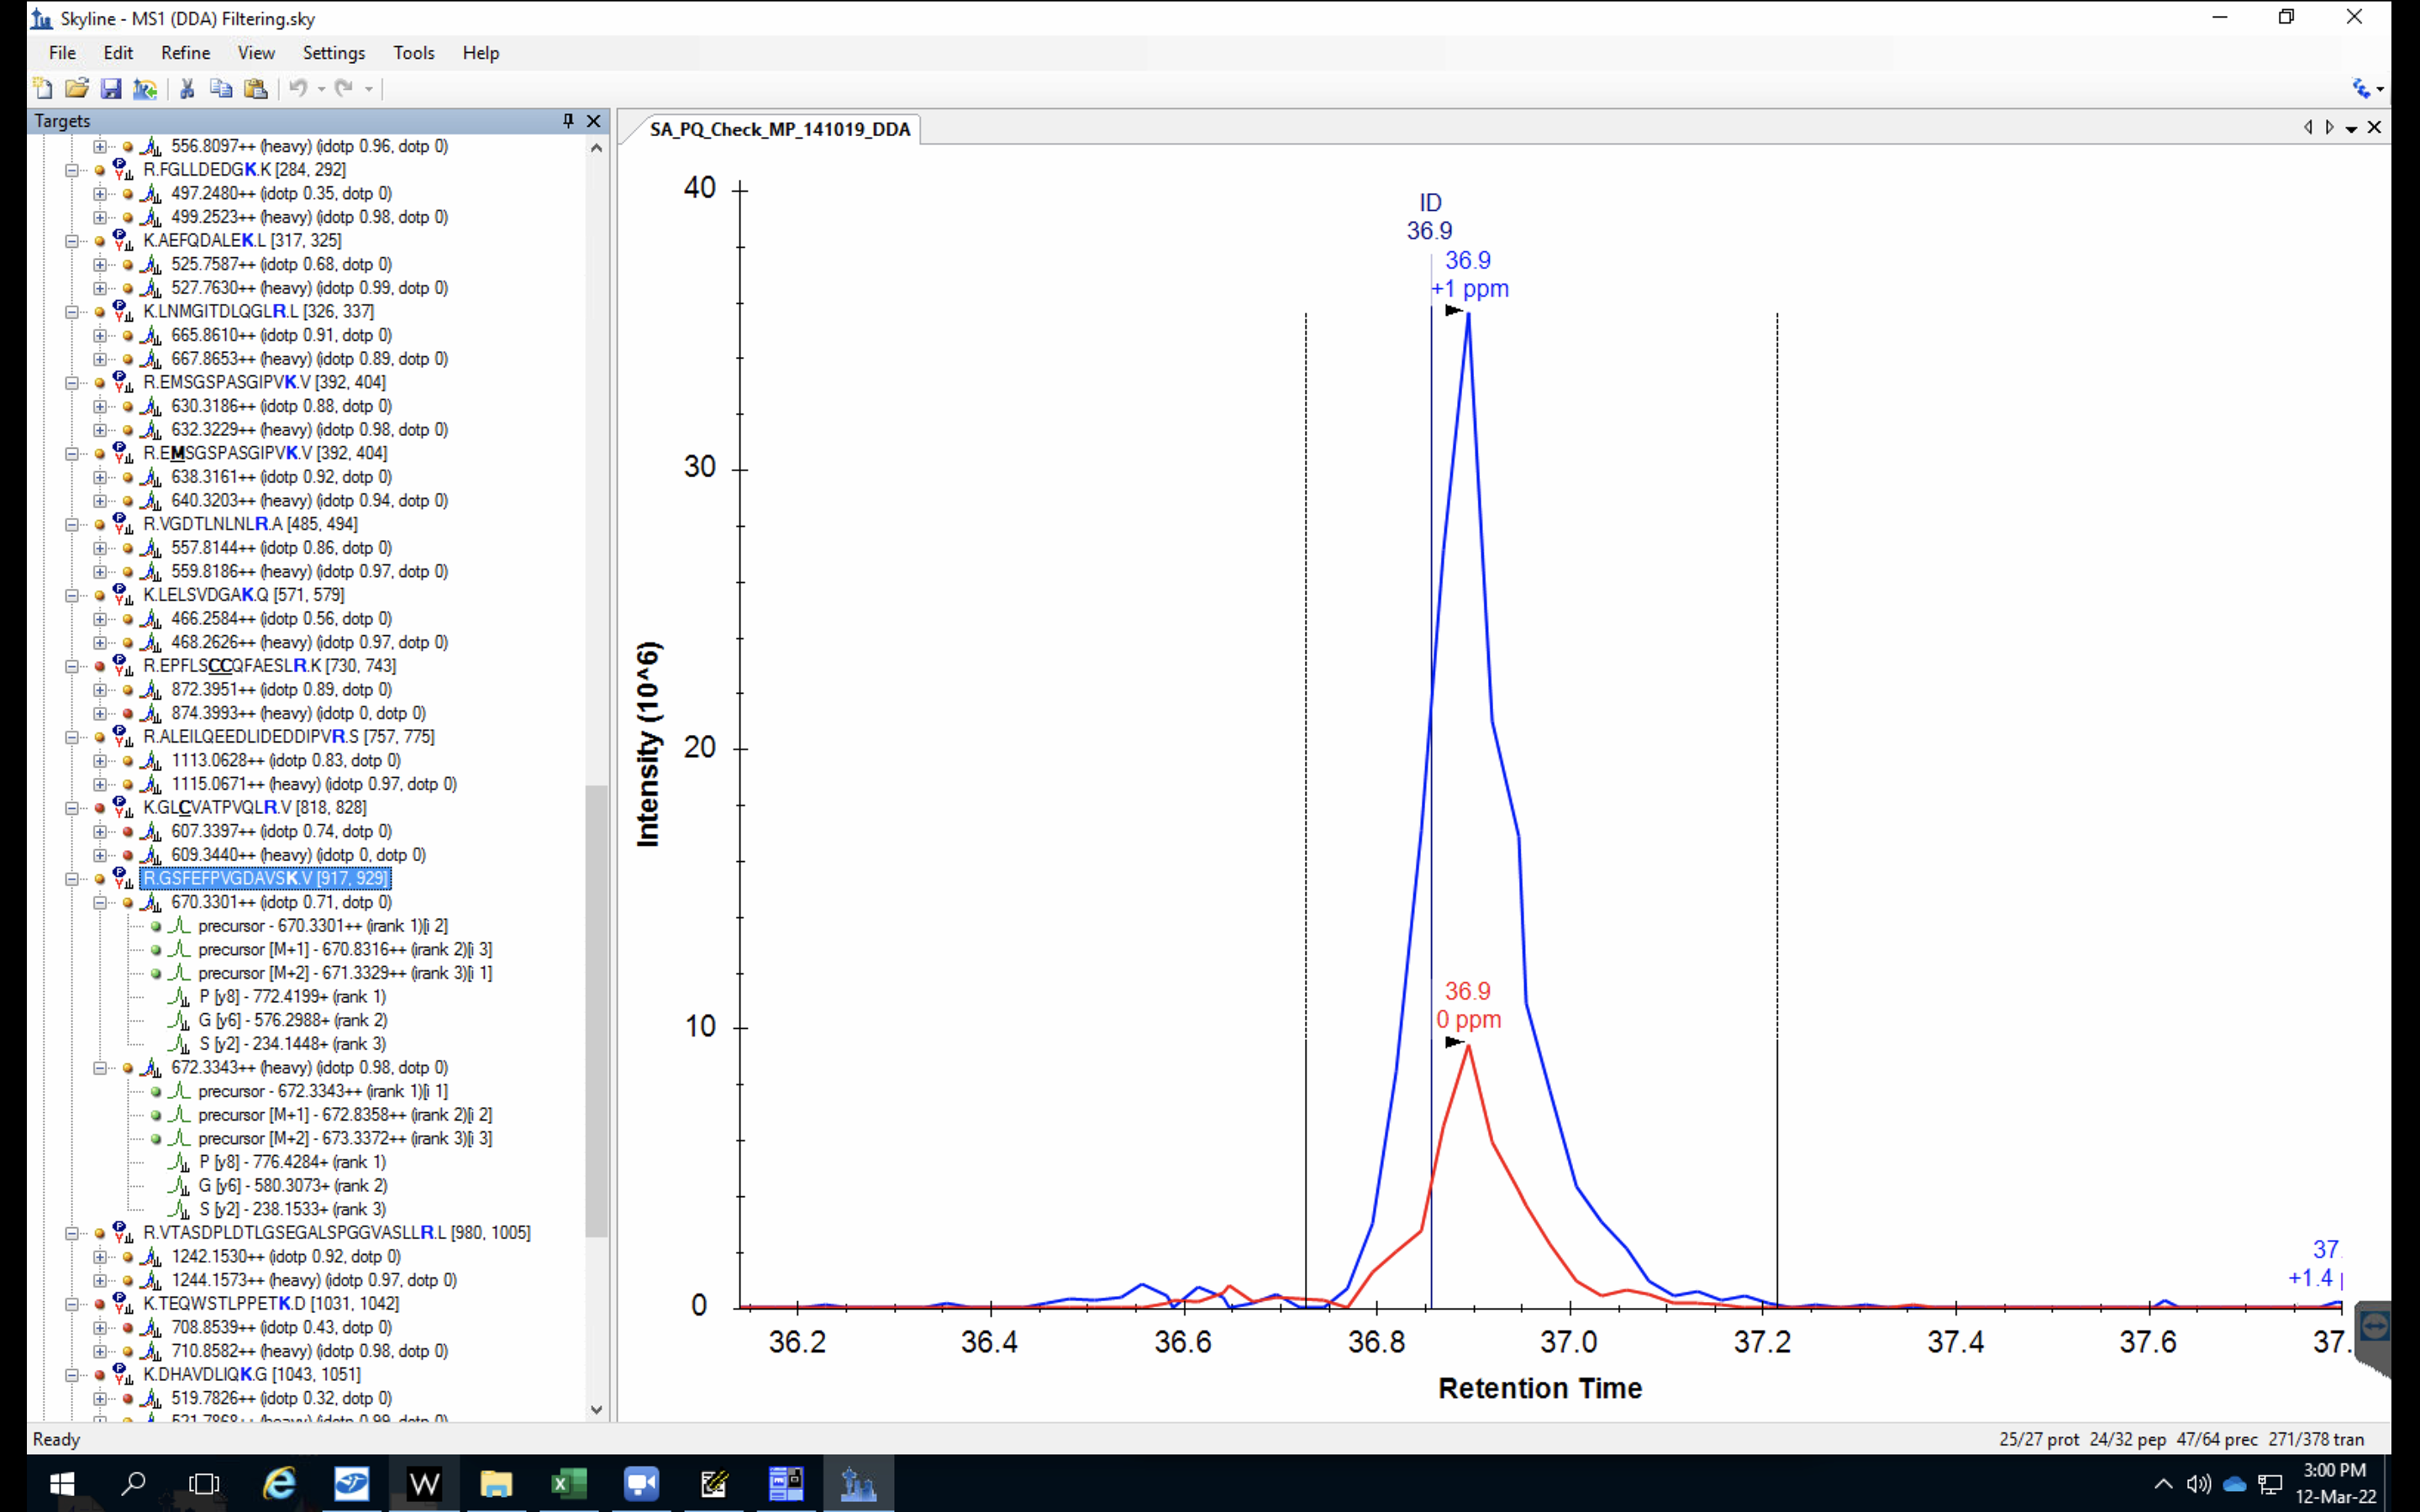
When the selected peptide in the Targets tree has more than one precursor, the chromatogram graph displays one chromatogram per precursor. The intensities along that chromatogram are the sum of the intensities of all of the individual transition chromatograms.
When you have a precursor selected in the Targets tree, you see one chromatogram per transitions.
When you have that heavy precursor selected, Skyline is showing you separate chromatograms for each of the masses in the isotope distribution. That is, you get one chromatogram for the monoisotopic mass, and a chromatogram for the M+1 mass and the M+2 mass.
If you add up the intensities of those individual chromatograms you will get a value close to the 36 million you are seeing in Attachment A.
If you right-click on the chromatogram and choose "Legend", Skyline will tell you which transition's chromatograms are being displayed in which color.
-- Nick |
| |
| sa825 responded: |
2022-03-12 15:28 |
I see, thank you for your response Nick.
Another question please.
Looking at the peak in the image attached, I can see three different "ID" values (43.4, 43.6 and 43.8), why is there three instead of one? And is there a way to show only one?
The image was produced by doing peptide spectrum matching.
Thanks,
Shimon |
|
| |
| Nick Shulman responded: |
2022-03-12 16:09 |
Each of those ID lines indicate a spectrum where your peptide search engine identified that peptide.
If you click on a point along the chromatogram, it will bring up the spectrum viewer which will show you the spectrum which contributed to that point on the extracted chromatogram.
If you do:
View > Library Match
you can see the spectra from your spectral library.
-- Nick |
| |
|
|
 A.png
A.png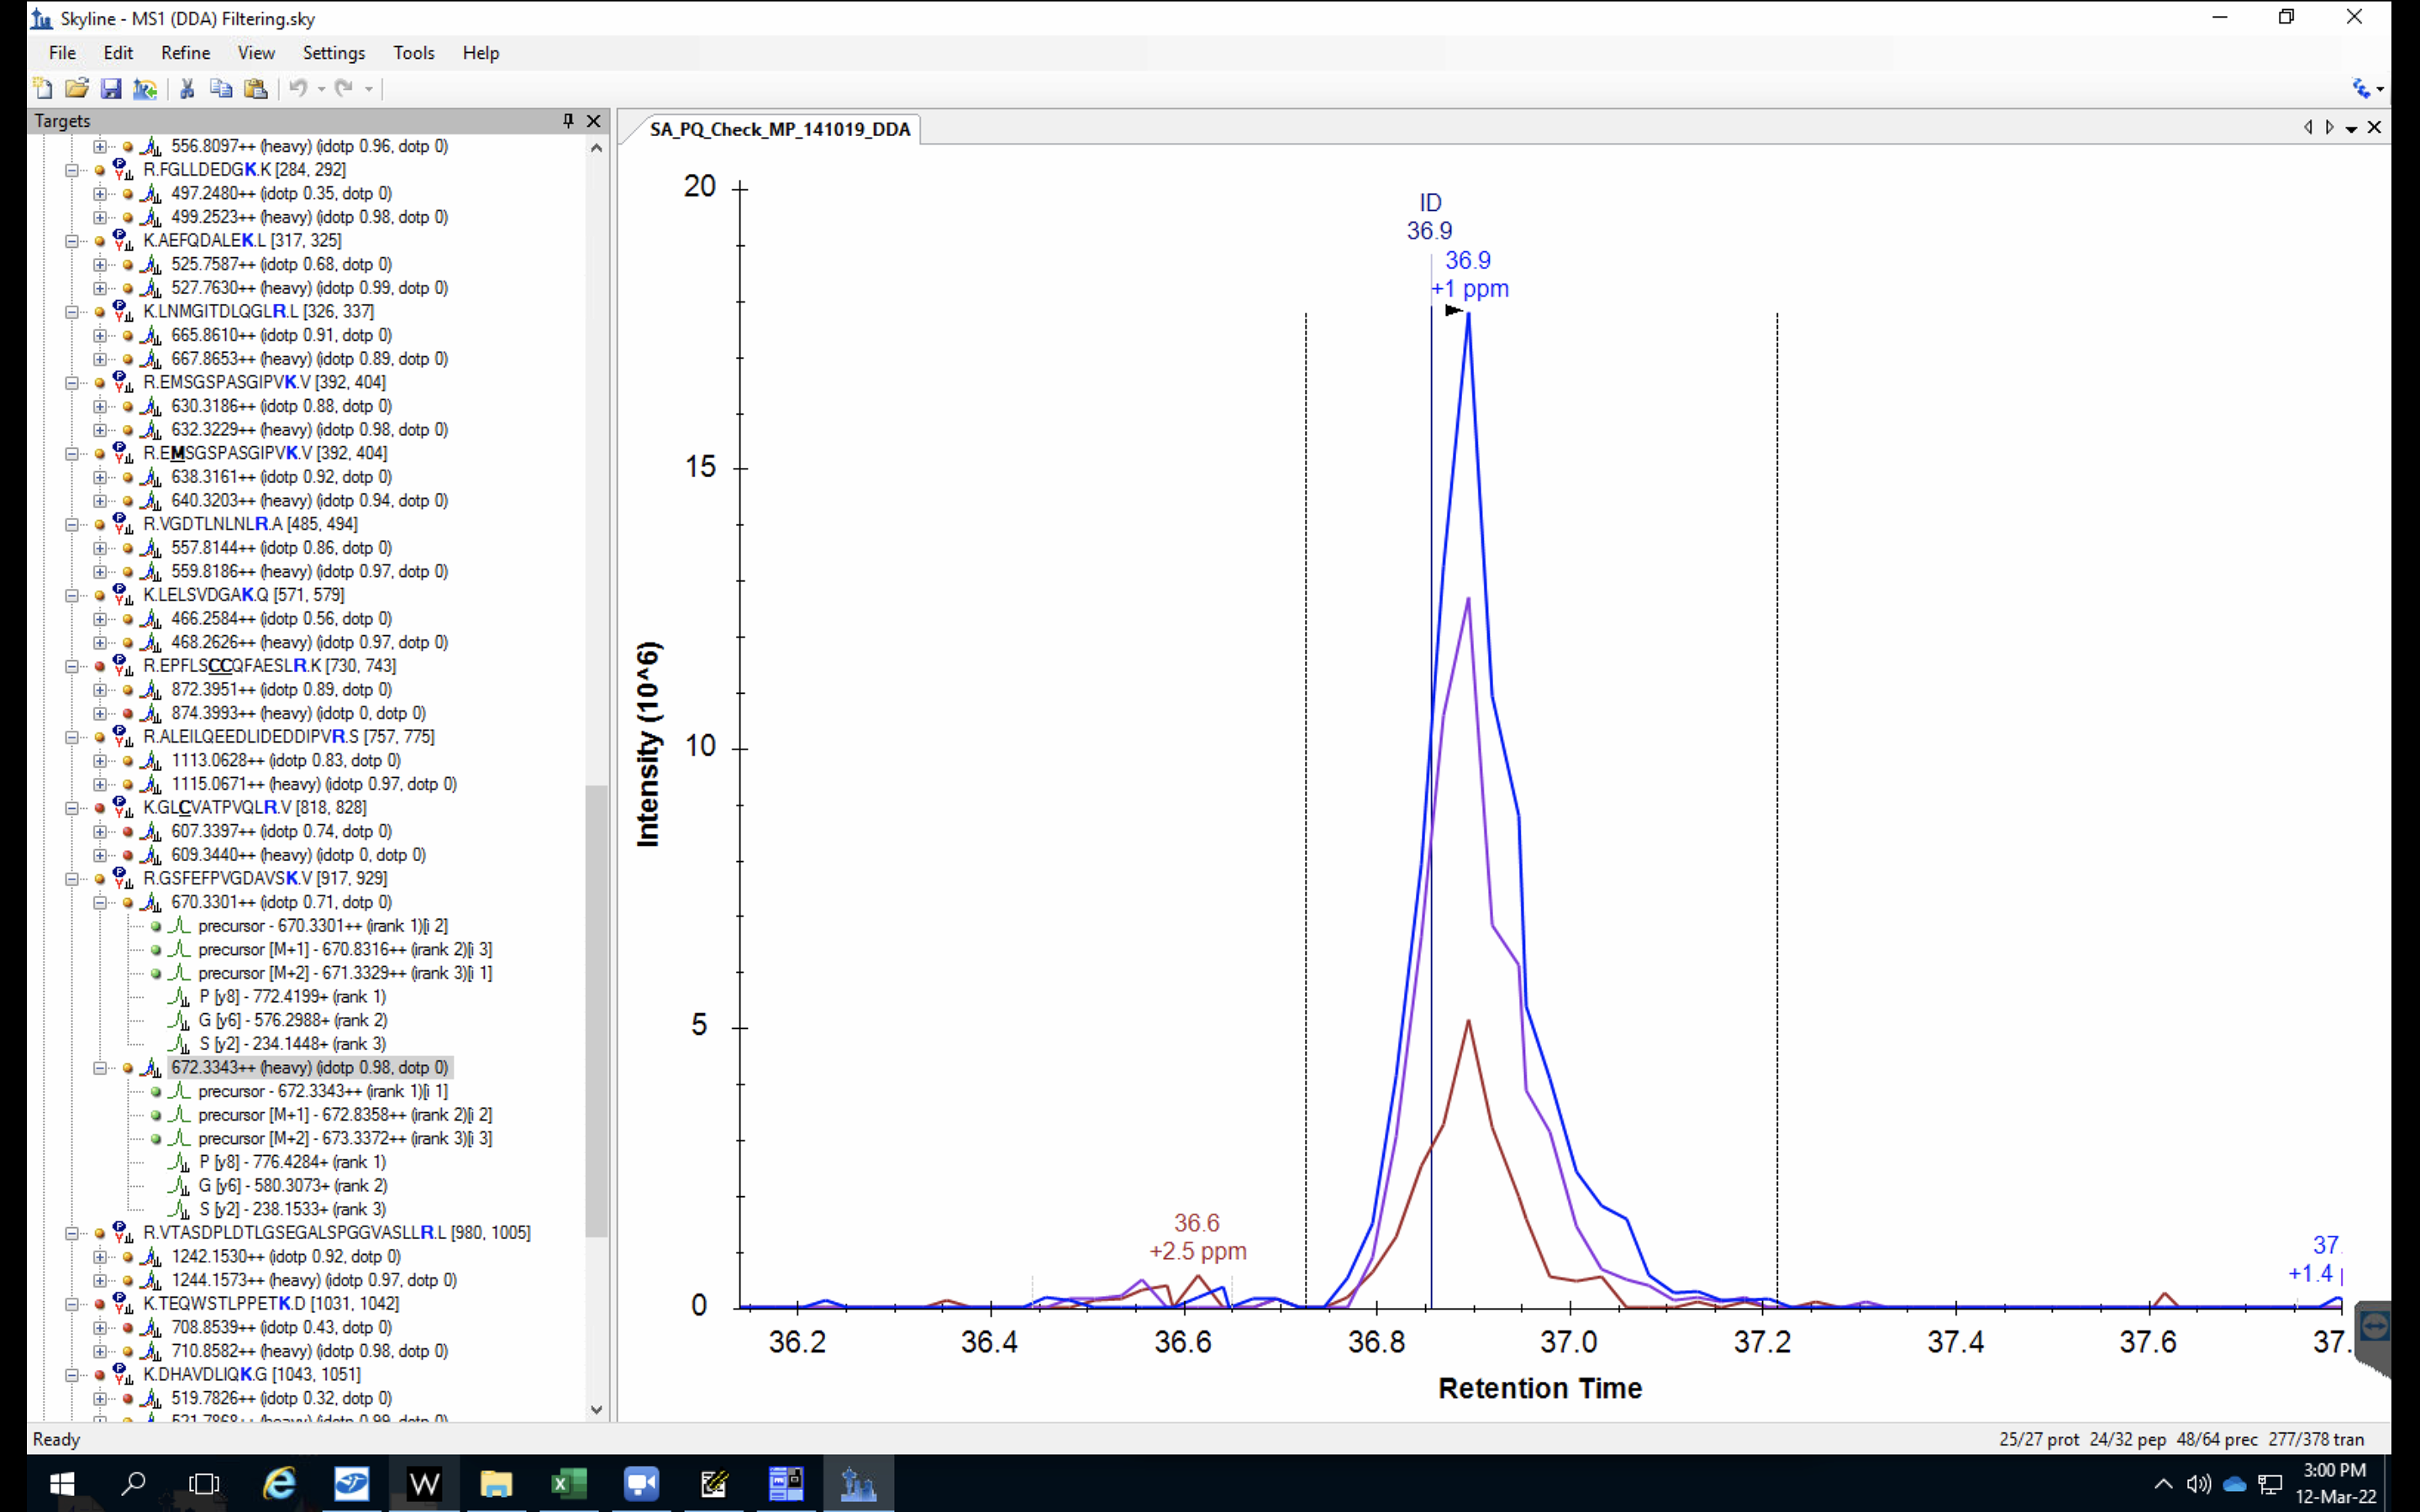 B.png
B.png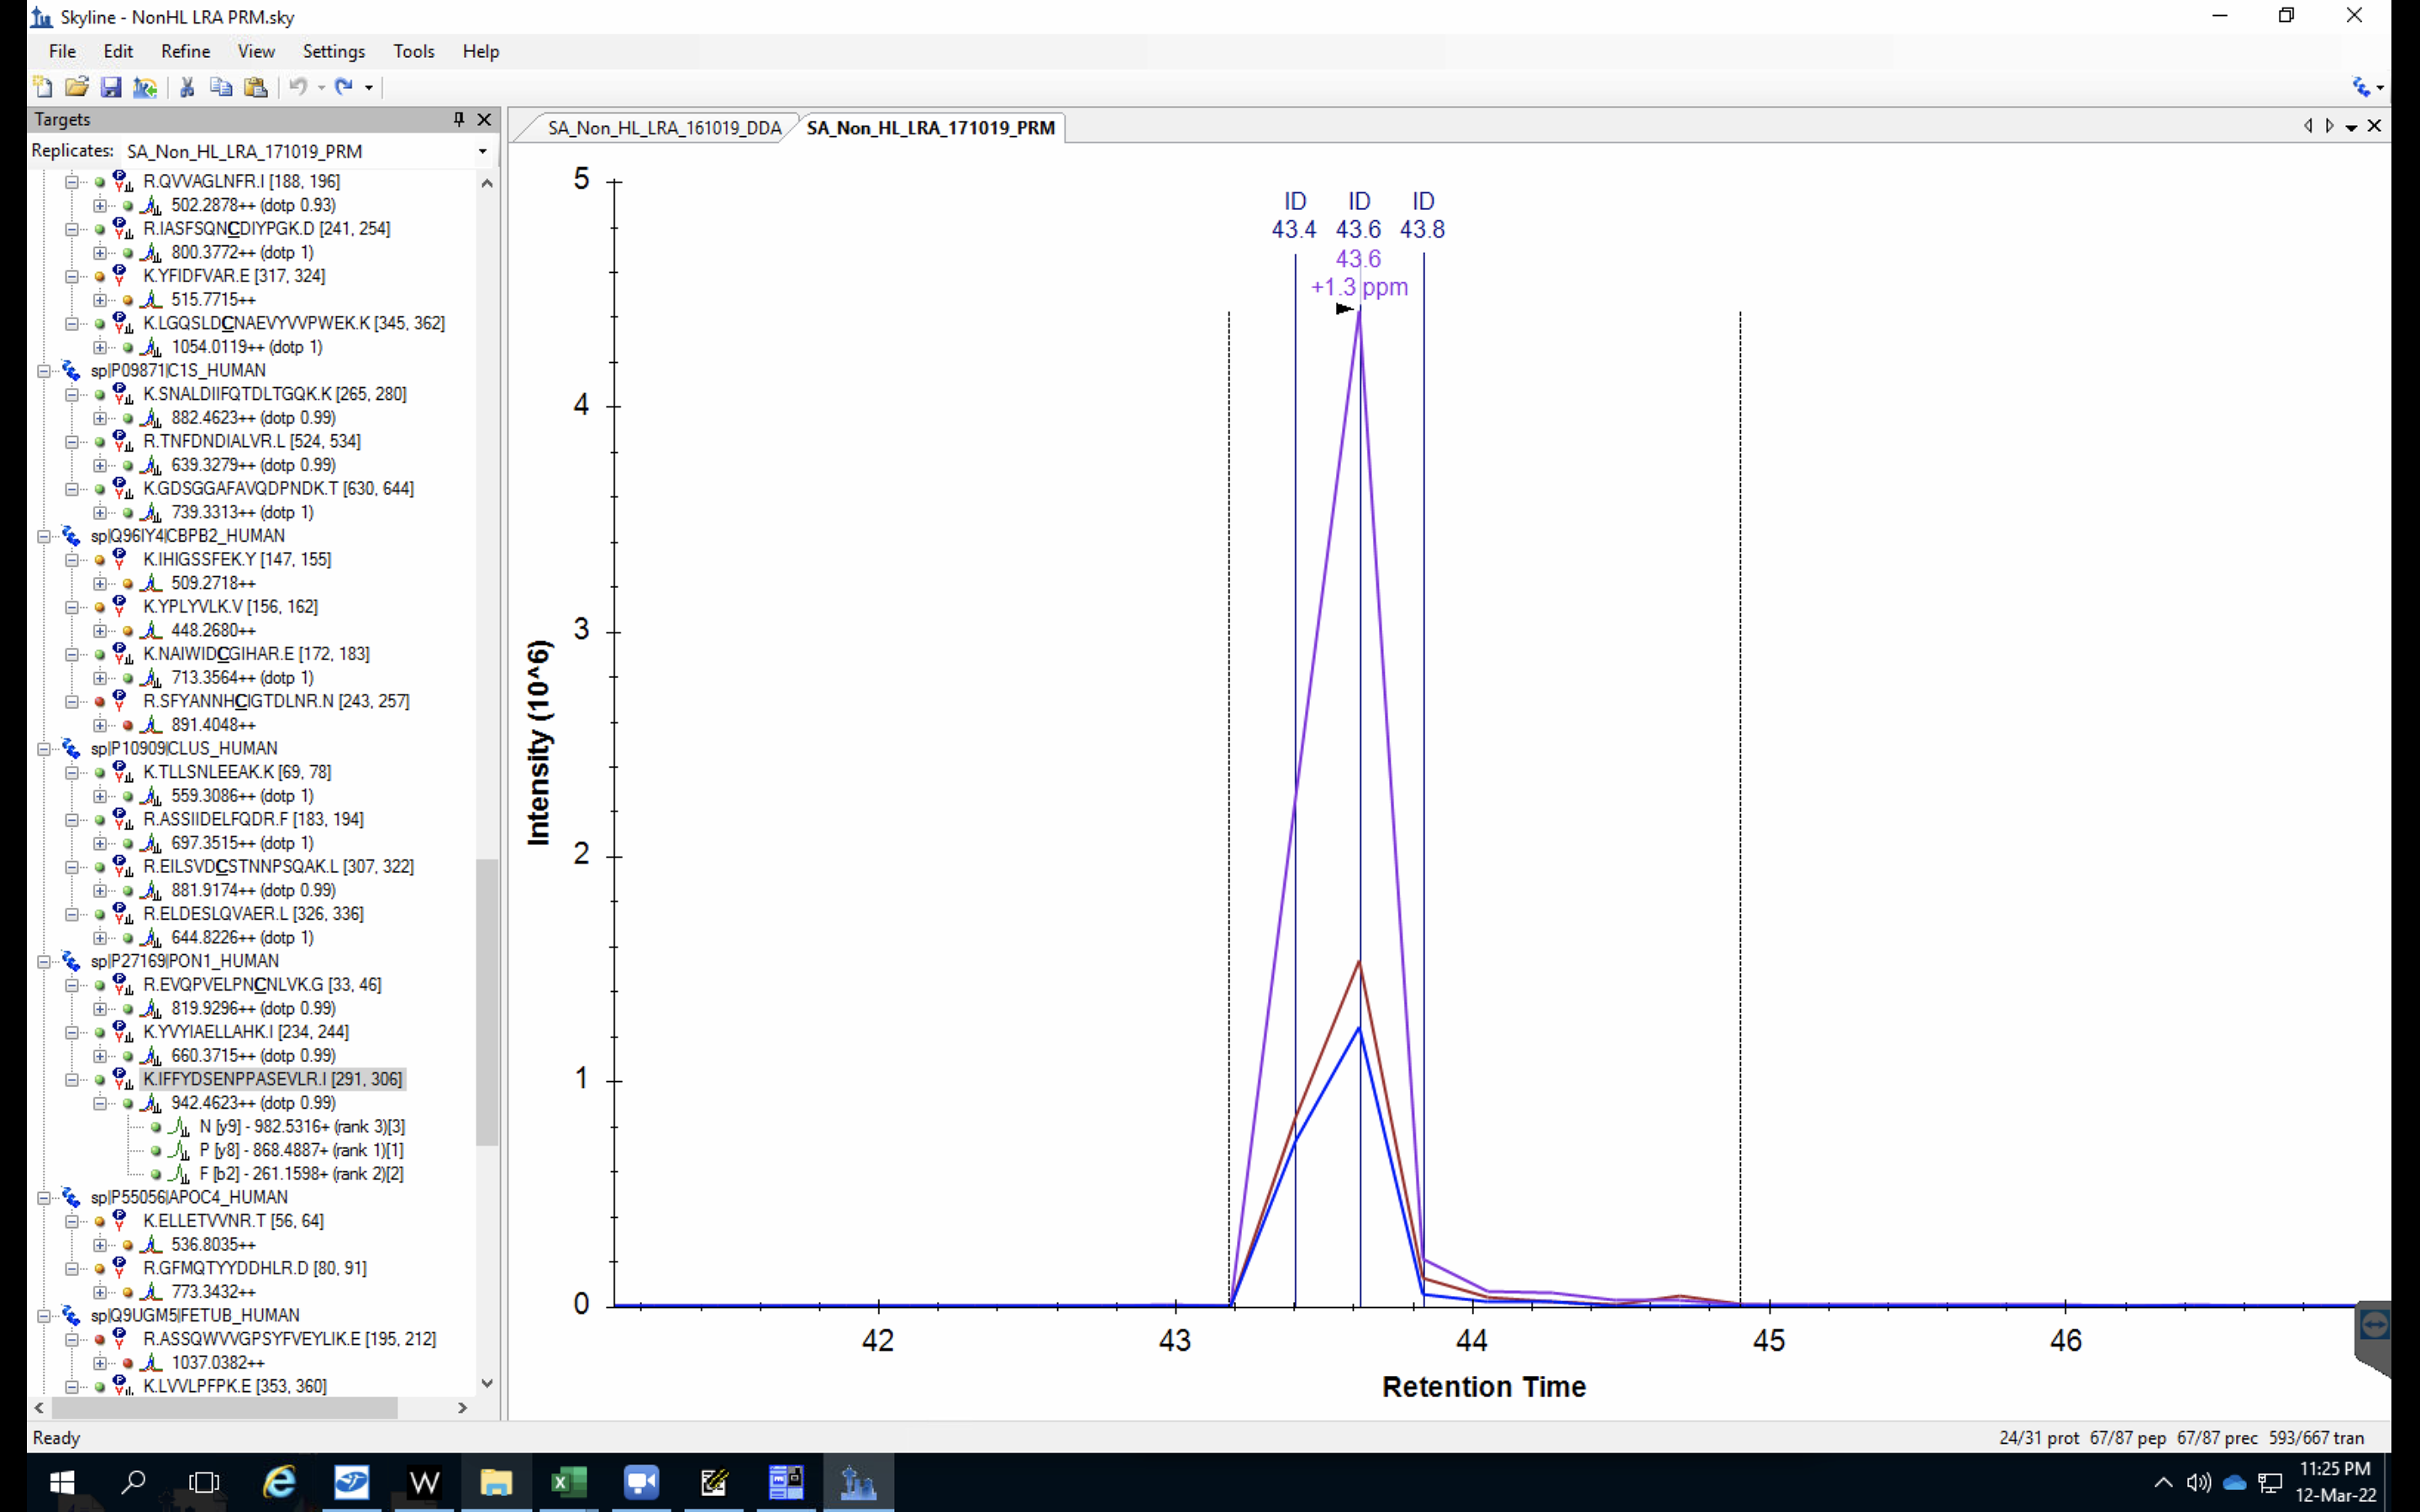 Screenshot 2022-03-12 at 23.25.22.png