Can you send us the .csv file that you exported from Skyline?
I cannot tell from whether what you are seeing in your Excel spreadsheet is caused by something Skyline did wrong, or whether Excel is misinterpreting a valid CSV file.
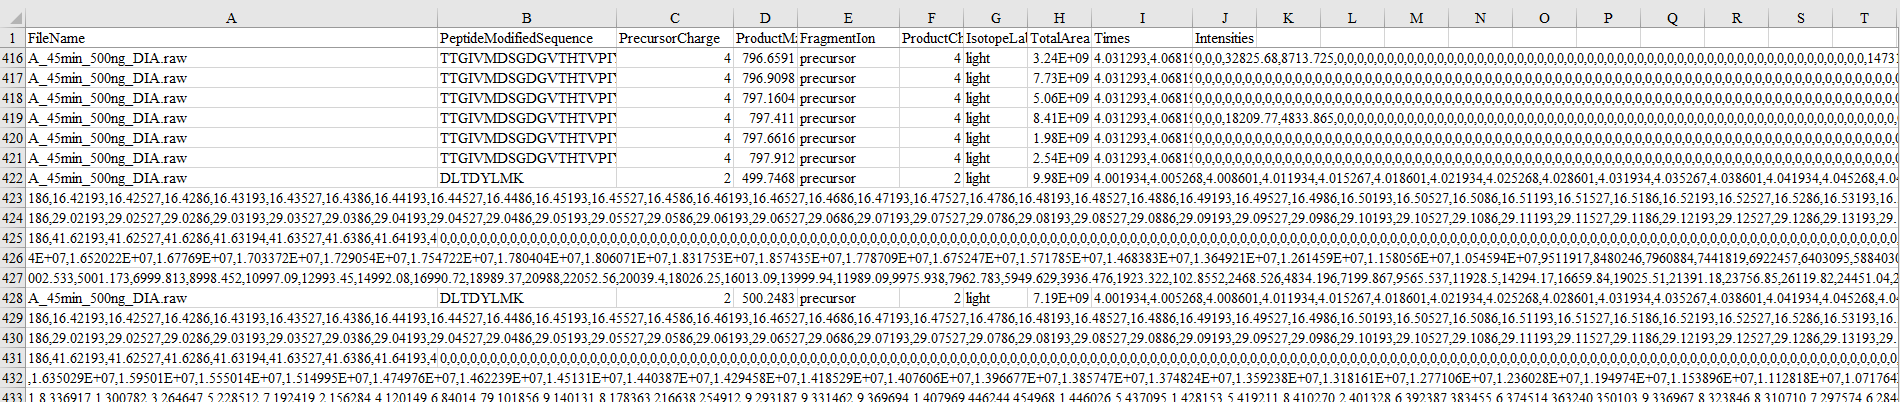
I see that your report had columns "Times" and "Intensities" in it.
When you export that to either CSV or Tab-separated-values, a list of numbers like that is represented as a quote character followed by a comma-separated list of numbers followed by another quote character. Outside of those two quote characters will either be a tab character which Excel will interpret as a new column in the spreadsheet.
I see that at line 422 of your spreadsheet, it looks like the intensities, instead of appearing in the "intensities" column are in the first Excel column. I would need to see the original csv or tab-separated-value file to know why Excel did that. It might be that there is a maximum line length that Excel can handle, and that is what happens if a single line in the text file is more than that.
Also, if you would like, you can send us your report definition and your Skyline document.
An easy way to include the report definition in the Skyline document is to go to:
Settings > Document Settings > Reports
and check the checkbox next to the report you were looking at.
Then, you can use the menu item:
File > Share
to create a .zip file containing your Skyline document which will also include that report definition.
If that .zip file is less than 50MB you can attach it to this support request. You can upload larger files here:
https://skyline.ms/files.url
-- Nick
 ExcelScreenshot.png
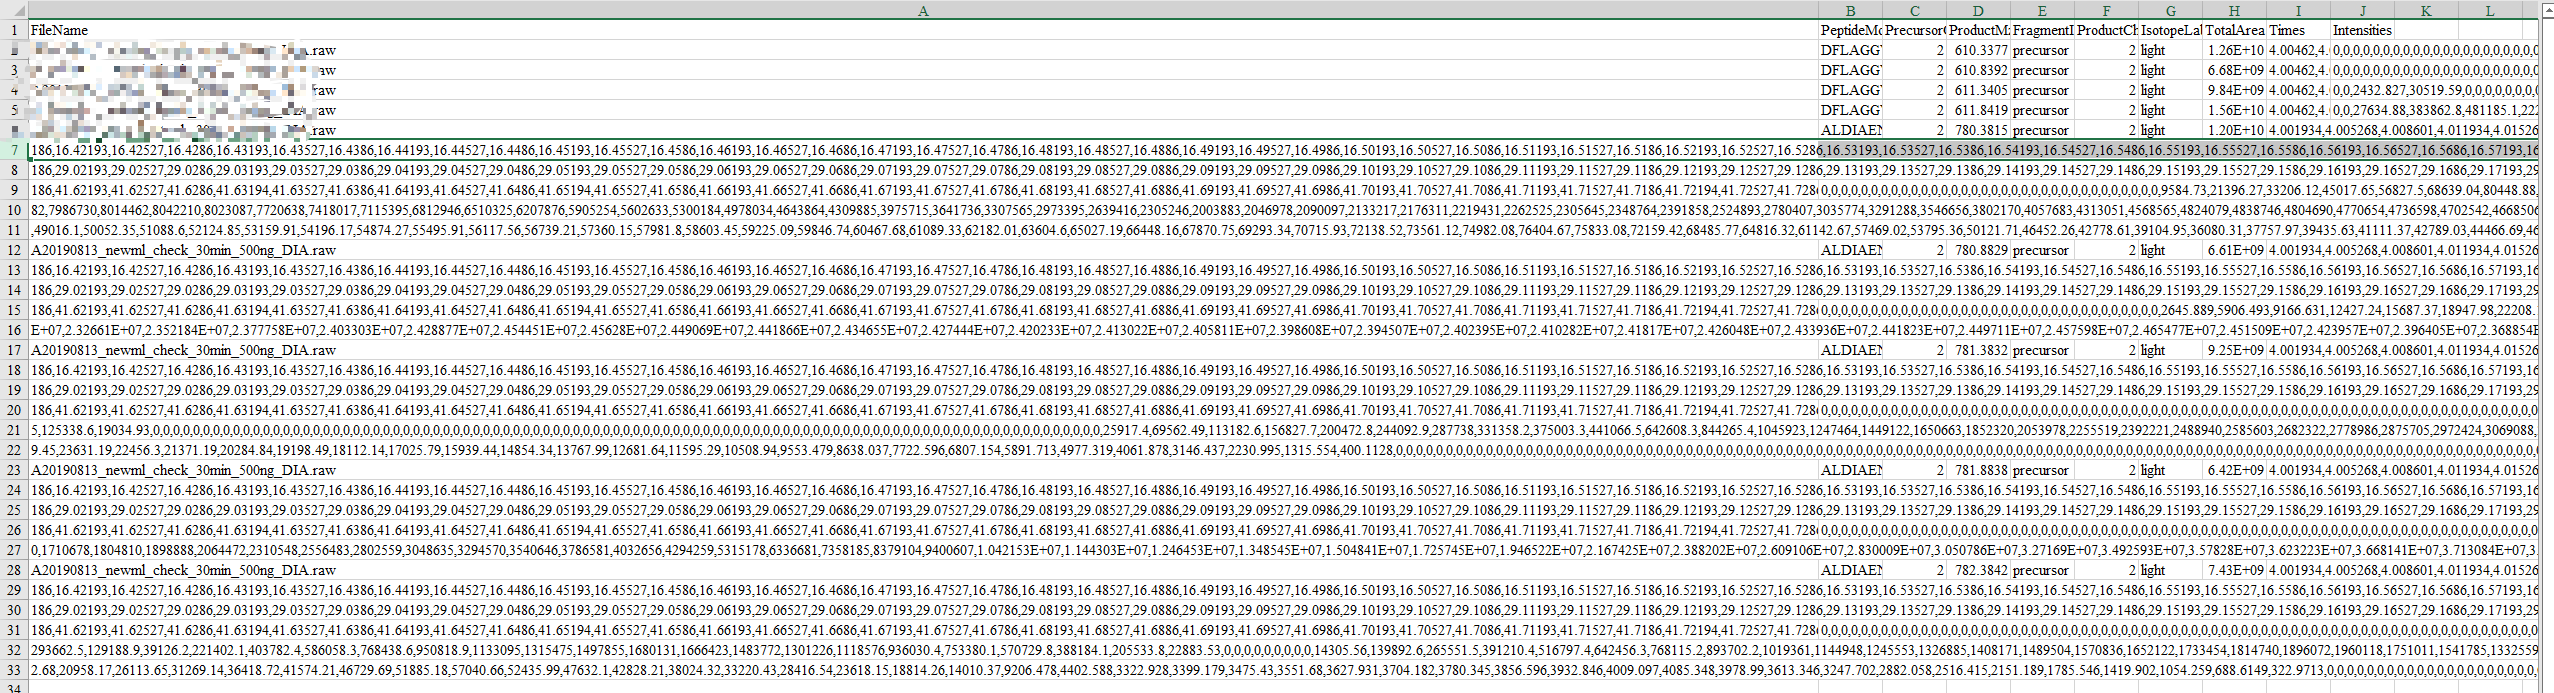 screenshot.png