| Different results from raw data that are nearly the same in MassLynx | anna walke | 2021-01-07 05:36 | |||||||||||||||||||||||
Dear SkyLine Team, I'm working with a simple method on a waters Premier Pro QToF to weekly check system performance by analyzing a standard of angiotensin II. Measurement is performed by Full Scan (function 1) and MS/MS scan (function 2) in parallel over the entire time range of the method. Unfortunately when analyzing my raw data with Skyline (version 20.2.0.343) I get very different results compared to manually analyzing the same data in MassLynx. I added screenshots of this and also attached the corresponding information of my LC-MS experiment. Within the experiment report I highlighted the different paramters in yellow, but there are only little differences. I do not understand why the same SkyLine Document (also attached below) with same molecule and transition settings gives that different results after integration. Could you please help me or give a hint towards a possible solution? With kind regards, |
|||||||||||||||||||||||||
| |||||||||||||||||||||||||
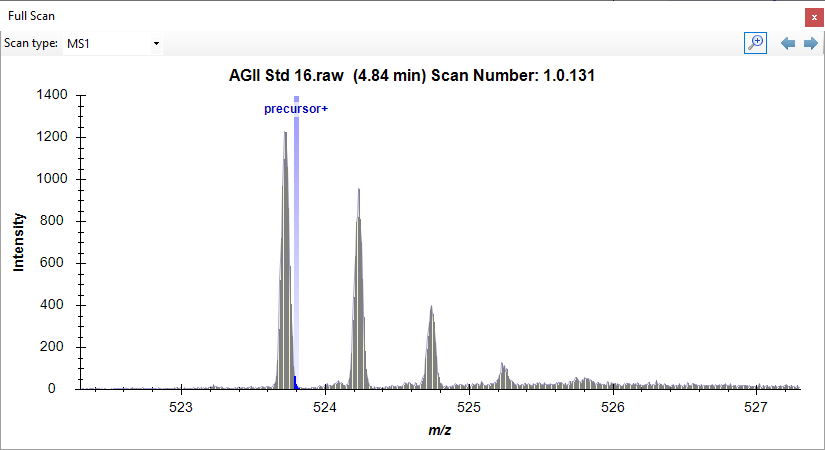 ms1spectrum.png
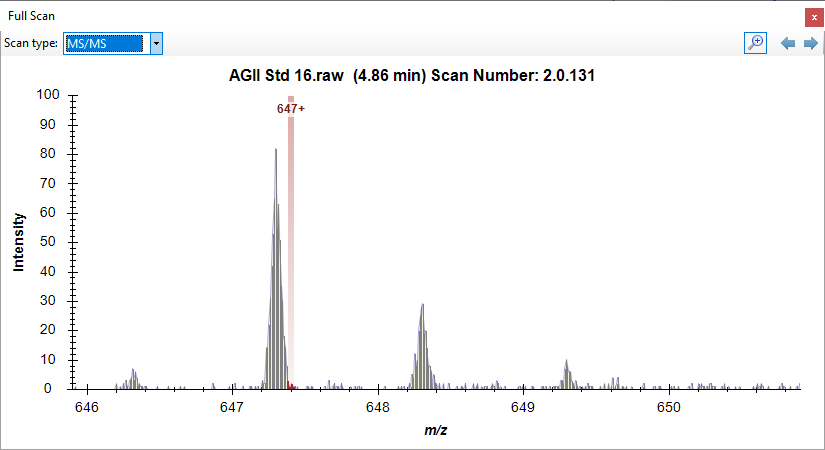 ms2spectrum.png