Can you send us your Skyline document and .raw file? I will be able to tell you how Skyline got the numbers that it did.
I am not sure whether we ever tried to make it so that the intensities reported by Skyline would be identical to the ones in XCalibur, or whether we just guaranteed that they would be proportional.
If you click on a chromatogram in Skyline, it brings up the Full Scan window, where Skyline will show you how wide of a channel in the m/z space Skyline summed across to get the chromatogram intensity. It might be that Skyline was summing across a wider window, but that would depend on the settings in "Transition Settings > Full Scan".
Anyway, if you send me your data I can take a look.
In Skyline, you can use the menu item:
File > Share > (complete)
to create a .zip file containing your Skyline document and supporting files including extracted chromatograms.
You can upload that .zip file here:
https://skyline.ms/files.url
You should also upload one of your .raw files.
-- Nick
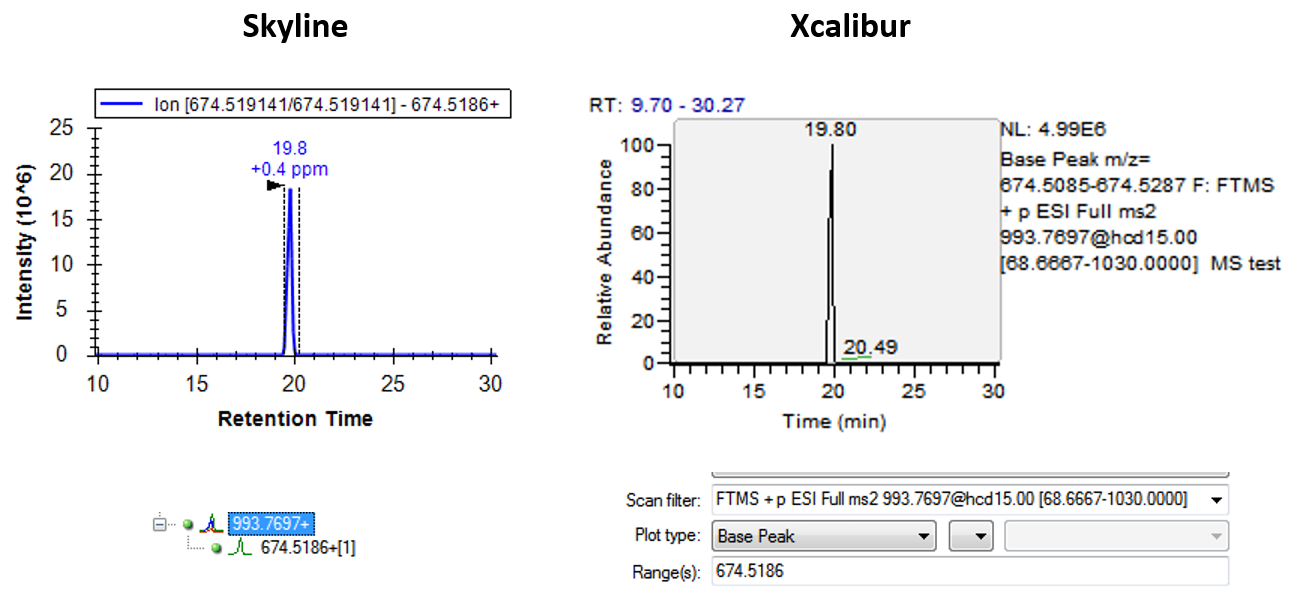 skyline_vs_xcalibur.png
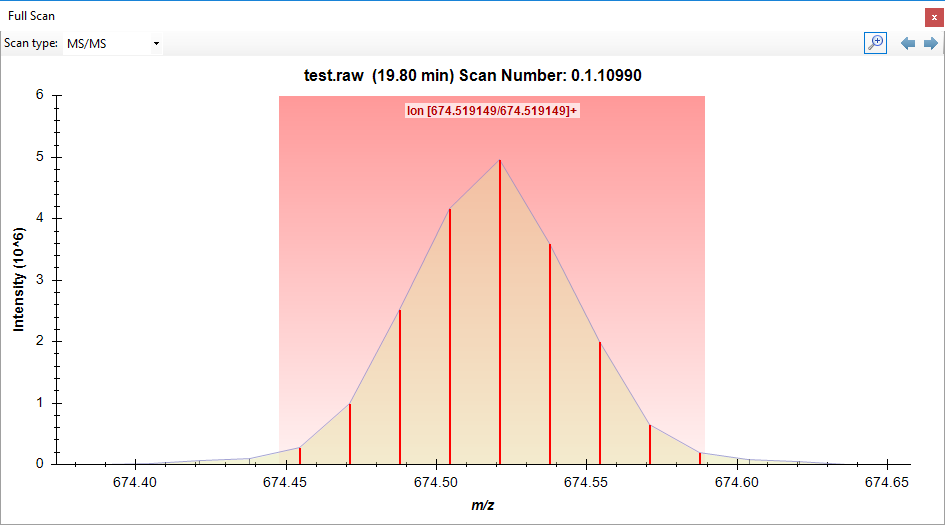 FullScanWindow.png