I hope the scheduling graph is useful, but you probably need to do your own research on how the instrument responds to different settings. I hope that both the scheduling graph and the points across the peak chromatogram graph detail will give you new insights. If you have any, please post them here.
I guess I expect an instrument with a target cycle time to need to vary dwell time based on the number of transitions to monitor at any given time, since essentially the relationship is (ignoring switching time between transitions):
transition count * dell time = cycle time
To keep cycle time constant through changes in transition count, then dwell time would have to change.
Dwell time is likely the least visible value in this equation.
- Transition count over time is shown in the scheduling graph
- Cycle time can be understood from the points across the peak information (and Target Scan Time on the method)
As far as I know, dwell time is not recorded in the data. But that is an interesting idea to have Skyline graph it in the RT scheduling graph. It could do this a priori if you gave it the "Target Scan Time" or we could also graph dwell time from raw data by counting the number of transitions measured in a period of time.
But, unfortunately, we don't yet do either. You could probably pretty easily invert the scheduling graph in Excel, by using right-click > Copy Data, pasting the graph points into Excel and then adding an equation column "=TargetScanTime/TransitionCount" where TransitionCount is the value from Copy Data.
Hope this helps. Good luck with working out your optimal settings.
--Brendan
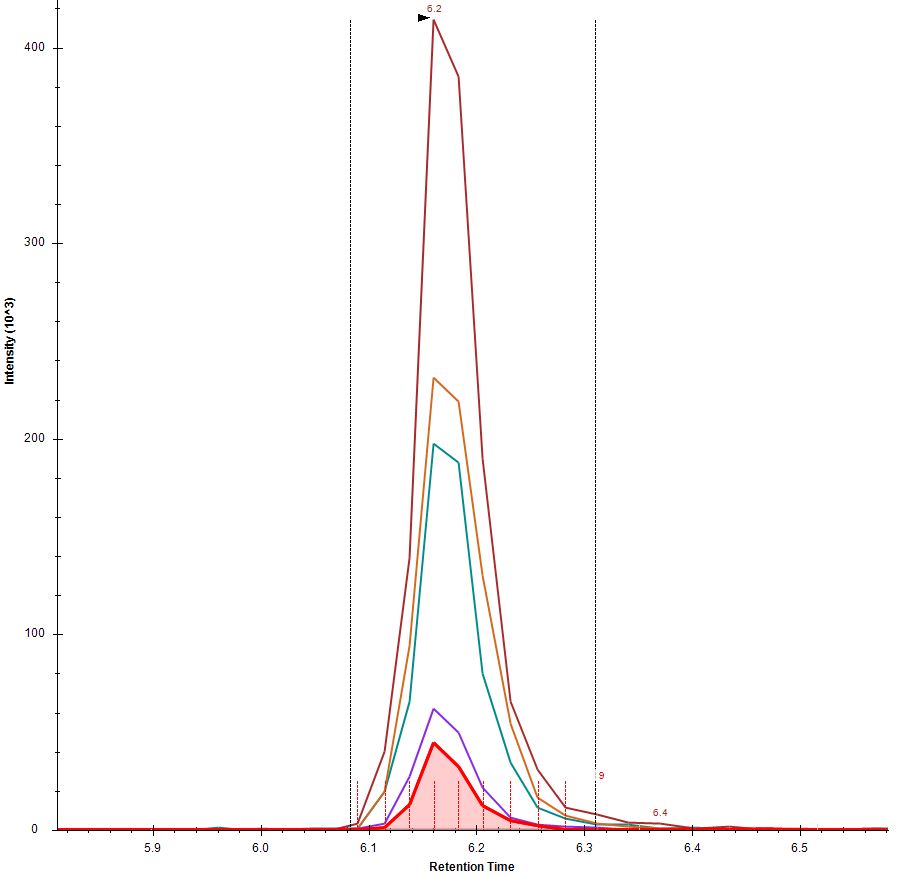 Capture.JPG