| |
| Nick Shulman responded: |
2018-06-16 12:04 |
The command line would be:
msconvert.exe --filter peakPicking myfile.wiff
(msconvert calls it "peakPicking" instead of "centroiding"). |
| |
| Brendan MacLean responded: |
2018-06-16 13:59 |
Hi Stoyan,
Maybe I was too general in my statements. I have not found much benefit in centroiding 5600 data (with files from a number of labs), but with the 6600 data from the Navarro, Nature Methods 2016 paper, I did see a benefit to centroiding and using a 10 to 15 ppm mass accuracy tolerance.
With 5600 data, the two are comparable with maybe just a slight penalty in number of peptide detections with centroided data. But, since there is not a clear benefit, I would recommend against converting 5600 SWATH data for Skyline, which can read WIFF files directly. But, do consider using the TOF mass analyzer setting with 18,000 to 20,000 resolving power with "Use high-selectivity extraction" checked, if you are extracting chromatograms in a complex sample (i.e. not purified).
I expect to do a more thorough investigation of the effect of centroiding on 6600 data to make sure the benefit I saw holds. Though, if you have a 6600 and can do your own comparison, I would be interested in hearing about what you find.
Thanks for watching the webinar and posting to the support board. We missed you at ASMS this year.
--Brendan |
| |
| sstoychev responded: |
2018-06-16 14:51 |
Thanks for the insightful feedback Brendan. We do have a 6600 and indeed the plan is to import both profile and centroid data from complex lysates. Will keep you posted on the results.
Two questions in this regard.
1) The 18-20K resolution you mention, is that limited to the 5600 or applies to 6600 also since in the webinar using 60k resolution for importing 6600 data seems to give the best results. Also does it matter of the SWATH data is acquired in high sensitivity or high resolution mode?
2) there was some Bruker data in your tutorial where it had to be re calibrated in order to improve the peptide matches. Is there are a feature in Skyline that allows for recalibration (both spectral library and swath data)? We see mass shifts with the 6600 also and re calibration will probably improve data quality in our case also.
Was looking forward to ASMS but unfortunately couldn't make it out this year.
Regards,
Stoyan |
| |
| Brendan MacLean responded: |
2018-06-16 15:31 |
Great. That should be interesting.
(1) You might want to also pay some attention to my Skyline UGM 2016 presentation where I cover some of what I learned about this during work on the Navarro paper:
https://skyline.ms/wiki/home/software/Skyline/events/2016%20User%20Group%20Meeting%20at%20ASMS/page.view?name=maclean
Can't remember whether this is completely redundant with the webinar.
In the end, for the 6600 runs of that data set, I found 60,000 rp worked best with profile extraction and +/- 10 ppm worked best with centroided extraction. Since then, I have found +/- 10 ppm to work very well as a default for centroided spectra most modern mass spectrometers (especially Thermo, SCIEX and Bruker).
However, most people looking at the profile peaks in the 6600 data from that paper would agree that the mass spectrometer measured at 30,000 rp, but we originally chose to use 2*m/z-resolution as the extraction width in Skyline. So, I needed to use 60,000 rp in the settings to get extraction at just the m/z-resolution width. Rather than having to explain to people that they should be doubling their measured resolving power in complex samples in Skyline, I added the "Use high selectivity extraction" checkbox, which uses 1 resolution when checked and 2 when not checked.
So, if you think you measured 30,000 rp on your 6600, then just use 30,000 rp, but also check the check box and you will get what I used in the Navarro paper. I found 40,000 rp worked best for profile data from the 5600 in the Navarro paper (slightly better than centroided data), and that would be equivalent to 20,000 rp with the check box checked. Though, I have been using 18,000 rp with "high selectivity extraction" analyzing the Collins, Nature Communications 2017 data from 12 laboratories with 5600 instruments.
(2) No. Skyline does not do mass recalibration. It is a tricky thing to get right and can be curvilinear in relation to the m/z values. In the Bruker study, I saw Spectronaut doing its own mass recalibration, which worked for one data set but seemed to make things worse for another. I decided to leave this as a separate pre-processing step like centroiding, which you can choose to apply from other tools (including vendor tools).
I would recommend becoming familiar with the command-line scripts presented with those webinars. They will allow you to cover a lot of ground optimizing your DIA data processing methods for the data your instrument is producing, and using the SkylineRunner argument --import-process-count=N will allow you to get the most out of parallel processing on any computer up to one with dozens of cores.
Hope that explains enough to get started. Good luck.
--Brendan |
| |
| sstoychev responded: |
2018-06-17 01:14 |
Is there are webinar or tutorial that shows building of DIA assay libraries (.tsv files) using Skyline starting with the output of a database search? |
| |
| Brendan MacLean responded: |
2018-06-17 07:40 |
That's not at all required. Though our import of these has gotten quite good, it is still much simpler to just build your spectral libraries in Skyline, and we have been improving that workflow, which can now include iRTs in the .blib file and does a much better job of generating them than when webinar 14 was recorded.
However, there are resources from the Aebersold lab on generating Assay Libraries, like the protocol paper:
https://www.ncbi.nlm.nih.gov/pubmed/25675208
And the materials and recordings (Downloads and Videos) from last year's DIA/SWATH course at ETH Zurich:
http://dia-swath-course.ethz.ch/
If you go this route and become convinced that it works better for you than simply building a library within Skyline, please let us know and we will be happy to try to figure out why that is and further improve Skyline. |
| |
| sstoychev responded: |
2018-06-17 08:04 |
Great, I was not sure about the iRT integration. Is that shown in the iRT Retention Time Prediction tutorial? I suppose will have to build the iRT retention time calculator via the peptide settings and then mark the iRT peptides as RT standards? |
| |
| Brendan MacLean responded: |
2018-06-17 09:03 |
Not if you are using any of the iRT standards that Skyline knows about. Then you just choose which standard you are using during the library build and Skyline will embed the iRT calculator into you .blib file and then automatically set up a default iRT predictor for you.
The iRT tutorial is still useful for understanding how everything fits together and if you want to build your own iRT calculator from scratch with endogenous peptides or an unknown standard (though, if you encounter one of those, let us know and we will try to get it added).
But, if you are using a known RT standard mix, then we have tried to streamline things quite a bit. |
| |
| bernhardt responded: |
2018-08-02 08:28 |
Hi Brendan
> I saw Spectronaut doing its own mass recalibration, which worked for one data set but seemed to make things worse for another.
Any possibility to share that data with me? I would like to look into this myself. I have, in the seven years of developing Spectronaut, not once seen a data-set where the mass calibration failed, so I would be very interested in that data as you can see.
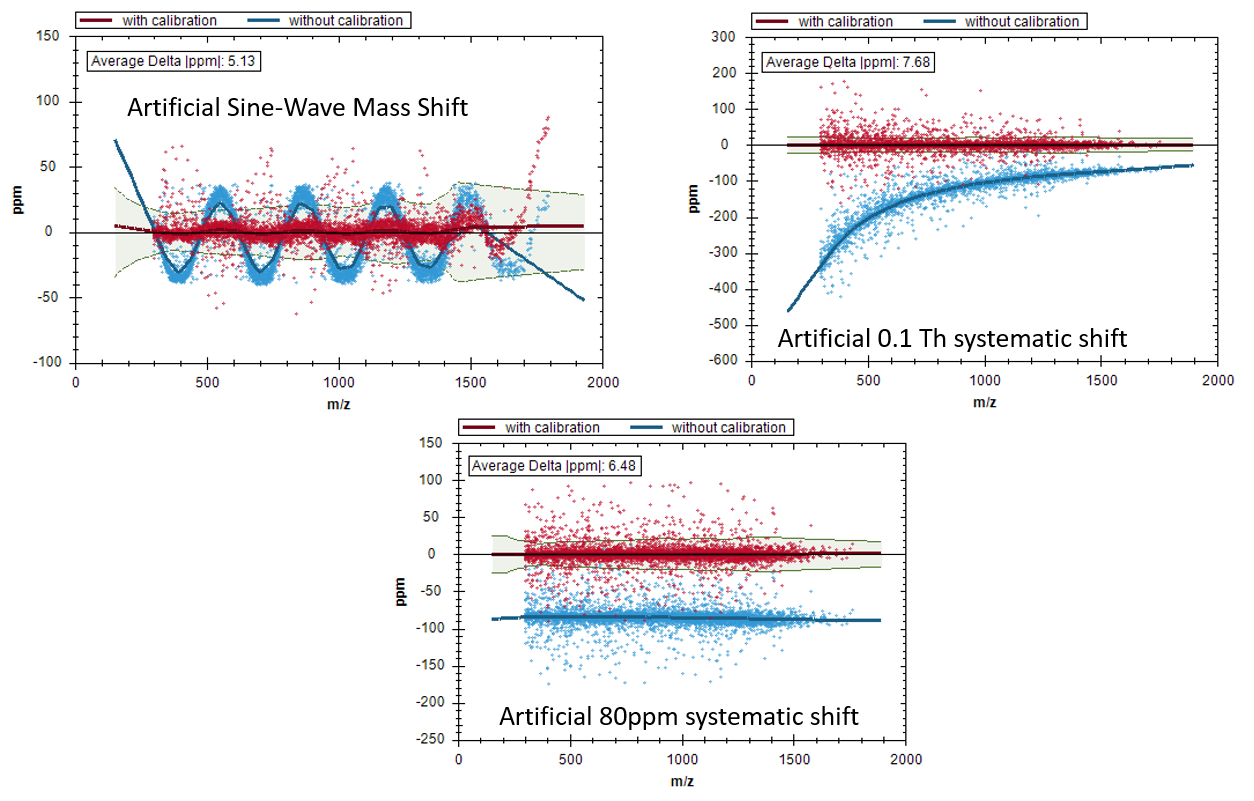
Challenging mass-shift patterns are usually not an issue for Spectronaut and we benchmark these kind of things very extensively with artificially introduced shifts (see screenshot).
Have a nice day
Oli |
|
| |
| Brendan MacLean responded: |
2018-08-02 11:03 |
Hi Oli,
Sure thing. No intention of casting aspersions. I think you are doing fantastic work on Spectronaut.
Many caveats I should have mentioned:
- It has been a couple years since I looked at these data sets (from Bruker).
- I am no expert at using Spectronaut.
- My comparison was purely based on detection counts (at 1% FDR), which was the chosen metric and started with a question about why Skyline had such low ID counts.
What I ended up finding was that for one of the data sets Bruker had given me data files lacking their own recalibration information. Once I got that dataset calibrated by Bruker, the detection counts for Skyline became quite similar to Spectronaut as expected based the Navarro, Nature Biotech 2016 paper. But, it also seemed to me that Spectronaut was ignoring the Bruker m/z calibration information, preferring its own recalibration, based on what I saw in your m/z recalibration plots (like the ones you attached). Using the Bruker API, I had to turn off using Bruker supplied calibration information in one of the data sets to see the same initial m/z pattern as reported by Spectronaut.
In this data set, where detection counts were fairly poor no matter what we did, and which Bruker discounted as not a great data set, the Spectronaut detections were noticeably lower than for Skyline. I have to admit I probably jumped to the conclusion that it was related m/z recalibration, where Skyline was just using Bruker reported values and Spectronaut seemed to be doing its own. Could easily have been any number of other things. I was just accepting the settings as used by the person who gave me the data (not allowing for your own expertise with your software, as in the Navarro paper).
I have attached some PowerPoint slides detailing what I saw during this investigation. Spectronaut m/z recalibration did seem to work quite well for the higher quality data set.
--Brendan
|
|
| |
| bernhardt responded: |
2018-08-02 12:52 |
Hey Brendan
No worry, no hurt feelings here :). I was just curios about the nature of that dataset. Based on the slides I can see that is indeed a quite challanging dataset. I would however still like to get my hands on it. Could you provide me with that file and the library you used?
Do you recal by any chance what version of Spectronaut you where using? I would assume it was version 7 which was also the one used in the Navarro paper.
Have a nice day and greetings from Zurich :)
Oli
|
| |
|
|
 calibration.PNG