| Training a peak scoring model with a large-scale of DIA | lihaikuo | 2018-04-29 00:53 | |||||||||||||||||||||||||||||||||||||||||||
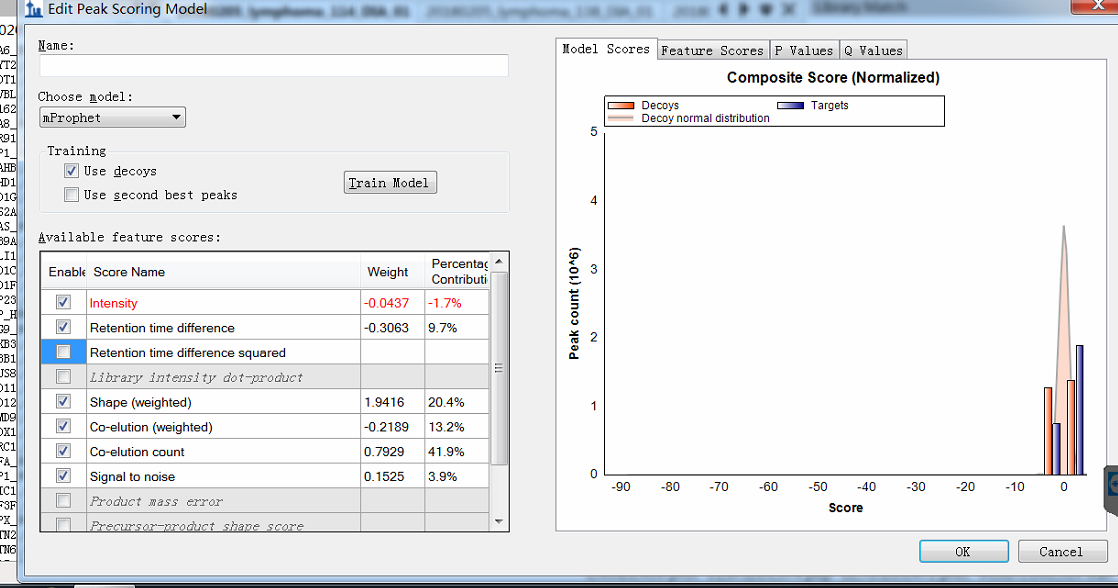
Hi, when I do the procedure (reintegrate--add--train) and want to edit the peak scoring model, I get the figure shown in the attachment. You see, I can not see the detailed distribution. The horizontal coordinate is too large, and I can not distinguish targets from decoys. This is my question. Maybe it is due to that there exists some targets or decoys with a very low score? If so, how can I delete these targets? Here, there are more than 200 DIA raw data imported and more than 200,000 transitions. |
|||||||||||||||||||||||||||||||||||||||||||||
| |||||||||||||||||||||||||||||||||||||||||||||
 peak_train.png
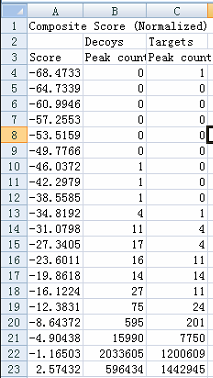 model score data.png
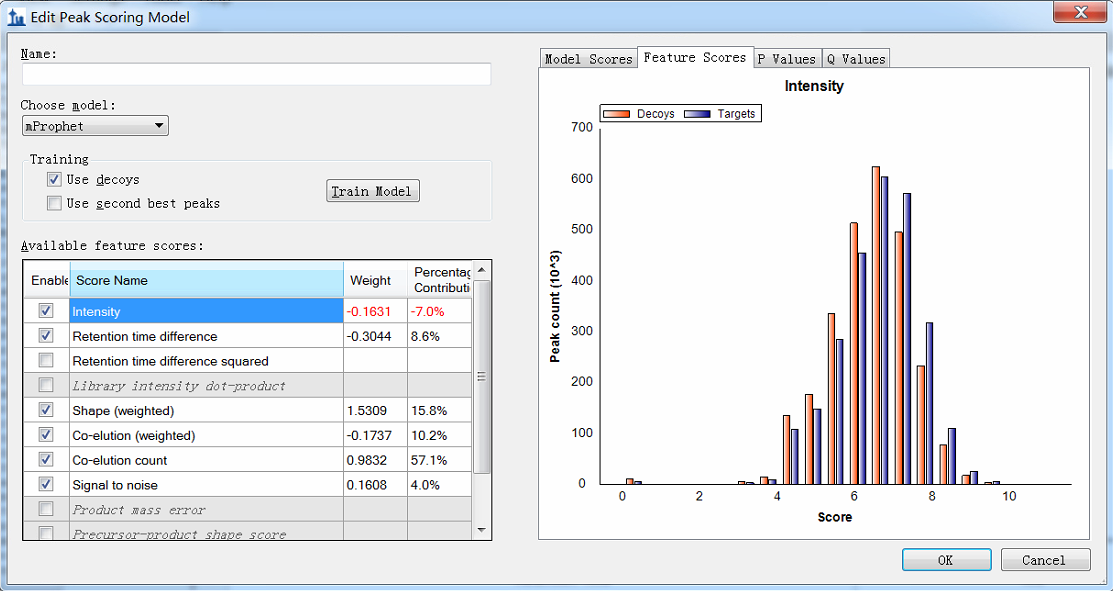 intensity.png
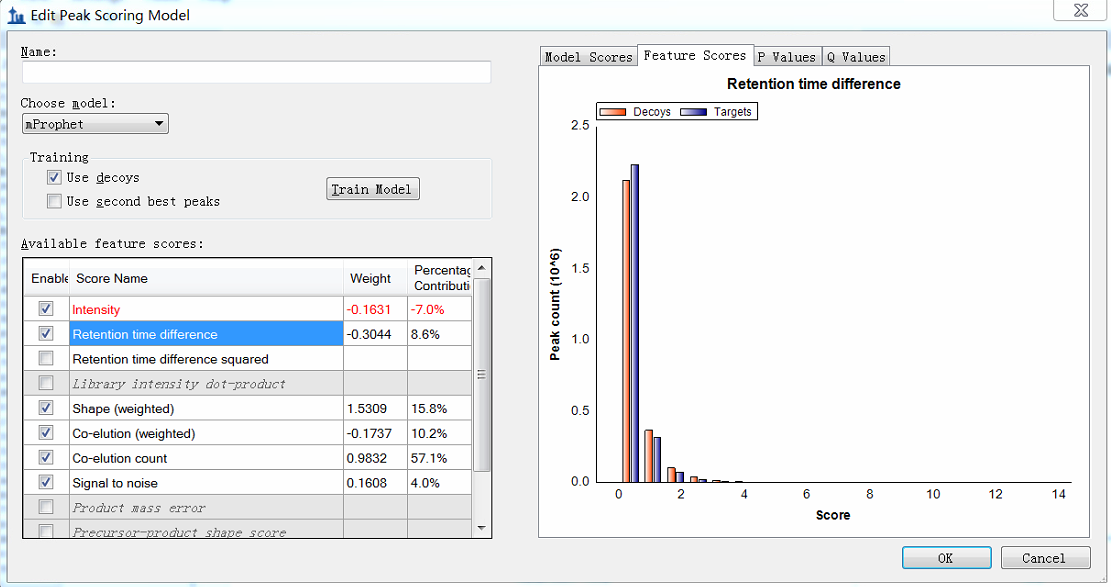 RT difference.png
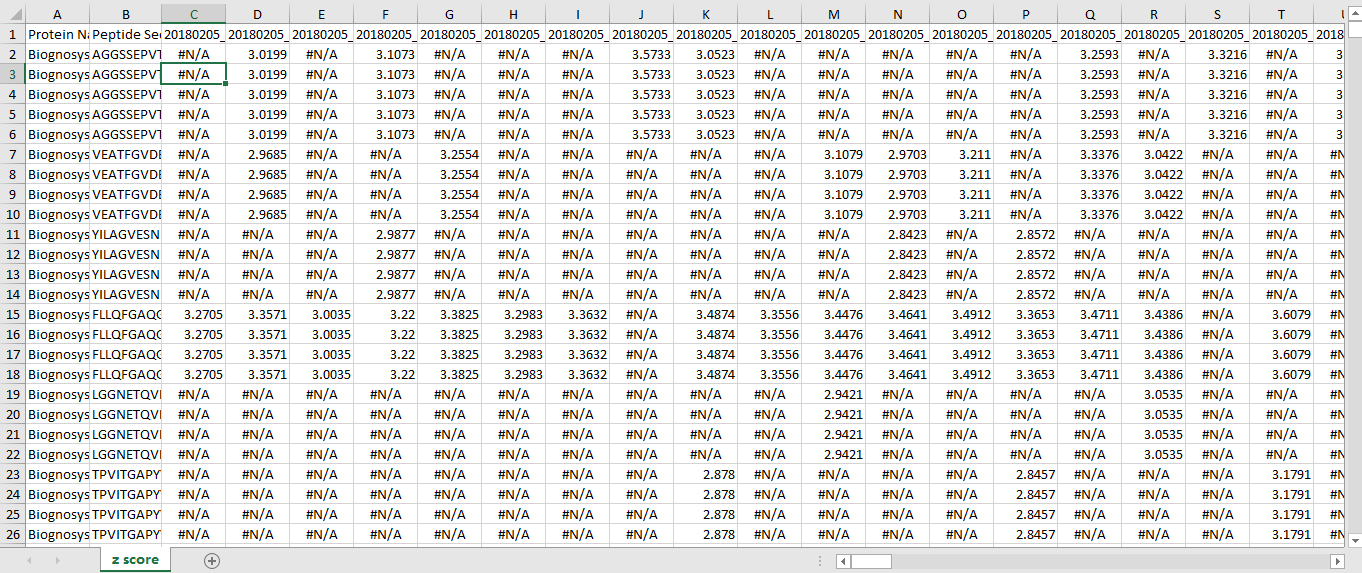 z score.png