| choosing the best trendline option for biological data | VJ | 2018-04-25 04:23 |
This question is not directly related to Skyline. I've analyze the data and now just playing it with.
I have not advanced mathematical skills to find a solution, hence thought to ask you all.I see MS Excel has several trend-line options; linear, logarithmic, polynomial, exponential, and power functions.
What is basis/logic for selecting these functions for biological data.
For e.g. I'm interested in understanding the change of peak area of protein vs different time course; my data fitting with polynomial trend-line.
how can I compare different samples in this option?if Excel is not a good option, how can I do this in R? |
||
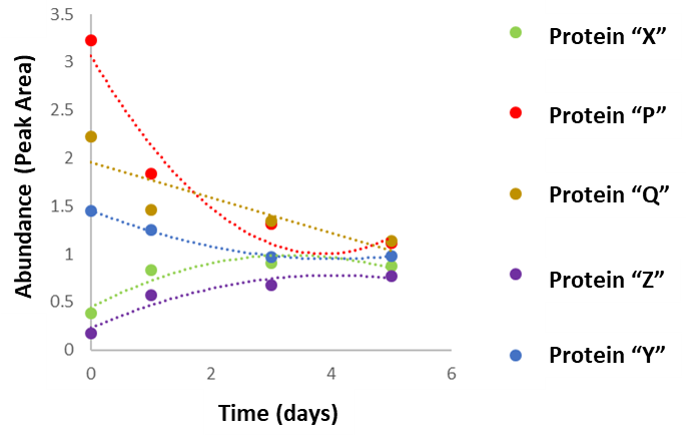 PvT.png