| Nick Shulman responded: |
2018-03-28 10:08 |
Yes, it looks like Skyline is calculating the LOQ incorrectly.
Could you send me your Skyline document?
In Skyline, you can use the menu item:
File > Share > (complete)
to create a .zip file containing your Skyline document and supporting files including extracted chromatograms.
If that .zip file is less than 50MB then you can attach it to this support request.
Otherwise, you can upload it here:
https://skyline.ms/files.url |
| |
| Sarah Michaud responded: |
2018-03-28 10:24 |
Ok, I uploaded it to the link. The file is named "20180312_RBC_Curve.sky.zip". |
| |
| Nick Shulman responded: |
2018-03-28 10:40 |
Thank you for sending me those files.
I had a typo in my code-- I was supposed to be multiplying by 100 to convert the percent, but I was only multiplying by 10.
I will fix this in the next update of Skyline-Daily.
(With the current Skyline-Daily, if you set the Max LOQ bias to 2% instead of 20%, you can verify that you would get the correct results).
Thank you for reporting this bug. Would it be ok if I used some of the dataset that you just sent me to write a unit test for Skyline to make sure that this bug does not happen again? |
| |
| Sarah Michaud responded: |
2018-03-28 10:50 |
Thanks for the support, and glad it's an easy fix. This is a feature I'm really excited to start using! And yes, you are welcome to use that dataset for testing.
Cheers
Sarah |
| |
| Sarah Michaud responded: |
2018-03-28 14:31 |
I have a second question related to the LOQ calculations - for the bilinear regression, is any weighting used for the linear section of the calibration curve (after the turning point)? Or should I also set a regression weighting in the Quantification tab?
I've noticed that many of my curves have an LOQ equal to the highest standard when I use bilinear regression AND 1/x^2 weighting. With no weighting, the LOQ is lower but often I have to exclude the high concentration standards as well (as I would expect for an unweighted curve). I attached some more example screenshots from my last dataset.
Thanks again |
|
| |
| Nick Shulman responded: |
2018-03-30 16:56 |
That curve actually looks correct, given the weighting of the points that you have specified.
With the 1/x^2 weighting, the lower points are weighted millions of times more than the higher points.
For this reason, the best fit line goes horizontally with a y-value of .003, until it gets to the X-coordinate of 185, at which point it veers upwards, precisely going through your standards at 200, and ignoring your standards at 20000 which are weighted so little.
(I noticed that there are some problems with the way that Skyline draws the bilinear graph if you zoom in too much. I have fixed that on my computer, but on your version of Skyline, that it might look like the bilinear graph is composed of three straight line segments.)
I could imagine that maybe Skyline should be do something different about weighting with the bilinear fit, but I do not know what that would be. |
|
| |
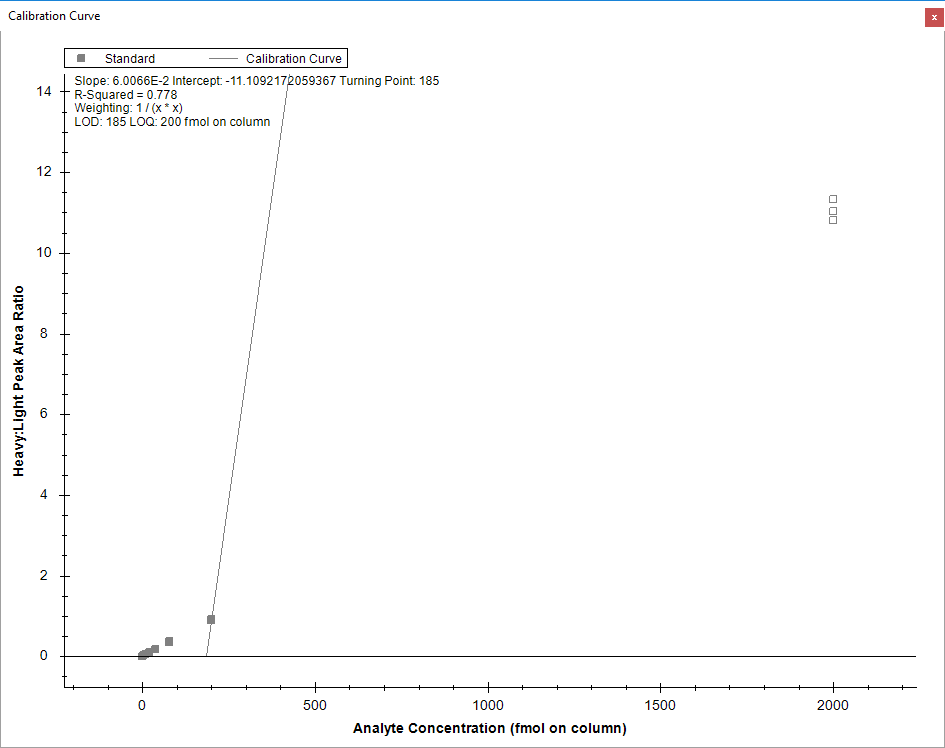 WeightedBilinearCurve.png
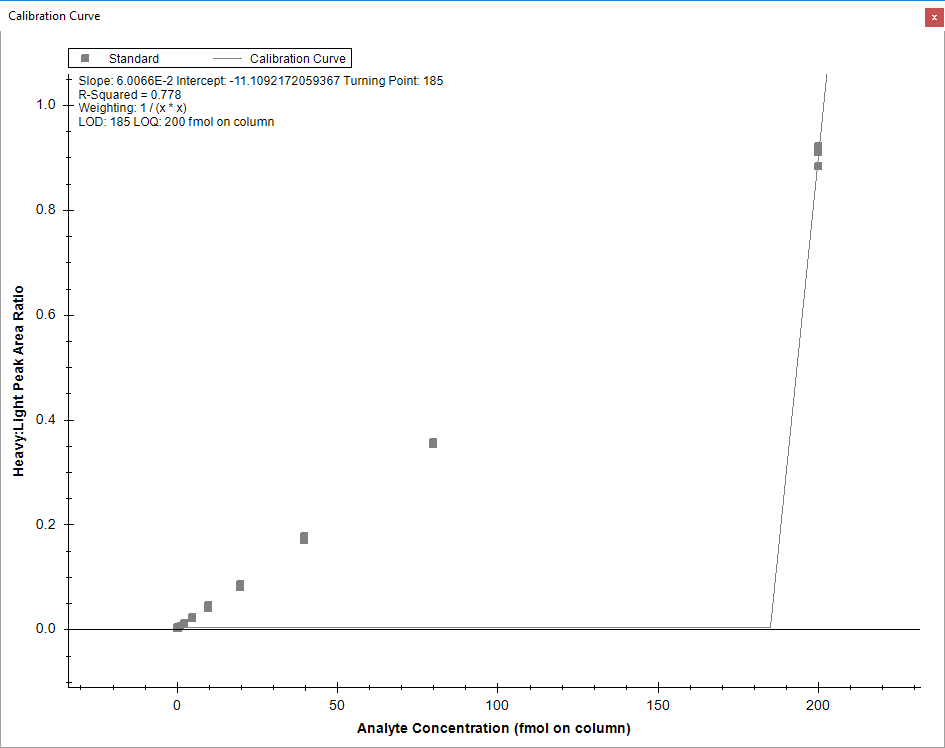 WeightedBilinearZoomed.png