Hey Skyline team,
I'm running a DIA workflow and have >150k peptides in my spectral library. I am using Skyline 4.1.0.11717. I want to employ the mProphet reintegration to filter for well identified peptides. When setting up the reintegration model, several key metrics are grayed out as not 100% of the peptides have values in that metric. Now, I understand that the mProphet model cannot deal with missing values, so one has to exclude them. To loose 1k peptides in a panel of 150 is no issue. The thing is just that I only know one way to delete them: click on the binoculars of each grayed out feature score, double click on each peptide in the "Find Result" list, press delete and repeat until the list is finished.
I can do that for 20 peptides, but not for >1k peptides?! Is there any way to do that quicker?
Is edit -> refine -> advanced the right place for that? I can't find an option.
I believe this issue became a problem when switching to 4.1. Before that, the mProphet model seemed to be more robust/applicable to more peptides? But maybe I just have a wrong setting somewhere. The library intensity dot product for instance seems only to be calculated, when more than 2 transitions are available. I've found the new feature in transition settings -> library -> pick minimum product ions, but that is just for the selection of the library, not in the DIA data, right? There seem to be peptides that just miss some transitions due to random / noisy data, which then then screws up the whole mProphet model? That seems quite drastic. Am I missing a setting here?
Furthermore, it would be tremendously helpful if you could give me some rule of thumb on the expected number of identified peptides. With an unfractionated library of 40k peptides, I can identify about 12k peptides at a qvalue < 0.01. Is that expected? I found one statement by George Rosenberger for openSWATH, that he identifies 70-80% of all peptides of an unfractionated spectral library.
I know, there are a million reasons, why my number might be low, but some ballpark figure could help me to gauge my analysis. In most papers, I find the number of positively identified peptides, but not the size of the spectral library. That seems to be kind of crucial... In the Navarro paper, you get >30k peptides, but that is from a deep fractionated spectral library. With my 150k library and current limited features in the mProphet model, I get next to no peptide to pass the qvalue<0.01 threshold.
My DIA run was over a 90min gradient on a Q-Exactive.
Thanks for all the hard work. I can't imagine how much work it must entail to build something like skyline...
Best,
Phillip |
| |
| Nick Shulman responded: |
2018-02-19 12:07 |
The missing transition peak area problem might be caused by not having:
Settings > Integrate All
turned on.
When "Integrate All" is turned off, Skyline will not provide a peak area for transitions whose peaks are slightly off-center from the other transitions in the peptide. The purpose of this is to make it easy to find bad transitions during method development in an SRM experiment, but you want to have "Integrate All" turned on if you are doing any sort of quantitative experiment.
(We are going to make "Integrate All" less confusing in the next version of Skyline.)
I am not sure about the answer to the other parts of your question. It might help if you sent us your Skyline document.
In Skyline, you can use the menu item:
File > Share > (complete)
to create a .zip file containing your Skyline document and supporting files including extracted chromatograms and spectral libraries.
You can upload that .zip file here:
https://skyline.ms/files.url |
| |
| phillip ihmor responded: |
2018-03-12 08:14 |
Hey Nick,
I'm back with more questions :P
Thanks for the "integrate all" hint, that did help. But there were still peptides with missing mProphet feature values (like "Library Dot Product"). Maybe they arise, when I change something in transition setting without re-importing the result. Anyways, I found a way to quickly delete those peptides with missing mProphet features using the document grid. I filtered for peptides that have blank values in the grayed-out mProphet feature, and exclude them from the analysis with the red X. Maybe that is something to add to the pdf of the mProphet webinar.
So far so good. Now I can run the mProphet analysis with all features, but the distribution of the decoys and targets are still not very different. Only ~10% of my peptides pass the 0.01 mProphet q-value cutoff. Could you have a look at my skyline file whether there are any obviously wrong settings? I have uploaded a file to your file sharing system named 40kPeps_EggertsonSettings.zip with the description "Ihmor - Low mProphet Scores". To make the upload / processing a bit quicker, I have reduced the Skyline file to the first 40k peptides of my 200k spectral library. The spectral library was obtained by fractionating my cell line 12x using basic pH RP-LC. When processing the full 200k spectral library, I get at best the same 10% = 20k peptides to pass the q-value cutoff. That is why, I was asking about the expected rate of accepted peptides. When using an unfractionated library of 35k peptides, I get about 15k peptides pass the q-value cutoff. That is still atypically low, right?
Generally, my Skyline settings are based on your Egertson2015 NatProtocols publication and we are using a Q-Exactive HF-X system.
As this is my first DIA project, I don't have a good reference to compare against / don't know may quantified peptides I should expect. There are many factors to change, and I don't know where to start. I have found several published Skyline DIA settings, so I understant that there can't be a one-size-fits-all solution. Could you still look at my file and check for obvious errors? I have also uploaded a file called "40kpep_Top4.sky", where I changed transition settings to select the 4 highest ranked product ion in the library spectrum. But that has the same 10% mProphet pass rate. Do you know, why the Egertson2015 paper does not select the Top1 and Top2 product ions?
The only parameter left, I think about adjusting are the following:
- Increase the RT window:
peptide -> prediction -> time window: 5min or 10min
Transition - Full-Scan -> Retention time filtering -> scans within X min of predicted RT: 5min or 10min
I don't understand what the difference is between these two values. Anyways, my LC seems to be stable, as my iRTs are only off by max 0.5min, most of them are 0.1min off.
- ion match tolerance:
- Library -> ion match tolerance -> 0.01 -> What is the correct setting here? the DIA samples were measured with 30k resolution in MS1 and 15k resolution in MS2. The DDA samples of the spectral library hat 60k MS1 resolution and 15k MS2 Resolution.
- Instrument -> method match tolerance -> I don't know understand how that is different from the previous mentioned Library -> ion match tolerance setting
- And then there are all the settings in Reintegrate -> advanced, that I haven't touched yet.
When looking at the percentage contribution of the mProphet features (see screenshot), the high weight for co-elution count and library dot product do sounds sensible. A good weight on mass error also sounds fine. But the rather low retention time difference weight look suspicious to me. Is it normal to have a low weight on intensity, shape and signal to noise?
When uploading my file to your server, I also came across the "you don't have privileges to this directory" error. Turns out, my file was already uploaded, and the error just meant that I don't have the right to override that file. But the error message got me confused. If you could make it more explicit, that would be great.
Thanks again for your support,
Phillip |
|
| |
| Nick Shulman responded: |
2018-03-12 10:09 |
I believe the peptide prediction time window only matters if you are exporting a method from Skyline (that is, Skyline needs to tell the mass spectrometer over what time range to collect data). I do not believe that it has any impact on peak picking.
The primary purpose of the retention time filtering option is to reduce the size of the chromatograms that Skyline extracts, in order to save space on disk. It also has the effect of constraining Skyline to choose a peak within that time range. I am not sure what effect that has on mProphet models.
Your library ion match tolerance looks fine. You would change that number if it looked like Skyline was being too strict, and not properly matching up the ions observed in the spectral library to actual transitions that could have come from the precursor.
Instrument method match tolerance only matters for SRM data-- it does not have any impact on DIA where Skyline is the one extracting chromatograms.
I cannot think of any way to improve your peak picking. Maybe someone else reading this will have some ideas.
One thing I can now point you at is another tool called EncyclopeDIA which has newly been release and comes out of the MacCoss Lab. It is a slightly different approach to searching DIA data, and has several algorithms that we hope to incorporate into Skyline in the future.
Here's the paper on it:
https://www.biorxiv.org/content/early/2018/03/07/277822
And here's the BitBucket page:
https://bitbucket.org/searleb/encyclopedia/wiki/Home |
| |
| phillip ihmor responded: |
2018-03-13 01:11 |
Thanks for the explanations, Nick. And for the hint at EncyclopeDIA, I will look into that paper.
Best,
Phillip |
| |
| zainab noor responded: |
2018-08-03 00:47 |
Hi Philip,
While I was going through the questions related to the peak picking and mProphet model, I came across this thread where I found the same issue as I am facing right now. I have ~25K target peptides and the same number of decoys, and I can run the mProphet analysis with all features, but the distribution of the decoys and targets are not very different. Only a small number of peptides pass the 0.01 mProphet q-value cutoff.
I was wondering did you find the solution for that? Or what's your analysis/conclusion on that? Did you use any other method to calculate q- values for targets?
Best regards,
Zainab |
| |
| Brendan MacLean responded: |
2018-08-03 09:40 |
Hi Zainab,
Could you post a screenshot of you model, as Philip did?
Are all of the scores enabled?
—Brendan |
| |
| zainab noor responded: |
2018-08-05 17:56 |
Hi Brenden,
Thanks for your response. Apologies for late reply. The screenshot is attached here. Last three scores are not enabled.
Best regards,
Zainab |
|
| |
| Brendan MacLean responded: |
2018-08-05 20:09 |
I guess I would be looking at why your retention time prediction appears to be adding no value. If it is really that bad, you may not even be capturing the right peaks in your extracted chromatograms.
You probably want to look at View > Retention Times > Regression > Score to Run.
What kind of retention time settings do you have? Did you train iRT values on your system? Are you getting iRTs from someone else?
I guess next send screenshots of Transition Settings - Full-Scan tab, Peptide Settings - Prediction tab, and View > Retention Times > Regression > Score to Run for your iRT calculator, if you have one.
Or you could also upload your entire document using File > Share - Complete to get a .sky.zip file to:
http://skyline.ms/files.url
It is very unusual to see so much weight given to the intensity score and so little given to the retention time scores.
Thanks for the screenshot.
--Brendan |
| |
| zainab noor responded: |
2018-08-06 00:14 |
Hi Brendan,
This data doesn't have iRT peptides so I am using SSRCalc using 16 endogenous peptides (randomly selected from the same experiment spanning entire retention time range). I am having a nice Score to Run regression graph (attached here). One thing which I am seeing disturbing is the Time Window. What does Time Window mean in Edit Retention Time Predictor? Should it be the same as 'Using only scans within (5 min) of predicted RTs'? As you can see in the attached regression graph, regression has a window of 12.7 and predictor has a window of 25 (25 min value came in after the generation of the calibration curve in Edit predictor and I didn't change it), what does difference in these values mean?
Thanks.
Best,
Zainab |
|
| |
|
|
 2018-02-19 2 transitions lead to missing dotp.png
 2018-02-19 search for peptides with missing features.png
 low mProphet Score.PNG
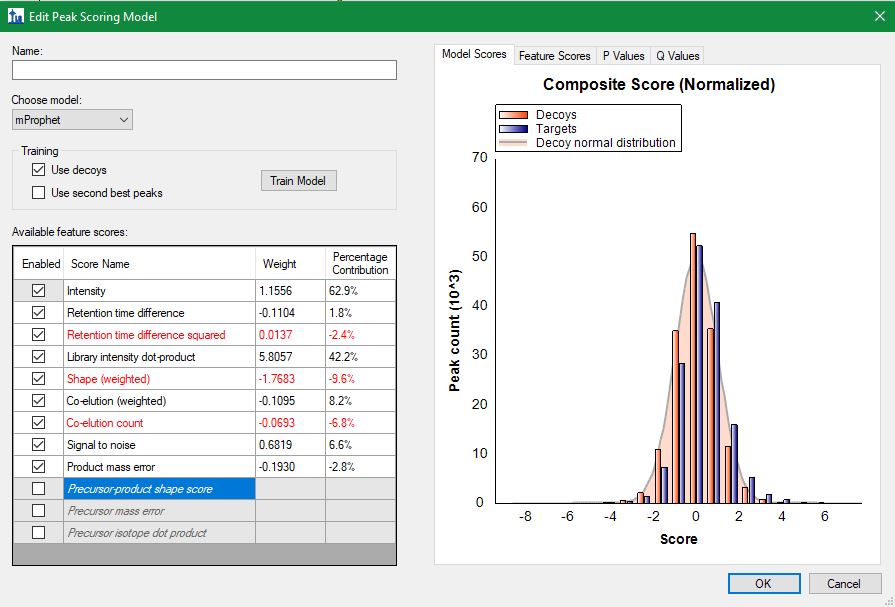 mProphet-model.JPG
 Score-to-Run-graph.JPG
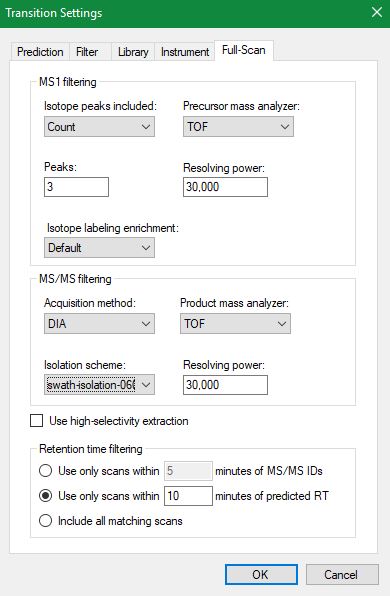 full-scan-settings.JPG
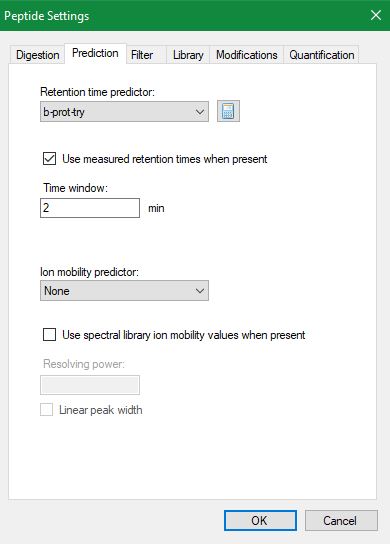 prediction-tab.JPG