| Reporting raw chromatograms for downstream processing | scurran | 2018-01-29 10:54 | |||||||||||||||||||||||
Dear Skyline Support, I like working with my traces in a downstream processing platform such as Python or Excel. I like the freedom to customize my graphs and etc. One *slow* way to do this is to manually copy the trace data for each transition (MRM) and paste into a .csv file. I would prefer an automated way to do this. I would like to make a report that has my peptide name, the replicate, and the data for the trace (time and intensity). There is an option for this under Reports, but the output does not have the trace data (see attached image). Am I confused? Is there an easy way to do this? Thank you, Sam |
|||||||||||||||||||||||||
| |||||||||||||||||||||||||
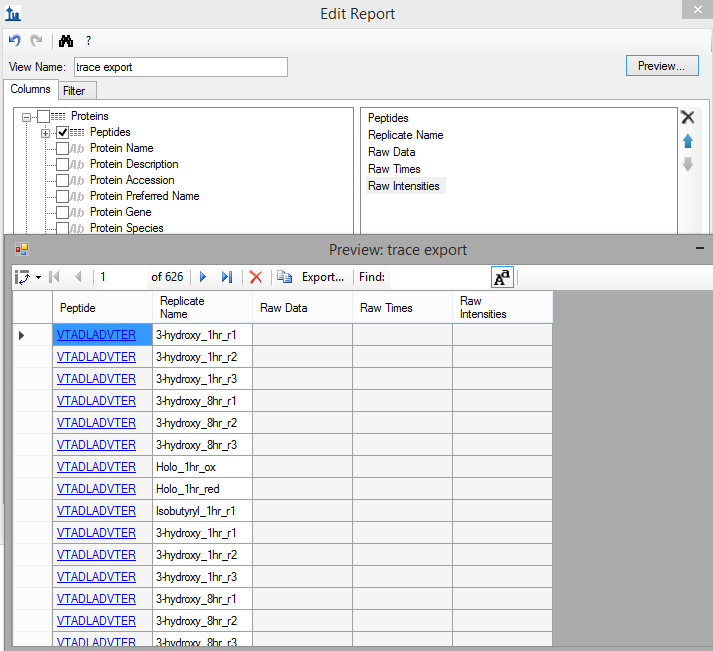 trace report.png
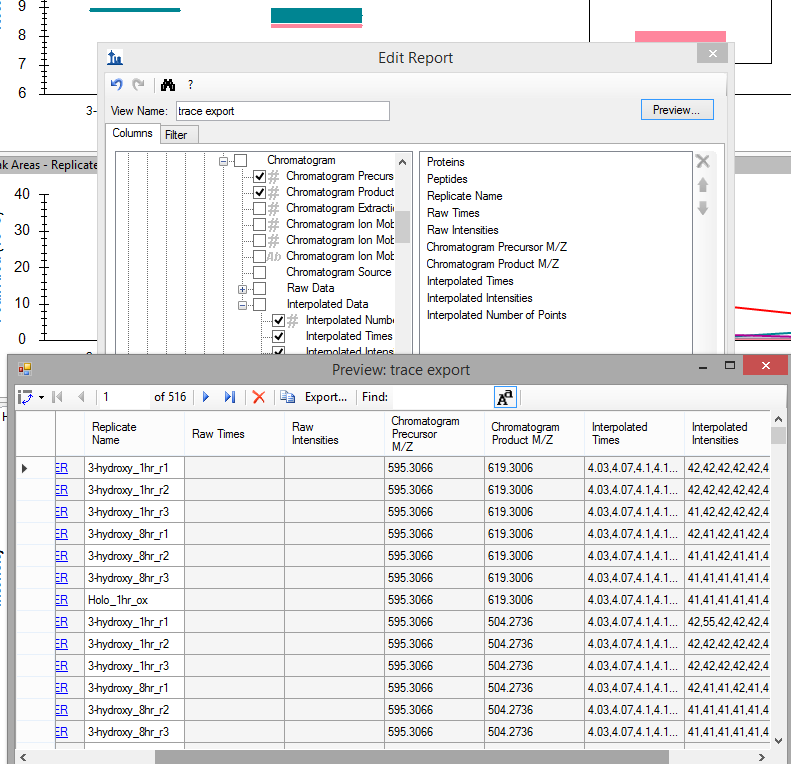 trace report.png