| Nick Shulman responded: |
2017-12-11 11:36 |
I would have expected that what you said you tried where you specified a precursor m/z that was somewhere within the SWATH window should have worked.
Can you send us your Skyline document and .raw file so we can take a look?
In Skyline, you can use the menu item:
File > Share > (Complete)
to create a .zip file containing your Skyline document and supporting files including extracted chromatograms.
You can upload that .zip file and one or more of your .raw files here:
https://skyline.ms/files.url |
| |
| lparsons responded: |
2017-12-11 11:53 |
Nick
I just uploaded the .sky.zip file and the raw file as well. In this file the product m/z is calculated from the observed SIM (MS1) ion of interest. If I were to import only a transition list of the MS1 ions into Skyline it will draw chromatograms for me. In this case I am looking for a specific mass loss from the parent to the product so the calculated m/z reflects this.
I did another skyline project where I used only observed product m/z values and the result was the same.
thank you
Lee |
| |
| Nick Shulman responded: |
2017-12-11 12:07 |
Thank you for sending those files.
When I look at your full scan settings:
Settings > Transition Settings > Full Scan
I see that you have "MS/MS filtering Acquisition method" set to "None".
I believe that what you want to do is set the Acquisition method to "DIA" and set the Isolation scheme to something like "Results only".
(You probably also want to set the MS1 filtering Isotope peaks included to "None" since you don't care about precursors) |
| |
| lparsons responded: |
2017-12-12 07:37 |
Thank you Nick that looks great!
I have one other thing I'm trying to do with this data that I am hoping Skyline can accommodate. Since I have specified a parent m/z and a product m/z (actually several product m/z values) and the chromatograms are being drawn and displayed for the products can I also get Skyline to draw the chromatograms for the parents? Ideally I would like to be able to display them together so I can see if the product chromatogram lines up well with the parent chromatogram.
thank you
Lee |
| |
| Nick Shulman responded: |
2017-12-12 12:04 |
Are you asking whether you can get Skyline to display your SIM chromatograms?
I see that your .raw file has ten SIM SIC chromatograms with m/z ranging from 280.53885 to 415.53885
When you import results from a .raw file, Skyline looks at your Transition Full Scan settings. If MS1 filtering of MS/MS filtering is enabled, then Skyline ignores the chromatograms that are in the file, and extracts XIC chromatograms from the spectra.
If neither MS1 filtering nor MS/MS filtering is enabled, then Skyline reads all of the SIC chromatograms that are in the .raw file and puts them in the .skyd file.
If you want to get both the XIC and SIC in the same Skyline document, then you have to trick Skyline into importing the same .raw file twice, and in between those two imports, you need to change your Transition Full Scan settings.
The way that you trick Skyline into importing the same .raw file twice is to copy the .raw file to a new name or a new folder on your computer, and tell Skyline to import that.
I am not sure that I understood your question, however. In the .raw file that you sent me, the SIC chromatograms had precursors that were different from the isolation windows of your DIA windows. |
| |
| lparsons responded: |
2017-12-12 13:00 |
Nick
Thank you for getting back to me. What I would like to do at this stage - after already having had Skyline draw chromatograms of MSMS ions - is to have Skyline draw chromatograms of MS1 ions. In other words, I have my MSMS ions - and each one of interest has had a chromatogram drawn for it - and now I want to draw chromatograms of specific MS1 ions that I want to examine as being possible parents of these MSMS product ions.
Hence if I had a product whose MSMS m/z was 400, and I thought there was a relevant MS1 parent ion with an m/z of 555, I now want to draw the chromatogram of 555 and then compare it to the chromatogram I already have for 400.
You correctly observed that the DIA windows are different from the SIM windows, and this is by design as we are looking for neutral loss products. If our SIM window is 330:360, the part of the DIA window that we are most interested in will be essentially (330:360)-(neutral mass).
thank you
Lee |
| |
| Nick Shulman responded: |
2017-12-12 13:57 |
If you want Skyline to extract additional ions, you should add those ions to your document (via Edit > Insert > Transition List or some other way) and then do a reimport in:
Edit > Manage Results > Reimport
It sounds like you might be asking how to change the m/z of the parent ion of a molecule. I do not believe there is a way to do this. You should just insert another transition list that has the different parent ion.
I am not sure that I understand your question. |
| |
| lparsons responded: |
2017-12-12 14:13 |
Nick
It may be that I am just not seeing correctly what skyline is doing with my input and input data then. When I put in the transition list and then imported the raw file, the only chromatograms that I see drawn by skyline are for the MSMS ions. I can click on a parent ion but all that is displayed are the chromatograms for MSMS ions that I listed in my transition list as being products for that ion. For example if I had put in the transition list that I should have a parent of 500 and a product of 400, clicking on 500 (in the left-hand list of Targets) will show me chromatograms for something like 400.1111, 400.1222, 400.1333 all overlaid on each other. I want to add the MS1 chromatographic trace to this same figure.
What I'm trying to do is similar to figure 3 from this paper:
https://www.ncbi.nlm.nih.gov/pubmed/28977750
Where the chromatograms of MS1 ions are compared to chromatograms of MSMS ions. If they can't be drawn in the same figure that is fine, but ideally I would like to be able to overlay them to show their correlation in time.
thank you!
Lee |
| |
| Nick Shulman responded: |
2017-12-12 14:38 |
Skyline cannot see any of the SIM scans that are in your .raw file.
I can see those scans if I look at the .raw file using the QualBrowser, but I don't see those spectra if I use MSconvert to convert the .raw file to .mzML.
This sounds like it might be a problem with the ProteoWizard code that Skyline uses to read .raw files. I will ask around and see whether we can fix this. |
| |
| lparsons responded: |
2017-12-12 17:11 |
Nick
I think Matt Chambers helped me solve this problem with SIM data before. The "--simAsSpectra" switch for msconvert.exe allowed the generation of mzML files with useful MS1 data from these Thermo SWATH-like raw files. I have an mzML file that was generated this way, I can try loading it into Skyline and see if it produces the expected MS1 spectra.
thank you
Lee |
| |
| Brendan MacLean responded: |
2017-12-12 17:19 |
Note that Skyline always uses simAsSpectra. You are probably right about this being the reason Nick isn't seeing the spectra with ProteoWizard tools like msconvert, but that shouldn't mean Skyline would have the same problem.
I'll leave Nick to work out the details, because I am currently traveling.
Thanks for pointing out the simAsSpectra option.
--Brendan |
| |
| lparsons responded: |
2017-12-14 08:38 |
I have used msconvert with the "--simAsSpectra" option to create a new mzML file from my Thermo raw SWATH-like data. I have imported this new mzML file into Skyline but I still am not seeing spectra or chromatograms of the MS1 ions, I see only the spectra of the MSMS ions.
Could there be a display setting that I have wrong that is causing this? In the targets panel I see green dots next to both the parent and product ions, but if I click the parent ion I see only the product ion spectra displayed in the other panel. I see this behavior in both the raw file that I imported already as well as the mzML that I added (which based on Brendan's comment on the use of --simAsSpectra seems like it should be the expected behavior here).
thank you
Lee |
| |
| Brendan MacLean responded: |
2017-12-14 09:01 |
Hi Lee,
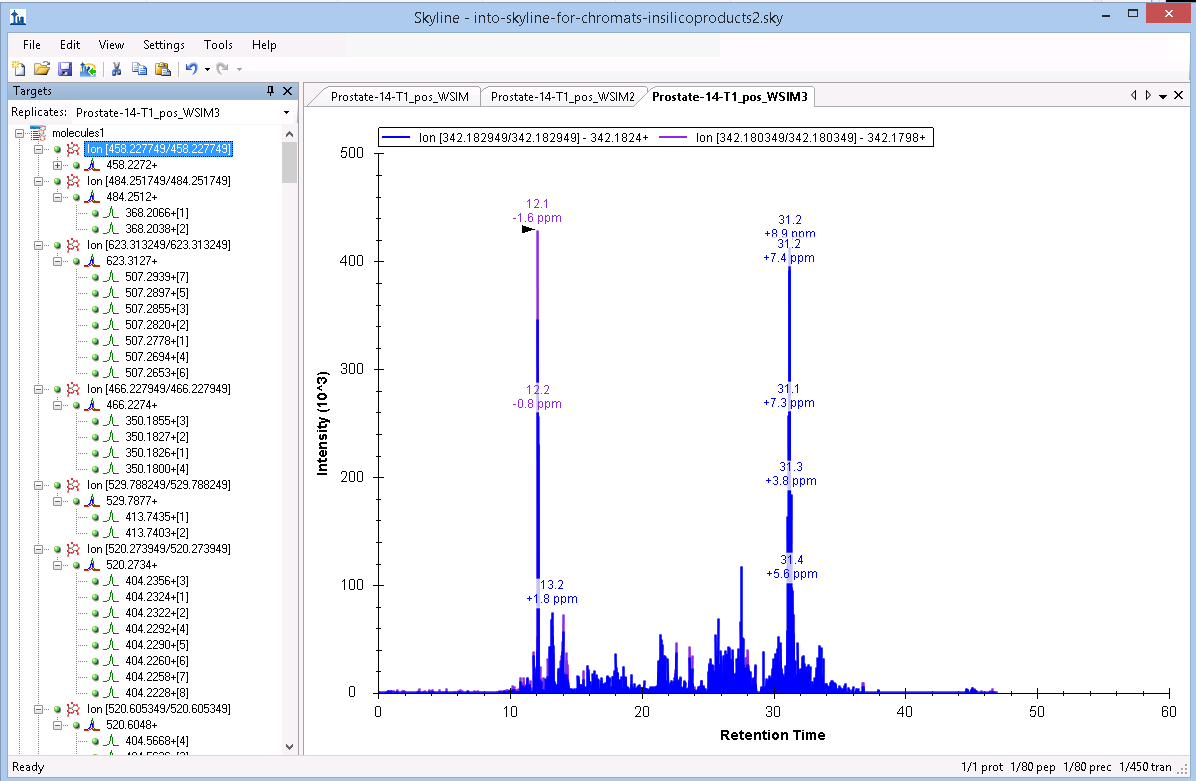
I haven't seen the document you sent Nick. Can you post a screenshot of what you are seeing in the Targets view and one of your Transition Settings - Full-Scan and Filter tabs? That should be enough for me to check your settings.
As noted, I wouldn't have expected using msconvert with --simAsSpectra to be any different from importing the data from raw data files, since Skyline itself always uses --simAsSpectra when accessing raw data. Only if you had already been using mzML that you converted without using --simAsSpectra would this have made a difference.
Thanks for working with us to diagnose the problem.
--Brendan |
| |
| lparsons responded: |
2017-12-14 09:13 |
Brendan
Thank you for getting back to me. Hopefully these three images are what you requested.
I noticed you stated that you didn't expect the --simAsSpectra file to make a difference, but I figured there would be no harm in trying - and as I said I would try it I wanted to make sure I did not leave that stone unturned.
thank you
Lee |
|
| |
| Brendan MacLean responded: |
2017-12-14 10:46 |
Hi Lee,
Wow. Big surprise for me: you are working with small molecule targets.
First, you should switch to using Skyline-daily. A lot has changed for small molecules between the 3.7 release and now. We are planning on making the next public release of Skyline with all these improvements in early January. Until then, you really want to be using Skyline-daily for anything at all adventurous involving small molecules.
Once you are on Skyline-daily, you will find a "Small Molecules" tab on the Transition Settings - Filter tab. And you will see that it contains its own "Ion types" field, which contains by default "f". To get precursor targets for small molecules, you will need to make this "f, p".
I have also asked Brian Pratt, our small molecule development lead, to work with you on any further issues you have on this thread. But, let's start with getting you on Skyline-daily and updating your "Ion types" to both "f, p".
Thanks for sending the screenshots. That was quite helpful.
--Brendan |
| |
| lparsons responded: |
2017-12-14 12:45 |
Thank you Brendan! (and welcome to the party Brian!)
Looking back I see that I neglected to specifically mention that this is a small molecule project, I apologize for the omission. I've been working with OpenMS and ProteoWizard people on some other bits that relate to this, which may be why I had overlooked mentioning it here. I recall you helped me with some peptide work in Skyline before - including some where I treated peptide precursors as if they were small molecules rather than peptides.
I have now downloaded skyline-daily and set it up. However I still seem to be having a hard time finding MS1 ion chromatograms. I have some cases where the MS1 ion - along with the MSMS ions - are coming in with a green dot but yet I still can't find the trace for the MS1 ion. If I right click on the display window, click Transitions, and then select "Precursors" (while I normally have it set to "All"), I get an empty display. This is the case regardless of whether the color next to the precursor (in the Targets pane) is red, orange, or green.
One display behavior that I can't find a setting for is how the chromatograms themselves are drawn. Right now if I look at the chromatogram of a product ion I see a trace that is formed by connecting the peaks (across time). At one point I had it displaying the actual peaks at each time point, I can't find what setting I changed that change this or how to change it back.
thank you!
Lee |
| |
| Brendan MacLean responded: |
2017-12-14 18:46 |
Need more pictures. Not sure I am following you. |
| |
| lparsons responded: |
2017-12-15 08:35 |
Brendan
Attached please find an image of the chromatograms drawn the way I tried to describe. Here we see a number of MSMS ions, each seemingly with 3 points in chromatographic time. This image shows the points connected, what I would prefer to see is the height of each peak as a peak (or as a vertical line). I believe I had it displaying that way before though I can't seem to find the setting that changed that.
thank you!
Lee |
|
| |
| Brendan MacLean responded: |
2017-12-15 09:22 |
I don't know of any way to get Skyline to display what you are requesting. Skyline always displays chromatograms as line graphs. You can, however, use right-click > Copy Data to get the points onto the clipboard and paste them into Excel to graph in another way, or you can export a custom report with the chromatogram points which you can graph in other programs like R.
But, you must be thinking of something else, if you feel you remember seeing Skyline graphing chromatograms as stick plots.
Thanks for the screenshot.
--Brendan |
| |
| lparsons responded: |
2017-12-15 10:51 |
Brendan
Sticks is not a great way to describe it, but I have managed to get Skyline to display some ions as a series of peaks that are not connected. In the attached file you can see that for this particular precursor ion we are seeing a series of peaks rather than a connected line - though still in chromatographic time.
I may well be misinterpreting what Skyline is trying to tell me with this, though. This precursor is labeled with a red dot in the Targets pane. The next precursor I have in the Targets pane - which also has a red dot - is rendered the other way in chromatographic time (if I zoom in on time I see a line instead of a series of peaks as the previous showed).
thank you,
Lee |
|
| |
| Brian Pratt responded: |
2017-12-15 11:01 |
I think that if you zoom in, you'll see that this is the same display style as always, but there is significant signal drop between the peaks. Most likely this indicates that the data isn't of the kind that you indicated to Skyline, or some other issue with reading the raw data.
Brian |
| |
| lparsons responded: |
2017-12-18 08:25 |
Brian
I zoomed in dramatically on that data - to the point where the marks on the x-axis represent less than .001 minutes - and if I'm between the peaks the signal appears to be zero, rather than a connection between peaks. In this experiment I see that behavior with one molecule (the 490.1946 that was in the previous image) but not another whose m/z is ~100 less than this. Also on the 490.1946 I see this with the precursor ion but the MSMS ion that I am tracking over the same time window behaves as expected on the graph with points connected by continuous lines.
That said, I also do see a very small but noticeable chromatographic shoulder (going forward in time) on the peaks of the 490.1946 precursor.
Thank you!
Lee |
| |
 skyline-targets-view.png
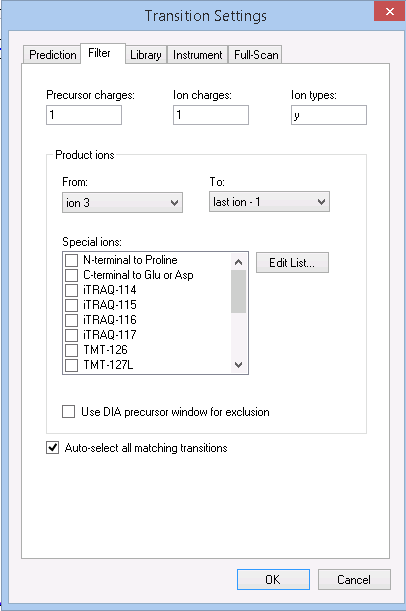 skyline-transition-filter.png
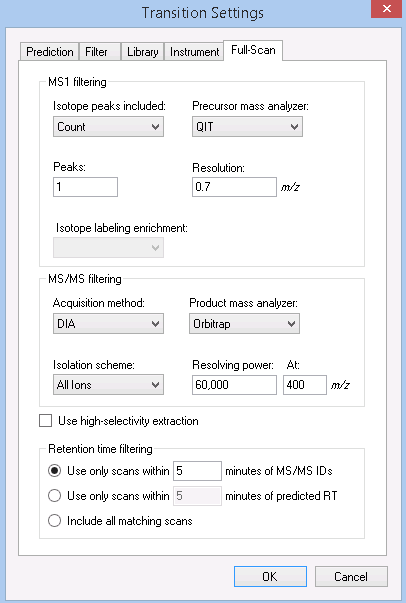 skyline-transition-fullscan.png
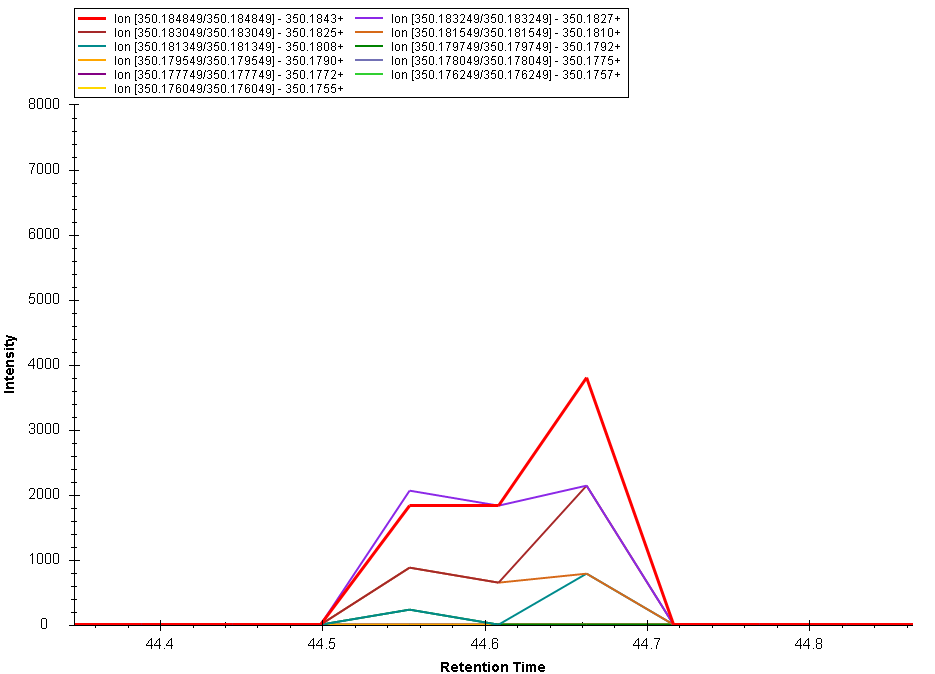 skyline-chromat-msms_ions.png
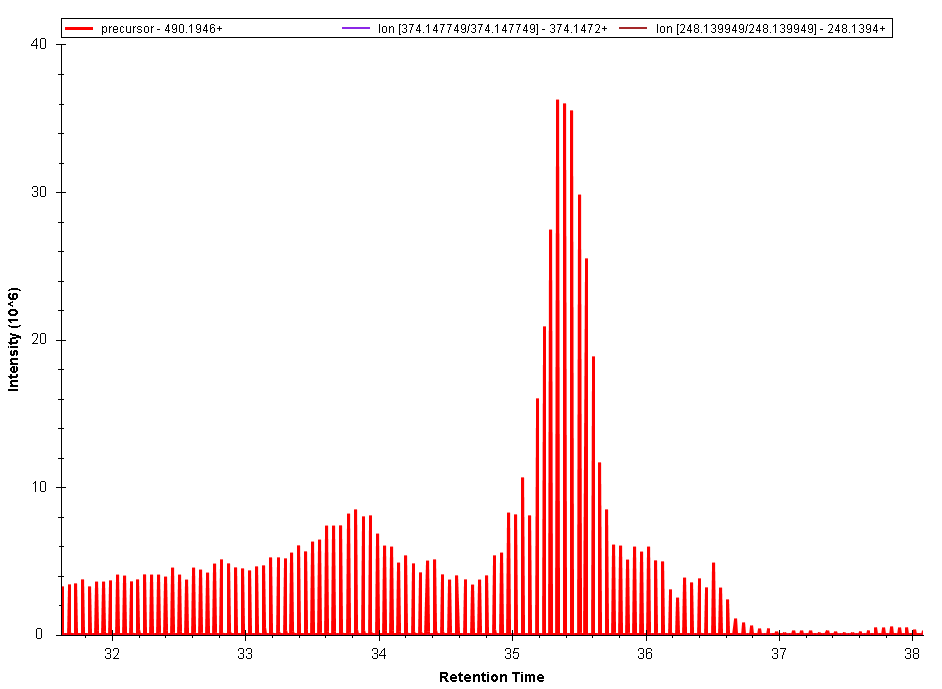 skyline-chromat-ms1_ion.png