| Feature request: show predicted retention times on replicate comparison plot | gabe | 2017-09-13 14:05 | |||||||||
Hi, forgive me if this is possible or has been requested before, but it would be very useful to be able to see the predicted retention time (and range) on the replicate comparison plots of Retention Times. See attached mock-up. Note that the quantified peak is at 12.9 minutes but the predicted RT is at 9.6 minutes. It would be useful to be-able to see this discrepancy in the replicate comparison plot. Thanks Gabe |
|||||||||||
| |||||||||||
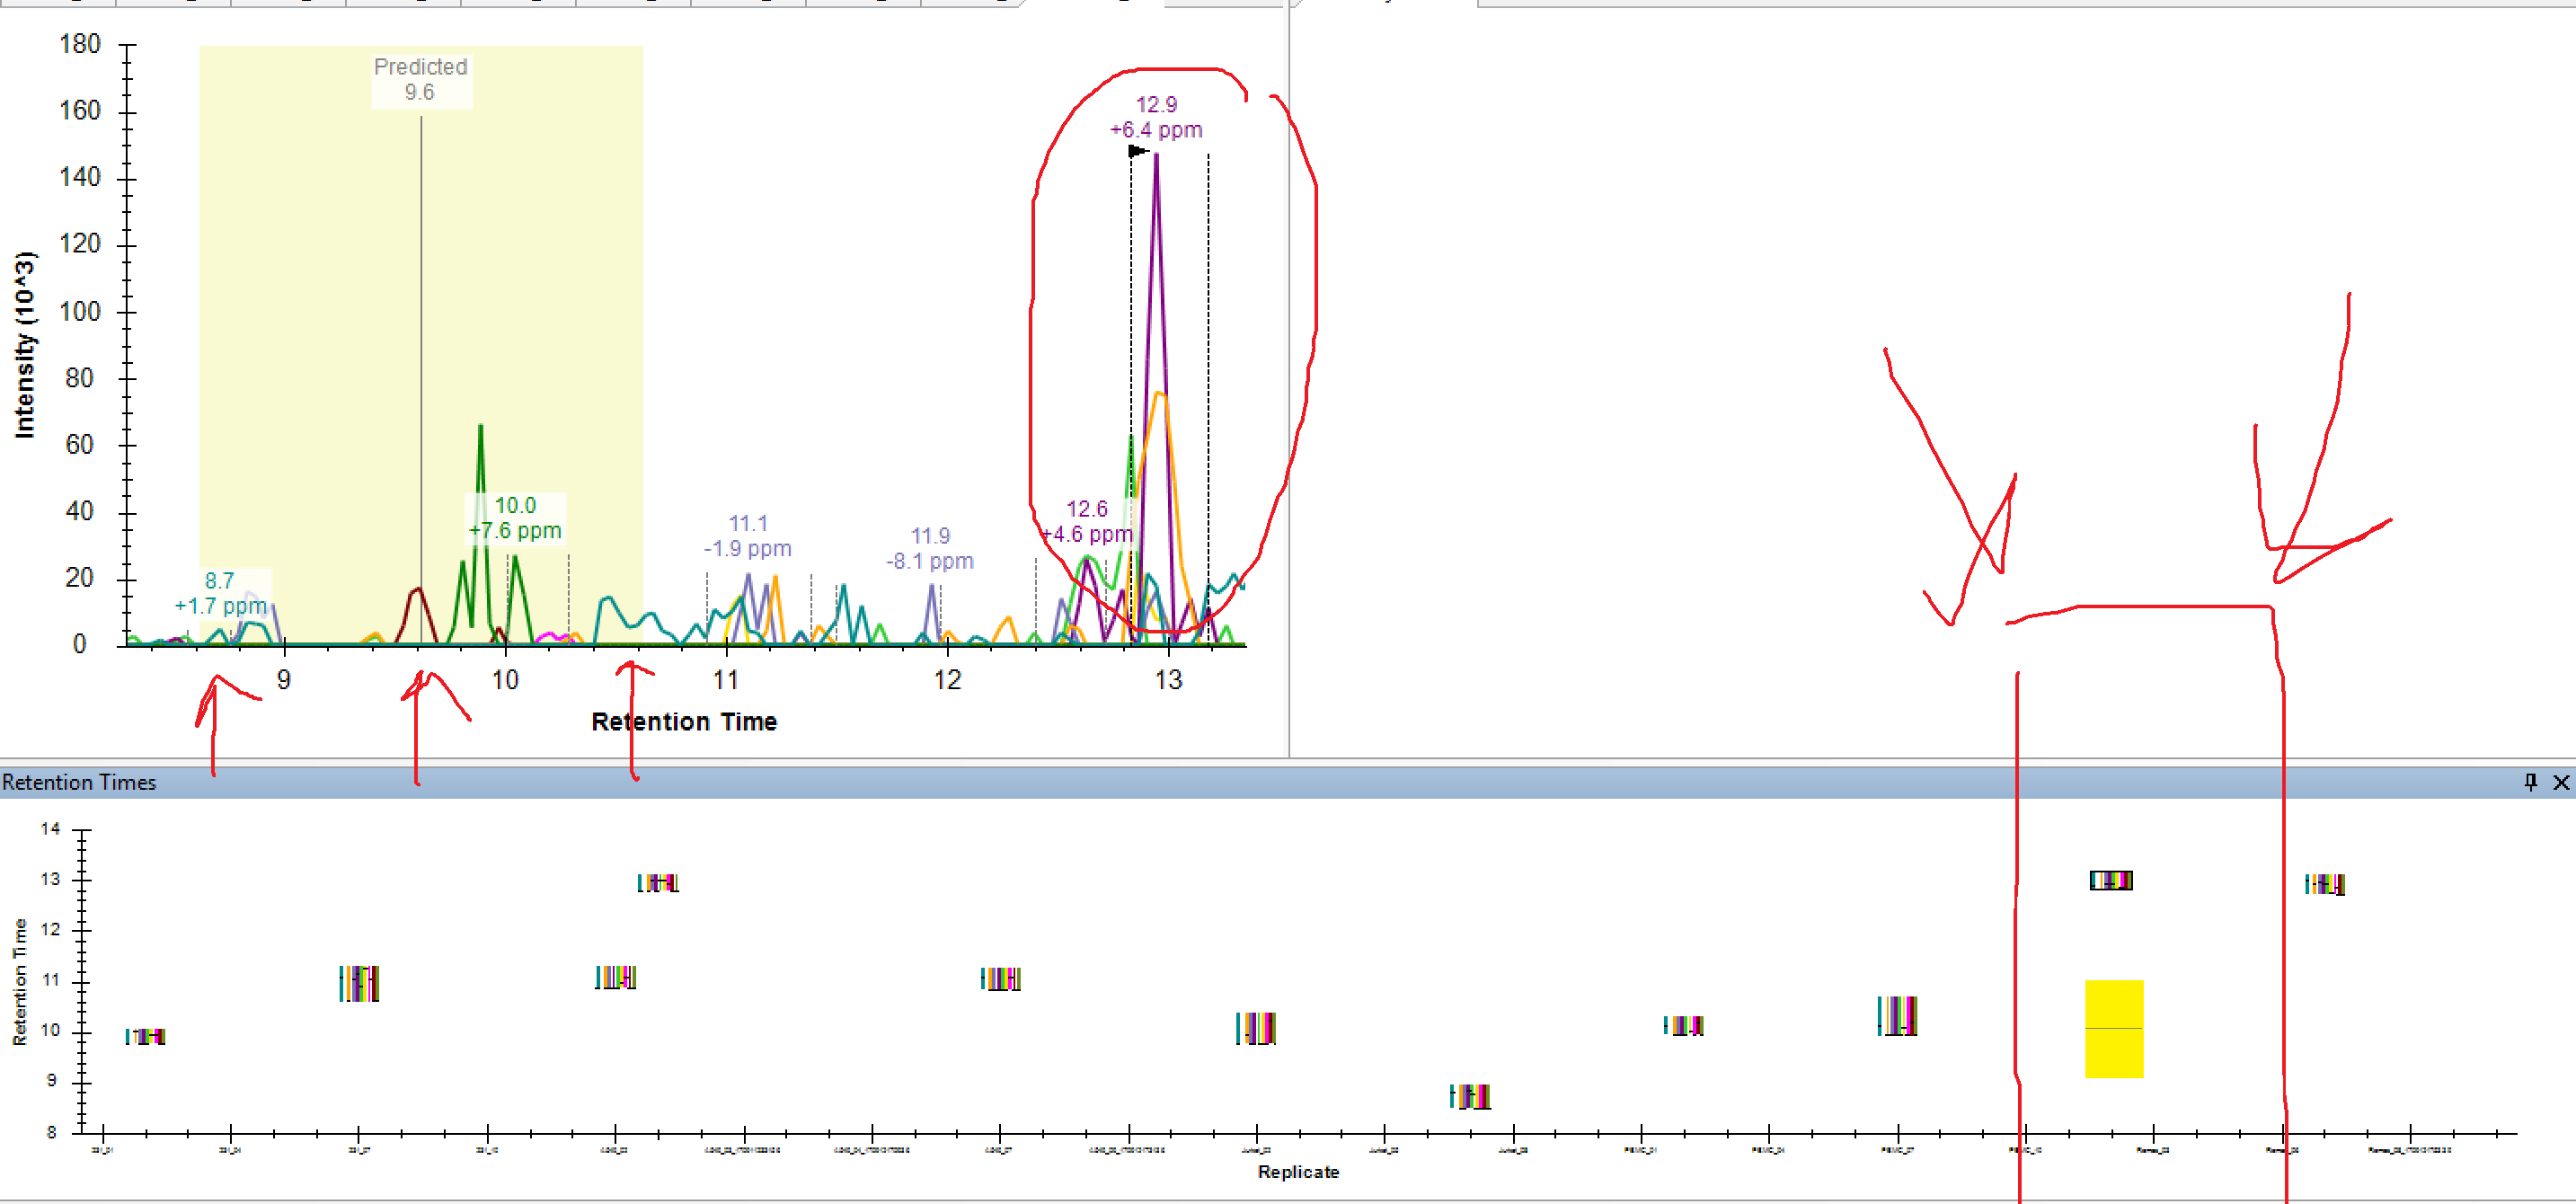 Untitled.png