Hello all!!
First of all thank you very much for this amazing software!!
I am currently running:
Skyline (64 bits) 3.5.0.9319
R version 3.2.4 (2016-03-10)
Platform: x86_64-w64-mingw32/x64 (64-bit)
Running under: Windows 7 x64 (build 7601) Service Pack 1
MSstats_3.3.11
The problem is while running the QC for my DIA samples within Skyline.
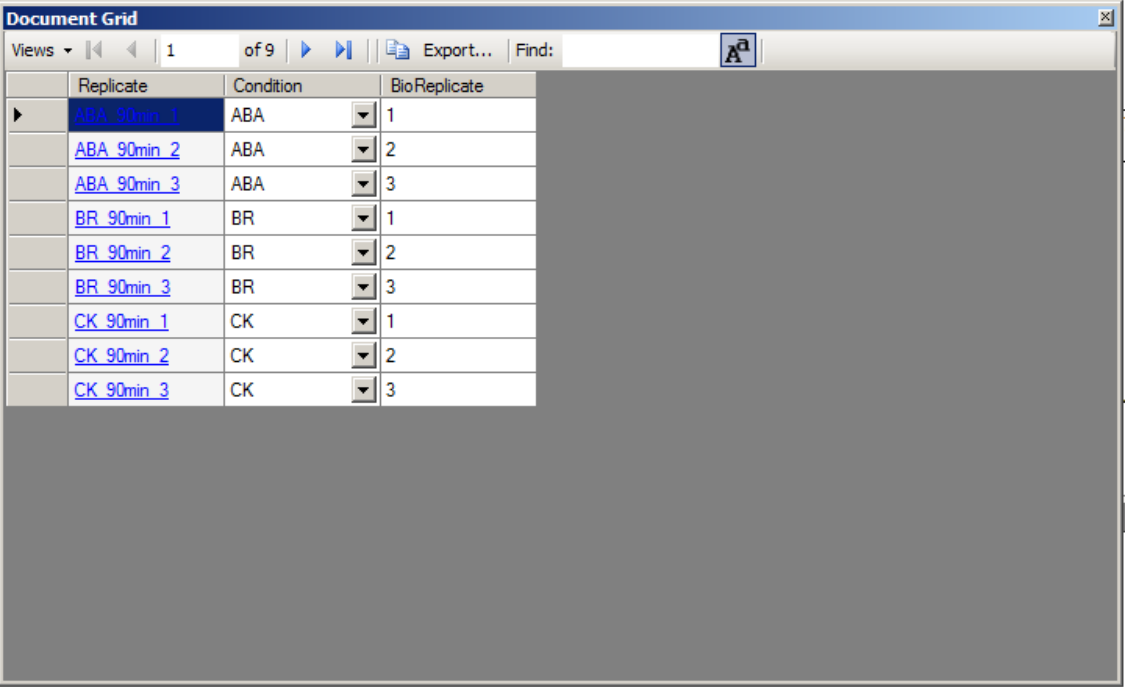
I have 6 samples, 3 biological replicates and 2 different conditions:
mock1
rap1
mock2
rap2
mock3
rap3
And I have this error:
"*** Subject : 1, Condition : Mock has multiple rows (duplicate rows) for some ENDOGENOUS features ()"
"*** Subject : 1, Condition : Rap has multiple rows (duplicate rows) for some ENDOGENOUS features ()"
"*** Subject : 2, Condition : Mock has multiple rows (duplicate rows) for some ENDOGENOUS features ()"
"*** Subject : 2, Condition : Rap has multiple rows (duplicate rows) for some ENDOGENOUS features ()"
"*** Subject : 3, Condition : Mock has multiple rows (duplicate rows) for some ENDOGENOUS features ()"
"*** Subject : 3, Condition : Rap has multiple rows (duplicate rows) for some ENDOGENOUS features ()"
"ERROR : Please remove duplicate rows in the list above. "
My question is how can I know the duplicated field?? what do you mean with ENDOGENOUS features??
And, I guess I cannot remove my duplicates within skyline, can I??
Thank you very much!!!!
T
 Skyline Settings.png
 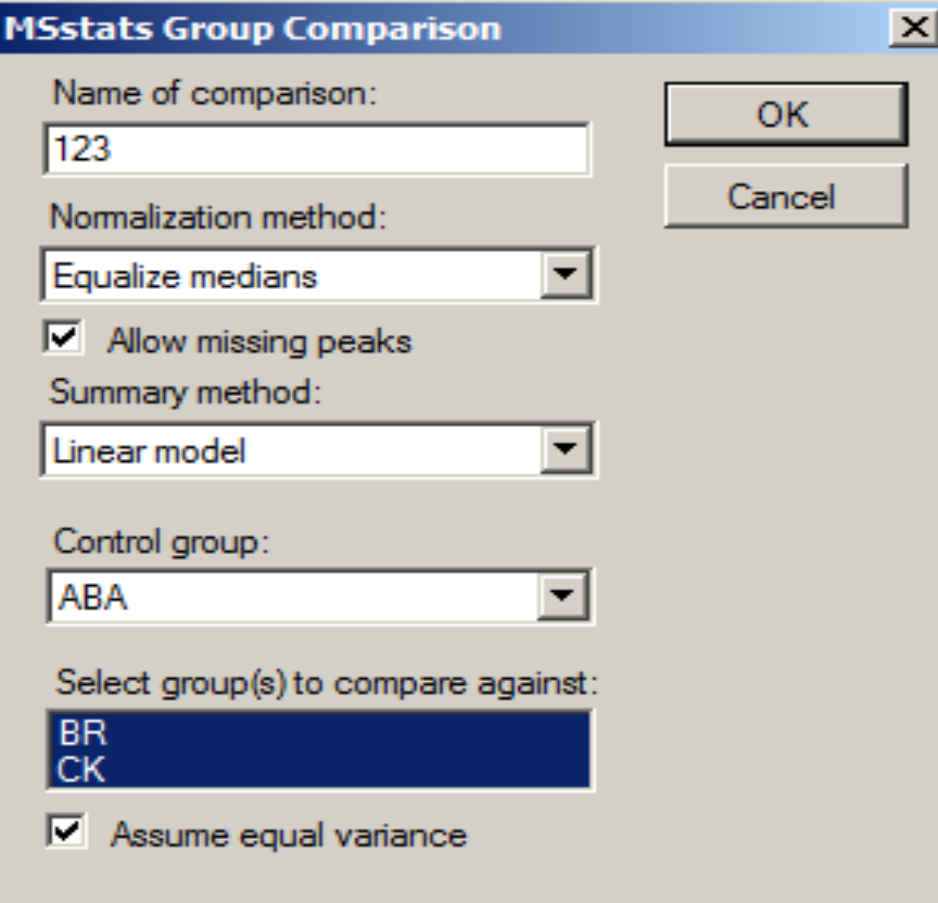 MSStats settings.png
  Result.png
 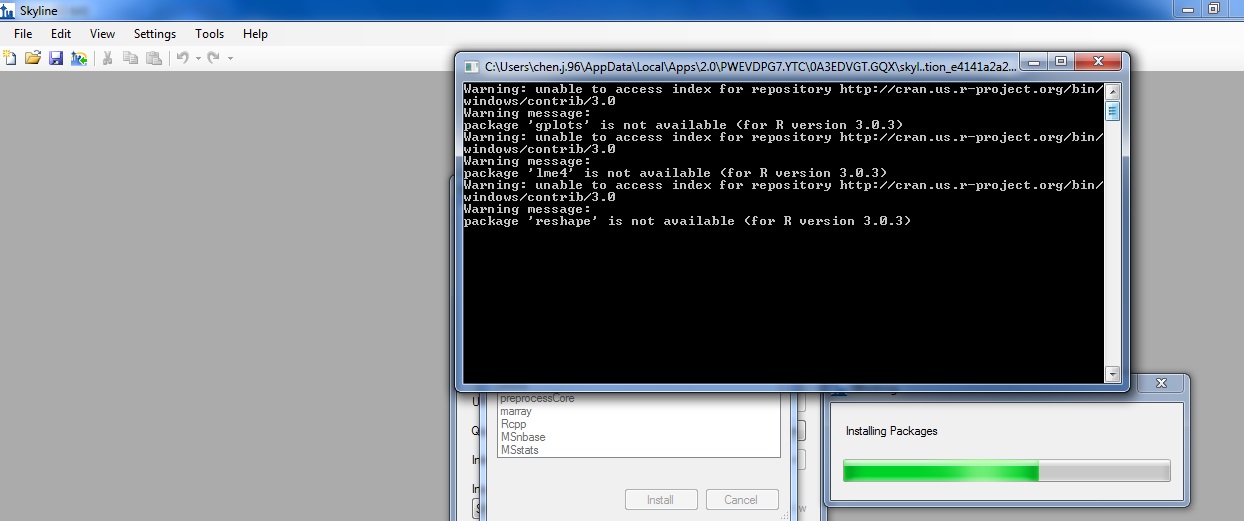 030415_problem.jpg