Dear Skyline team,
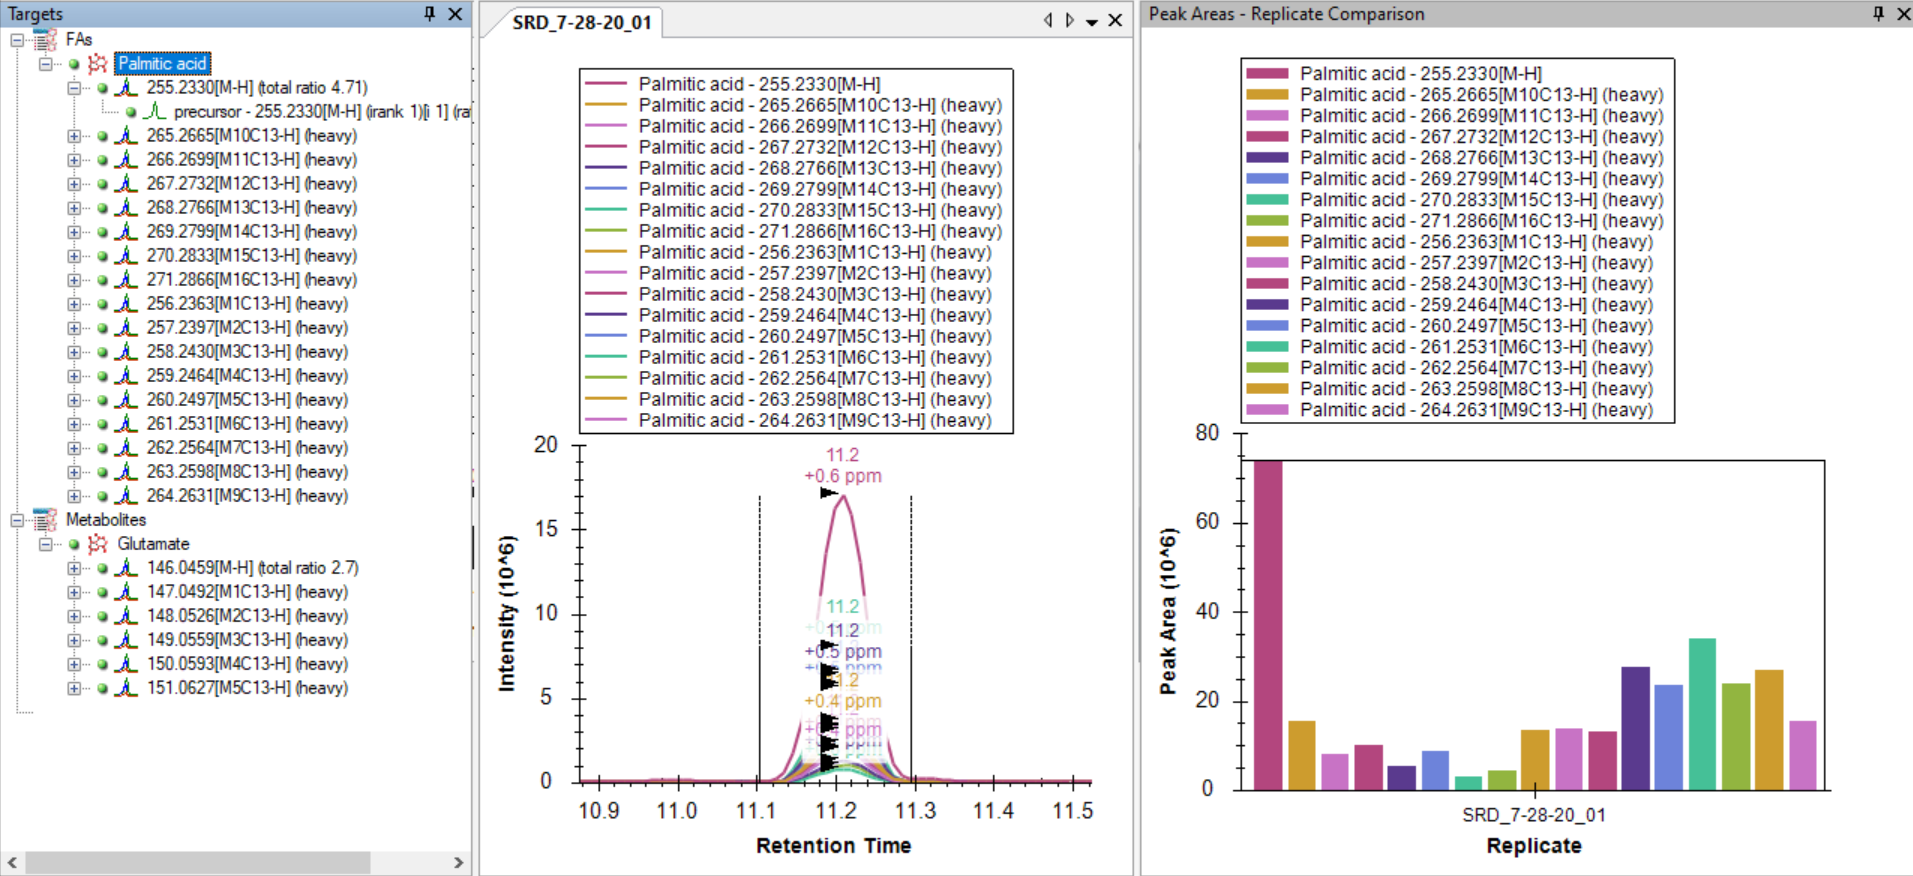
Thank you so much for all your effort, I don't know what I would do without Skyline anymore. I recently discovered that you also implemented new plots for the peak area replicate comparison that allows you to directly see the labeling patterns when doing stable isotope tracing experiments in the format I'm used to. It works very well for small metabolites. However, when looking at compounds with more than 10 carbons, the ordering of isotopologues is not by mass, but alphanumeric?, i.e. it shows the M-H, then the M10C13-H, M11C13-H,...., and only at the end the M1C13-H, M2C13-H, etc.
Is there an option to sort these differently? I need to export the data to do natural isotope abundance correction and plot the different isotopologues as fractions afterwards anyway, but it would be very helpful to see them in the right order in Skyline already. It is currently confusing if you don't look very closely and realize how they are ordered.
I attached an example.
Thanks,
Michi
 Skyline_isotopologue_order.PNG