Table of Contents |
guest 2026-04-05 |
Questions and Answers
Registration
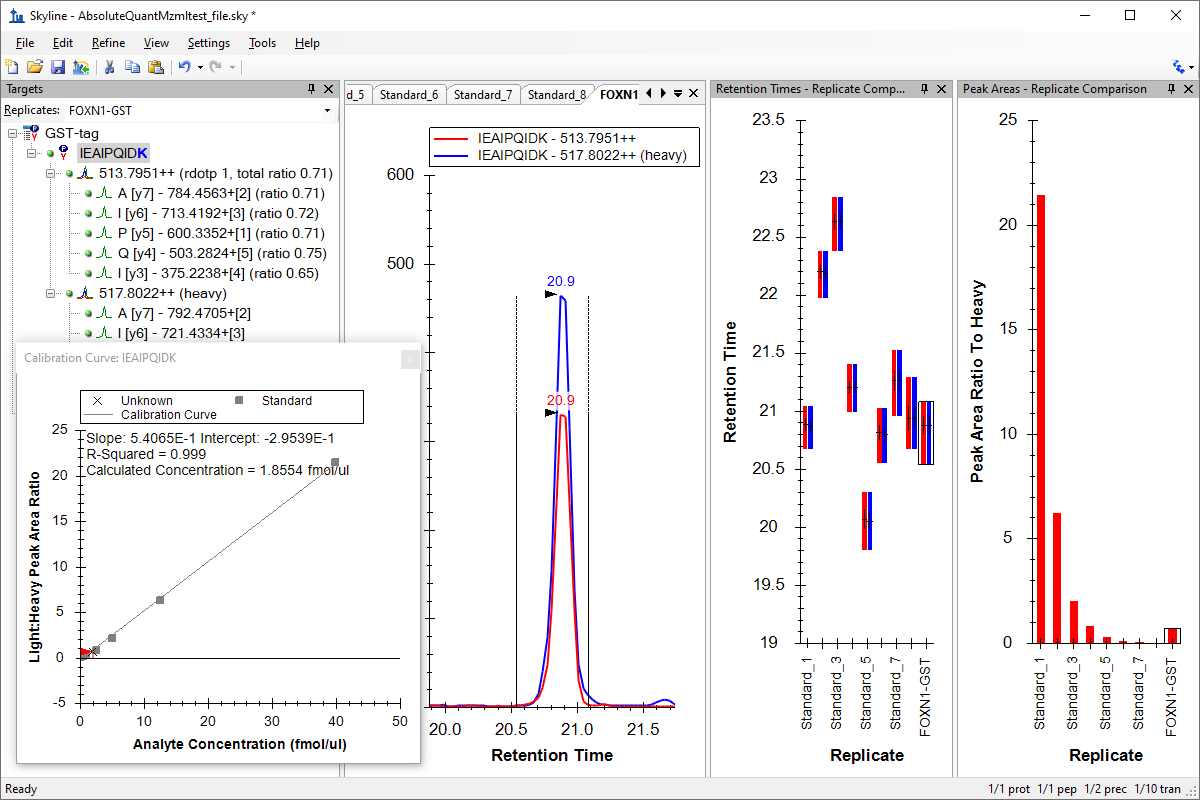
Webinar #13: Calibrated Quantification with Skyline
|
Due to a data center issue at our webinar hosting company, some attendees to Tuesday's webinar had spotty audio. We greatly apologize for this. However, we have posted a clean recording of the entire webinar below as well as the supporting files for Skyline Tutorial Webinar #13 Calibrated Quantification with Skyline from April 5, 2016. During the first part of his hands-on tutorial, Brendan used a data set that was featured in the Absolute Quantification tutorial. A discussion on downloading and using these data begins at about the 20m:45s mark of the recording. Also, at about 53m:45s of the recording, Brendan referenced a second data set available on Panorama Public which was published by Birgit Schilling of the Buck Institute.
|
Review Webinar 12Isotope Labeled Standards in Skyline Review Webinar 14
Large Scale DIA with Skyline |


Questions and Answers
Q: Basic question - when I load .wiff file from MRM EXPT. I am not seeing the chromatogram - what am I doing wrong?
Ans: It may be that you do not have your targets configured correctly. They need to match up with the transitions measured in your .wiff file. If you didn't generate the .wiff file from a method exported from Skyline that can be a little more challenging. Consult the Existing and Quantitative Experiments tutorial. The best way to proceed would be to post a message to the support board with at least a screenshot. If we still need more information, we'll ask you to post your files so that we can have a closer look at what is going on.
Q: Wouldn't losses during protein digestion lead to LOWER amounts than expected, not higher?
Ans: It is possible. It would depend on the experimental design. One possible explanation Chris offered depended on when the heavy reference peptide standard was added to the sample. For instance, if it was added prior to digestion, that could cause non-specific cleavage degrading some of the standard peptides, which would cause ratios of light to heavy to be overestimated.
Q: Does the multipoint calibration work with several replicates from the same standard (eg 3 points for 10fmol/ul, 3 points for 40fmol/ul...)
Ans: Yes. Skyline supports multiple replicates per standard concentration. That is actually shown near the end of the tutorial when the CPTAC Study 9 data set is downloaded and merged into a document containing 72 runs with a 10-point dilution series and 4 replicates of each concentration.
Q: Suppose I do not want all the daughter ions for the calibration curve. Let’s say I need only 2. How do I remove the others?
Ans: You could use Edit > Refine > Advanced to remove all but the 2 most intense. In version 3.7.1.xxxx and later, you can also leave the extra transitions in place as "qualitative" and turn off a new Quantitative property exposed on all transitions. You need to set this up using the Document Grid View designer, but once you have turned off the Quantitative property the affected transitions will no longer be included in any Total Area values and neither Group Comparisons nor Quantification.
Q: Would it be possible to generate calibration curve when heavy peptide concentration changes and light peptide concentration is the same?
Ans: Yes, that is possible in the Peptide Settings - Modifications tab by specifying that the reference standard should be considered the "Light" isotope label type.
Q: Would it be possible to use LOG-LOG linear regression fit?
Ans: A linear regression on LOG-LOG is currently not available, as it is not actually fitting a line to the data unless the slope is one. Skyline does offer a 1/(x * x) regression weighting, which some people use for a similar purpose to give more weight to lower concentrations and avoid letting the the highest concentrations dominate the regression. This seems to work best when the concentrations are mostly linear. As more standard concentration points fall below the LOD, they will throw off the calibration more because of the high weighting at the lower concentrations. The same would probably be true of LOG-LOG.
Registration
|
Dear Skyline Users, We closed out the 2015 with a webinar on Isotope Labeled Standards in Skyline lead by two experts on the subject with a lot of experience as instructors for the week-long Targeted Proteomics Course series -- Christina Ludwig (TU Munich) and Ariel Bensimon (ETH Zurich). If you weren't one of the over 125 people to attend the live session on December 1, you can still watch the recording of the session. We are very excited to announce the next webinar in the series: Webinar #13: Calibrated Quantification with Skyline [registration closed]
This webinar will include an introductory presentation from Brendan MacLean, Skyline Principal Developer and tutorial by Chris Shuford, Technical Director Research and Development at LabCorp. Join us, learn and help us to better meet your targeted proteomics research needs. --Skyline Team |
Presenters
Brendan MacLean (Principal Developer) 
Chris Shuford (Technical Director R&D, LabCorp) |
Review Webinar 12Isotope Labeled Standards in Skyline User Group Meeting at ASMSRegistration is open for the Skyline User Group Meeting on June 5 the Sunday before ASMS in San Antonio. |