How to Display Multiple Peptides |
2025-07-13 |
Skyline allows you to compare chromatograms of different peptides by selecting them in the Targets panel shown by default on the left side of the Skyline window.
For example, to see all the peptides belonging to a particular protein, click on the protein name in the Targets panel:
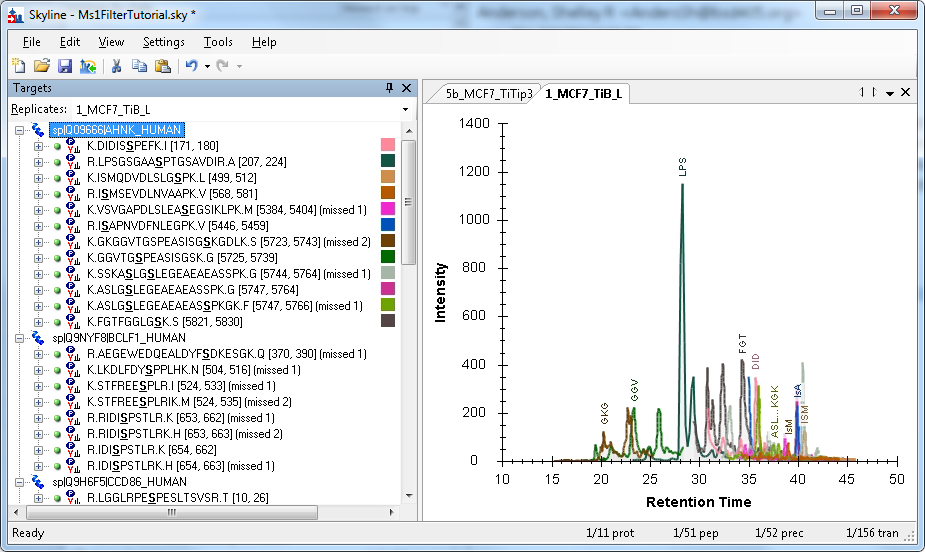
Skyline generates a color for each peptide based on the peptide sequence and modifications. This provides a quick way to identify the matching chromatogram in the graph. A peptide will always have the same color, even in different Skyline documents, unless there is another peptide within the same protein that generates the same color. That doesn’t happen too often, but when it does, Skyline picks one of the conflicting peptides and assigns it a new color that is easier to differentiate.
Color swatches are shown in the Targets panel next to only those peptides which are shown in the graph. In the example above, only the peptides under the selected protein are shown in the graph.
The peptides are also labeled in the graph with a unique abbreviation. If the first three letters of the peptide’s name are unique (among the peptides being graphed), then only three letters will be used in the abbreviation. If the first three and last three letters together are unique, the abbreviation will use those (see ASL…KGK in the example above). More complicated abbreviation schemes are used if the first and last three letters are not unique. Note that a peptide’s abbreviation can change depending on what other peptides are being displayed at the same time.
Graphing peptide subsets
The Targets panel allows you to select any subset of peptides you want. You can select just a few peptides (from one protein, or across different proteins) by clicking on the first, and then holding the CTRL key down while clicking on additional peptides. You can toggle a peptide by clicking on it multiple times with the CTRL key depressed.
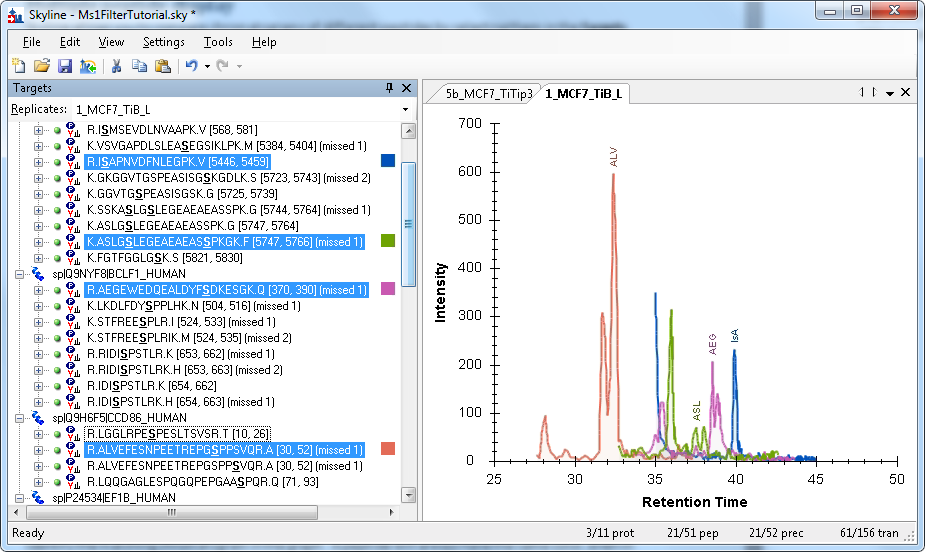
You can select individual peptides by clicking on their names, or you can select all the peptides belonging to a protein by clicking on the protein name.
All peptides
To see every peptide in the document graphed, click somewhere in the Targets panel to transfer focus there, then type CTRL-A (or choose Select All from the Edit menu):
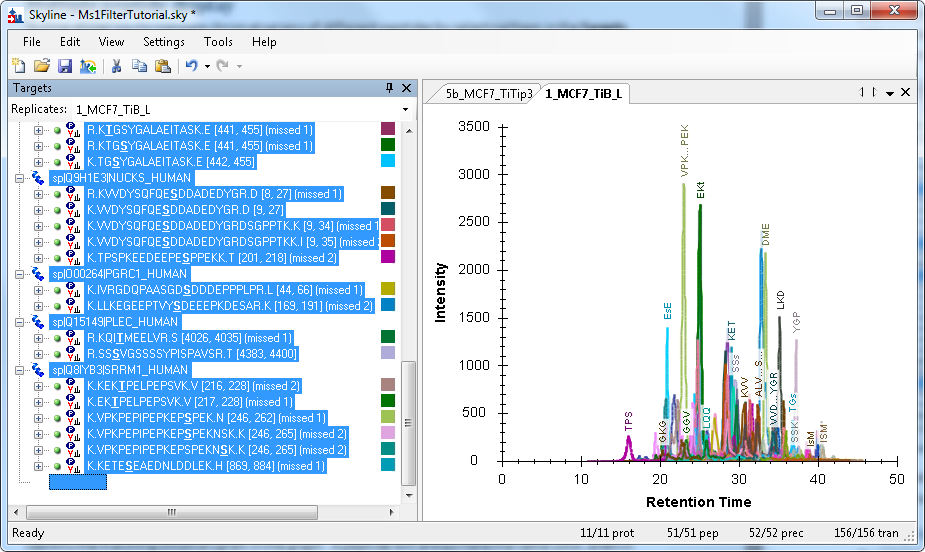
Note that this can take some time to display if your document contains a large number of peptides.
Displaying all the peptides will produce a graph that looks similar to the progress displayed during data import:
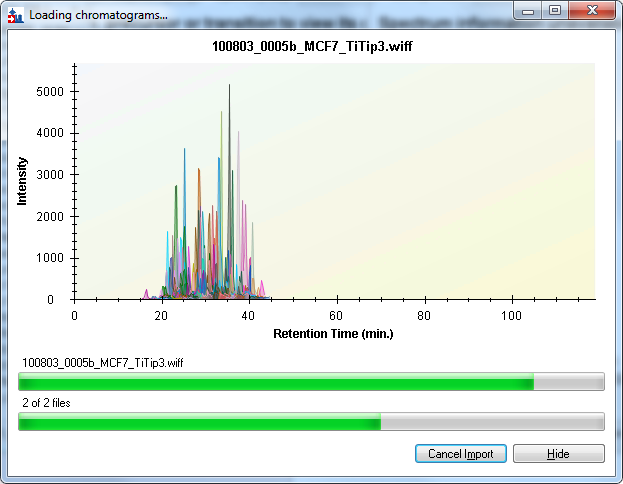
But you can see differences between this graph and the one above. Peptide colors will usually match, but occasionally they don’t if a different color is needed to disambiguate two peptides in the same protein. Peak values can also differ, because different summation criteria are used during import than later when more processing has been done on the raw data.