Table of Contents |
guest 2024-04-18 |
Questions and Answers
Registration
Webinar #19: Ion Mobility Spectrum Filtering With Skyline
|
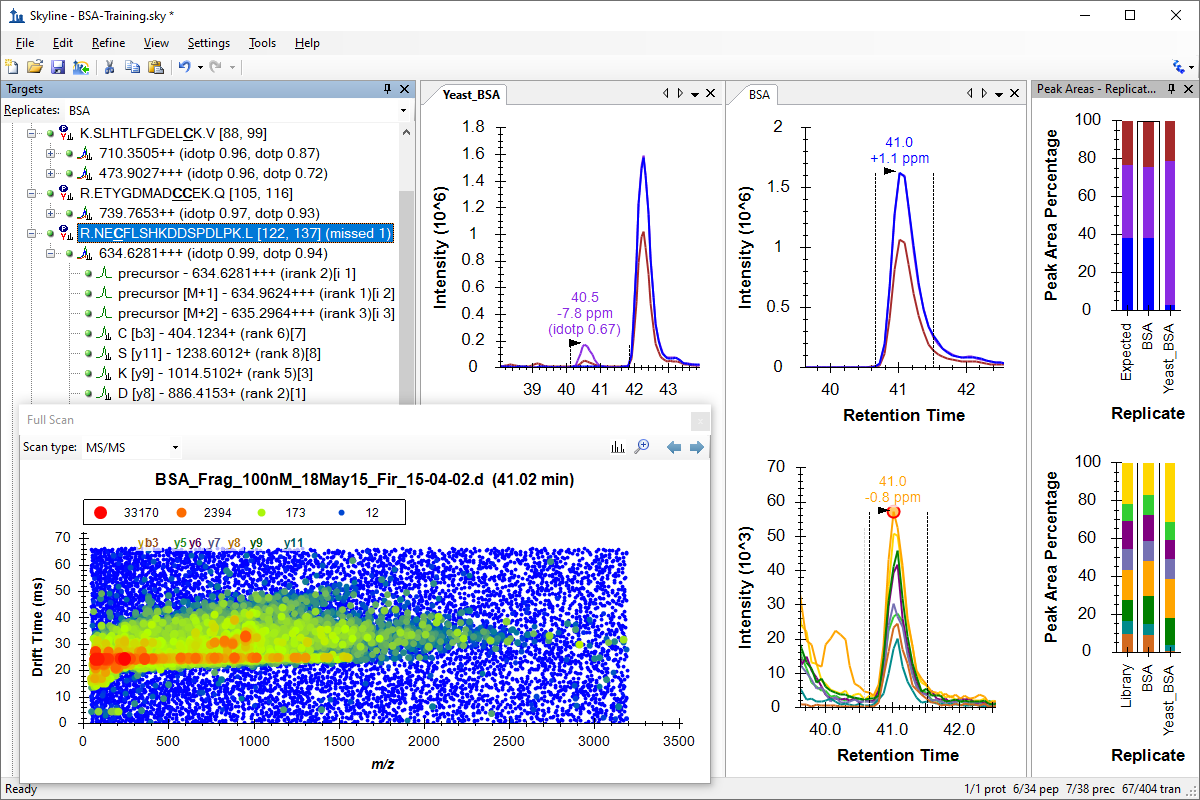
Webinar 19 was the second Skyline tutorial webinar produced in April, 2020 amid the COVID-19 lockdown. The focus was on using Skyline to process ion mobility data and explore the spectra produced by IMS-enabled mass spectrometers. After a quick introduction by Skyline Principal Developer Brendan MacLean, North Carolina State's Erin Baker, Ph.D, delivered an overview of ion mobility concepts and the origin of the data set used in the tutorial that followed, again presented by Brendan. As an ion mobility expert and long-time collaborator with the Skyline Team, Erin has been our primary ion mobility mentor for many years. Over 230 attendees joined Webinar 19 and the highly involved audience posted many questions for the Q&A session which will all be answered in writing shortly. Those we had time to answer during the webinar will be included in the full recording of the session, available shortly on this page. Stay healthy, everyone. We look forward to seeing you back for the next in this series, coming soon. -- The Skyline Team
|
Review Webinar 18DIA/SWATH Data Analysis in Skyline Revisited Review Webinar 20Using Skyline Batch for Large-Scale DIA |


Questions and Answers
Q: The ion mobility prediction tab appears to select the ion mobility value from the most intense scan. Is there a way to pick the most discriminatory ion mobility value in the same way (i.e. ion mobility value with the greatest difference in intensity between the best and second best peak)?
Ans: The option you suggest is not currently available. The algorithm expects a targeted, clean sample prep like the one presented with BSA in water. This is a more targeted method of IMS library building, similar to injecting synthetic peptides to derive library values for spectra, RT and optimized values like collision energy. Skyline also provides the ability to use IMS values from proteome-wide peptide search data with tools like Spectrum Mill, Waters ProteinLynx Global Server, and Mascot and MaxQuant for the Bruker timsTOF, where the search tool provides the IMS values. So, currently, Skyline uses the apex spectrum of the picked (best) peak and from that derives the IMS value which produces the maximum signal with the defined extraction width. True, it does not look at the second best peak, nor use the delta between the signal intensity in the best peak spectrum compared to that in the second best peak spectrum. Not sure one could expect that to be importantly different in this case, but if you can provide statistical evidence for the algorithm's superiority, it does not sound that difficult to adapt what we have to that.
Q: Very impressive! Are you using any kind of signal to noise ratio to objectively judge the rate of interference for a peak?
Ans: No, we are just turning the drift time filtering on and off in the same datasets.
Q: Is there any option to use the spectral library possibility in the "molecules interface" for small molecule workflows (e.g. from .mgf or .msp files)? Probably, I overlooked this until now.
Ans: We may be missing this until now also. If you can provide an example of a library which contains CCS values for small molecules, which Skyline currently fails to use, we would be happy to work with you to adapt the code to enable that workflow for you.
Q: Did you compare the results to a DDA style approach on the IM-QTOF?
Ans: We have but not for this dataset. Since the selection windows in DDA are usually at least 1 Da wide (and often up to 4 Da), the use of the IMS drift time/CCS dimension has also shown great improvement in ruling out the close co-eluting isobars and selecting only the molecule of interest.
Q: Can you comment on the dynamic range when switching between the IM mode and a non-IM Mode? Specifically compression at the higher end of protein concentrations?
Ans: This will depend on the amount of time you trap and store your ions prior to injection into the drift cells. The more time, the lower the dynamic range. We utilize multiplexing to optimize signal and reduce trapping time. We do think there is evidence of compression at the high end in this dataset. Though, we know Agilent has also devoted significant effort to this issue since the data were collected.
Q: Will there be support for importing .bilb from metabolomics software… compound discoverer XCMS?
Ans: Often the first step to new support is for an interested user to provide an example data set and express a desire to have the support for real work. We try to respond positively to all such requests, and we have a very good track record in doing so, now supporting some 20+ proteomics search pipelines in our spectral library building. Please post to our support board and offer an example dataset. We would be happy to work with you on this.
Q: Can you give more details as to how to choose an appropriate resolving power for Ion Mobility Predictor based on the spectra observed?
Ans: We examine the resolving power of our calibrants in an earlier run and then us a setting slightly lower for increased selection window. For example, of the resolving power for the calibrant run was ~55 so we utilized 50 in Skyline. In a recent diaPASEF experiment on the timsTOF, we were able to run a statistical assessment using a 3-organism mix to determing the optimal resolving power for both the number of identifications in an mProphet-based proteomewide search and also the quantitative statistics using LFQbench. In that case, also, we ended up with 50 as the optimal resolving power. Though, lower resolving powers down to about 30 worked well enough.
Q: Would you say that such minor adjustments of peak area boundaries as you showed are "worth the effort" for bigger data sets?
Ans: Usually not, and especially not when the data contains injected stable isotope-labeled standards, but in this case we were working with a response curve on just the unlabeled BSA peptides, with varying selectivity between the no-IMS and the IMS filtering cases. Especially in the low concentration cases, this could be highly problematic for Skyline in picking the right peak or integrating noise around where the right peak was known to be. Because of this and the the relatively low number of peaks to inspect, we chose to give everything our best possible attention and manual correction, without which we certainly would have ended up either including mis-integrated peaks or statistically missing values based on a scoring model. Since our goal was to gain instight into the impact of IMS filtering on the underlying signal, we chose a method we felt comfortably gave us no missing values.
Q: I used Skyline before with my own samples (cells extract after some treatments), I had some problems with the import results. Because I have the same kind of image as you, with the different colors, but when it is done, in the precursors area I have some precursors in green, but when I check the spectrum, they don't match well. I don't know if it is normal or i have some settings problems. I mean, is a problem with my sample....
Ans: This would be best addressed by using the Skyline support board, where we can ask for your files or screenshots of what you are seeing and help you address your issues.
Q: As per the previous question... At some point will the "CCS Predictor" support multiple conforms / drift peaks?
Ans: Yes, we believe so. Perhaps in this next version.
Q: If we have IMS set for 2 different CVs can skyline assign the CV of the ions through the "prediction" tab in peptide settings?
Ans: Not automatically, but you can add these manually as long as the targets have two different names (e.g. A and B). And we hope to add the ability to support multiple conformers in a future release.
Q: Thank you guys for the great tutorial! Do you use the IMS offset for fragments and how do you determine it for Agilent instruments and ramped CE?
Ans: I am not currently using the IM offsets for fragments. For the ramped CE, I utilize standards of the molecules I am interested in that span the drift time range since CEs vary so much for the different molecule types. I find the optimal CE for each standard and note its drift time and then make that into my ramp. Per request by John Fjeldstadt at Agilent, Skyline does support the fragment offset, which you could enter yourself, or the "Add Results" button you saw demoed in the tutorial will run an algorithm on the adjacent high-energy spectrum to the low-energy spectrum used to determine the original precursor IMS value, and it will seek the IMS value that produces the highest signal in that high-enerfy spectrum for your targeted fragment ions. Then it will take the delta between that IMS value and the precursor IMS value as the offset. I think it can also average among multiple training runs, which may help to reduce the impact of variance as a source of this offset, since even to precursor measurements would be expected to yield a small delta which would not necessarily be appropriate to encode as an "offset" in the extraction parameters.
Q: You've showed a Proteomics workflow. Do you care to mention working with IM and transition page for small molecules?
Ans: It is working great for small molecules and lipids. There will be future Skyline webinars to showcase this.
Q: You show that the process can find unknowns - say contaminants. These unknowns will have associated precursor m/z, IMS, and product ion m/z values. Is there a way to export out these associated values for attempted identification using external tools?
Ans: Since Skyline is targeted, it will only show unknown peaks next to your targets. We also import feature lists as targeted lists and do Skyline analyses on them to determine if any features are statistically significant and worth identification.
Q: We use the resolution also for the new HRdm and its higher resolving power?
Ans: That is great!!
Q: Strange that you're seeing the drift shift from the CCS Predictor. I've not seen that issue before.
Ans: We are unsure what this refers to as we were not able to use CCS in this tutorial due to the age of the data files and the lack of CCS calibration in them. If it is a concern, please post a more detailed request to the Skyline support board.
Q: Are there any special settings you have to take into account when using waters data (HDMSE)?
Ans: No, it is done the same way as long as fragmentation is performed after the drift cell. The Skyline Team has devoted considerable effort to making the differences at the data level transparent to a Skyline user. So, what you need to do in Skyline is highly similar between multiple platforms.
Q: Do you have recommended settings for PRM and or Thermo FAIMS data acquisition?
Ans: Skyline does support IMS as a filter for Thermo FAIMS PRM or SCIEX SelexION, but it is an approach much more similar to CE optimization than the post-acquisition extraction technique presented here. You would want to look at the Transition Settings - Prediction tab and the Compensation voltage options.
Q: Thank your team for your wonderful work. When will be the webinar on diaPASEF?
Ans: Hopefully this Fall. We are somewhat gaited on Ben Collins ability to return to his lab and collect a new instructional dataset comparable to the ones presented for QE and TTOF in webinar 18 for the timsTOF. The data we have worked with in developing the features was around 50 GB in size, and not appropriate for instruction or expecting Skyline users to download over the Internet. The QE and TTOF datasets are shorter gradient and both around 3 GB in size.
Q: One thing that is interesting when using IM data is the shape of the drift profile. Has skyline made any attempts to pattern match the peak shapes to increase selectivity?
Ans: Not yet, but that is a great future challenge to address.
Q: The ozone fragmentation that has been of interest with lipids is really cool. Does Skyline allow incorporation of that?
Ans: Yes :) You can add the ozone transitions for each target and utilize Skyline to search for them. It is great!!
Q: Great answer about the PNNL Demultiplex. Do you just batch demultiplex prior to pulling it into Skyline?
Ans: Yes. You must demultiplex prior to utilizing Skyline.
Q: Comment on HD-MSe: on the instrument end, to have the IMS filtration shown in the webinar I think you will have to perform the fragmentation after IMS separation (on the transfer cell, not in the trap cell) in order to have ion mobility of the "precursors" from the low energy scan>
Ans: Exactly. If the fragments do not have the same drift times as the parents, then this type of DIA analysis will not work.
Registration
|
Dear Skyline Users, The Skyline Team would like to thank the record 500 attendees for maximizing our Zoom webinar license at our recent Skyline Tutorial Webinar #18: Dia/SWATH Data Analysis in Skyline Revisited. If you missed it, were denied access when we hit our maximum attendance limit (we're upping that!), or just want to review, we have posted a full recording of the webinar as well as the slides presented, and links to data and the step-by-step written tutorial. We received over 50 Q&A questions that we will provide written answers for soon. We hope you will enjoy our next webinar in this series: Webinar #19: Ion Mobility Spectrum Filtering with Skyline [registration closed]
This webinar will include an introduction and tutorial walk-through from Brendan MacLean, Skyline Principal Developer, and a presentation from Erin Baker, an expert in ion mobility mass spectrometry at North Carolina State University, a key collaborator who helped bring IMS-MS capabilities to Skyline. Join us, learn and help us to better meet your research needs involving modern IMS enabled mass spectrometers. --Skyline Team |
Presenters
Brendan MacLean 
Erin Baker |
Review Webinar 18DIA/SWATH Data Analysis in Skyline Revisited |