| Title | | » | Mass error replicate comparison does not support split graph |
| Assigned To | | » | Nick Shulman |
| Type | | » | Todo |
| Area | | » | Skyline |
| Priority | | » | 3 |
| Milestone | | » | 3.7 |
In fixing a recent report about the Mass Error replicate comparison graphs not using the correct colors when only product ions are shown in data that contains both chromatograms extracted from MS1 and MS/MS I noticed the Transitions - Split Graph does not have any impact on the mass error replicate plot. Since the ions come from different spectra, I could imagine them having different mass errors. Seems like this graph should follow chromatograms and peak areas when split graph is chosen. Could you implement this?
 SplitByMsLevel.png
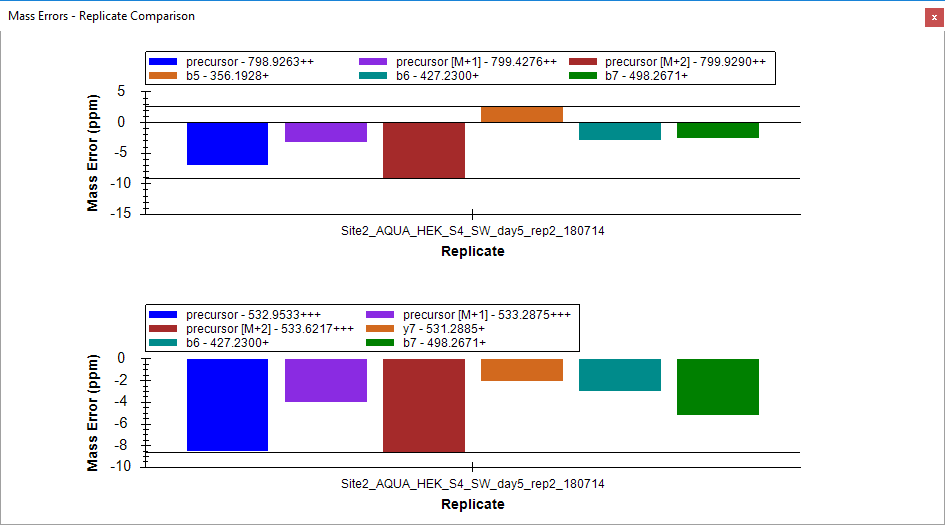 SplitByPrecursor.png