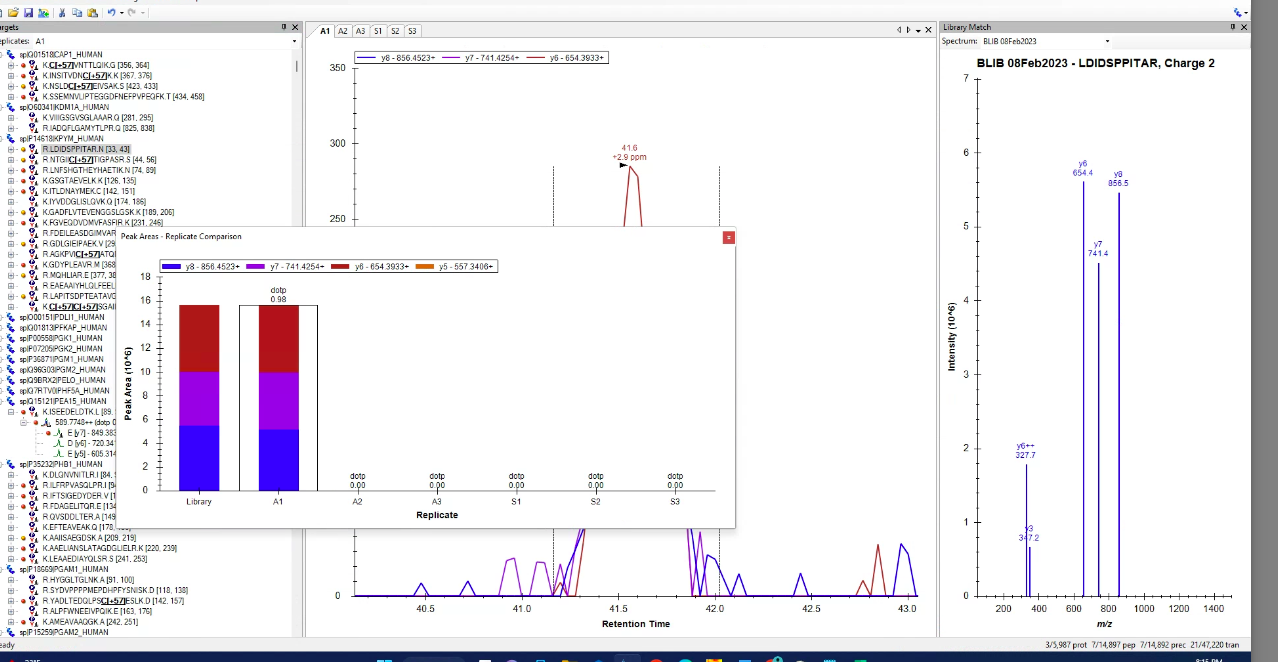
I see that in your Peak Area Replicate Comparison graph, the "A1" replicate has some nice peak areas, but the other 5 replicates have zero peak area.
Whenever you see something suspicious in the Peak Area graph the usual place to look next would be the chromatogram graphs.
You can tell Skyline to show you the chromatogram graph for a particular replicate using the menu item:
View > Chromatograms > <replicate name>
It is possible that the chromatogram graphs for the replicates with zero peak area will be completely flat. If you are looking at a completely flat chromatogram in Skyline, one thing that you can do is click on any point along the flat line and Skyline will show you the spectrum which contributed to the point on the extracted ion chromatogram.
Sometimes the spectrum that Skyline shows you really has no signal in it at all, and sometimes there is some signal there, but it is just outside of the m/z window that Skyline was summing across and so it did not contributed to the intensity value in the extracted ion chromatogram.
If you want to widen the m/z window that Skyline is summing across you can change the settings at:
Settings > Transition Settings > Full Scan
I cannot say for sure what is going on with your data, but if you send me your Skyline document and a few of your raw files, I could probably tell you.
The way to send someone your Skyline document is to use the Skyline menu item:
File > Share
That menu item allows you to create a .zip file which contains the Skyline document and supporting files including spectral libraries and extracted ion chromatograms.
That .zip file and your .raw files will probably be too large to attach to this support request, so you can upload them here:
https://skyline.ms/files.url
-- Nick
 Screen Shot 2023-02-20 at 8.15.49 PM.png