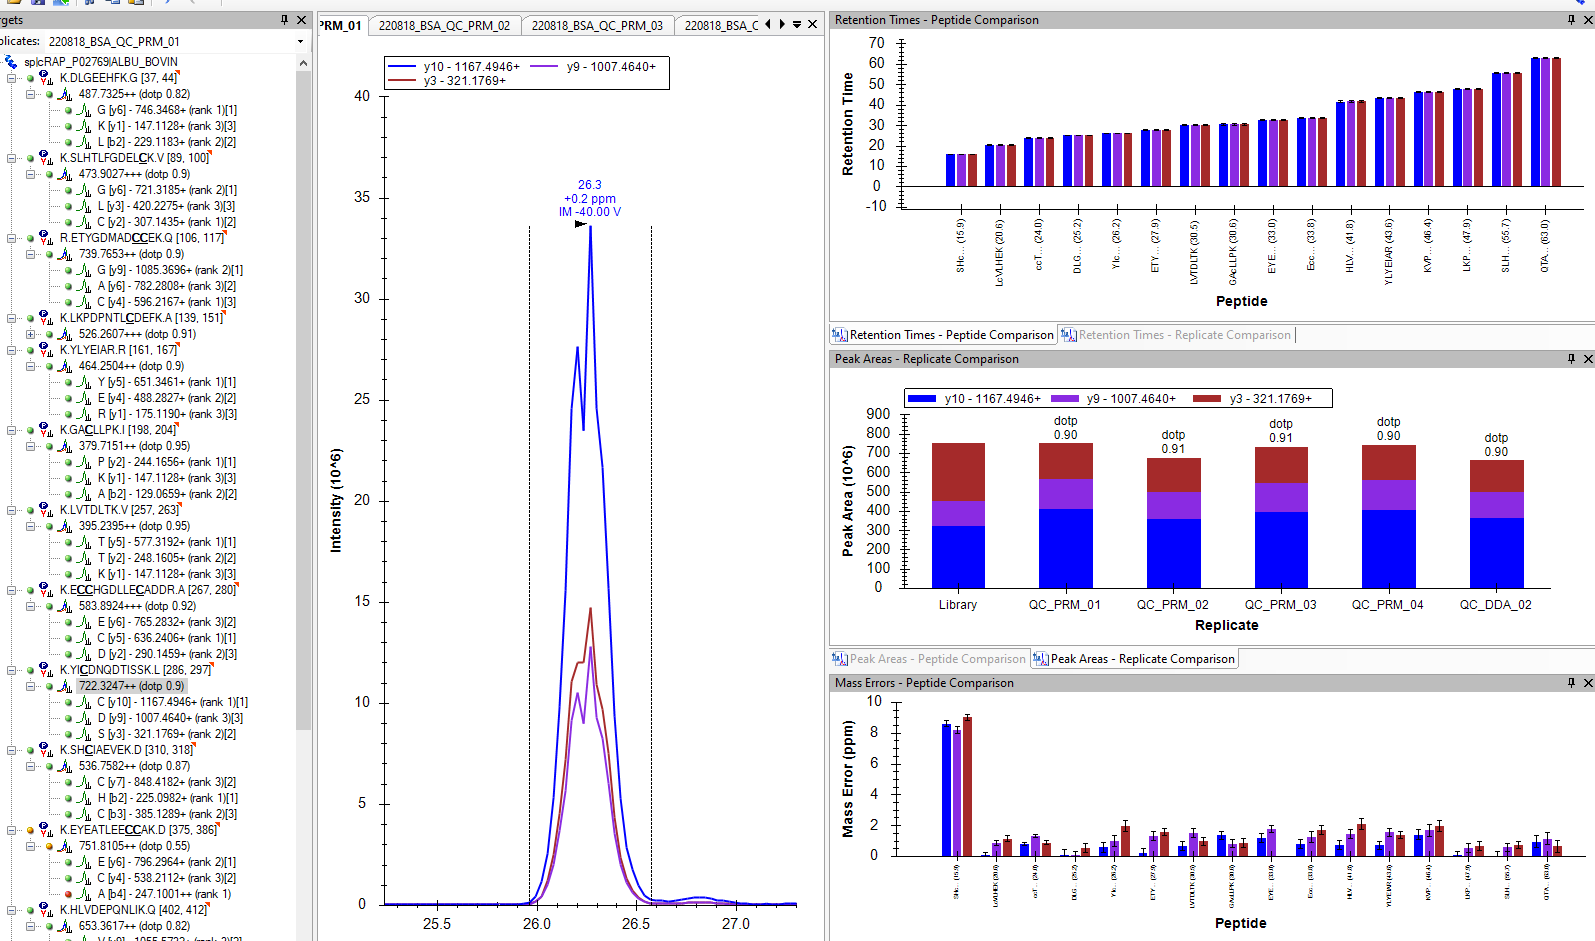
I think you just need to right-click on the Retention Times Peptide Comparison graph and choose "Value > All".
Then things will look like the whisker plot indicating start, end, apex, and full width half max retention times that you are used to, and the Y axis will not necessarily include zero.
I think you had right-clicked on the graph and chosen "Value > Retention Time", which is causing the graph to display as an ordinary bar graph.
I believe this behavior has always been this way.
-- Nick |
 Screenshot 2022-08-19 110123.png
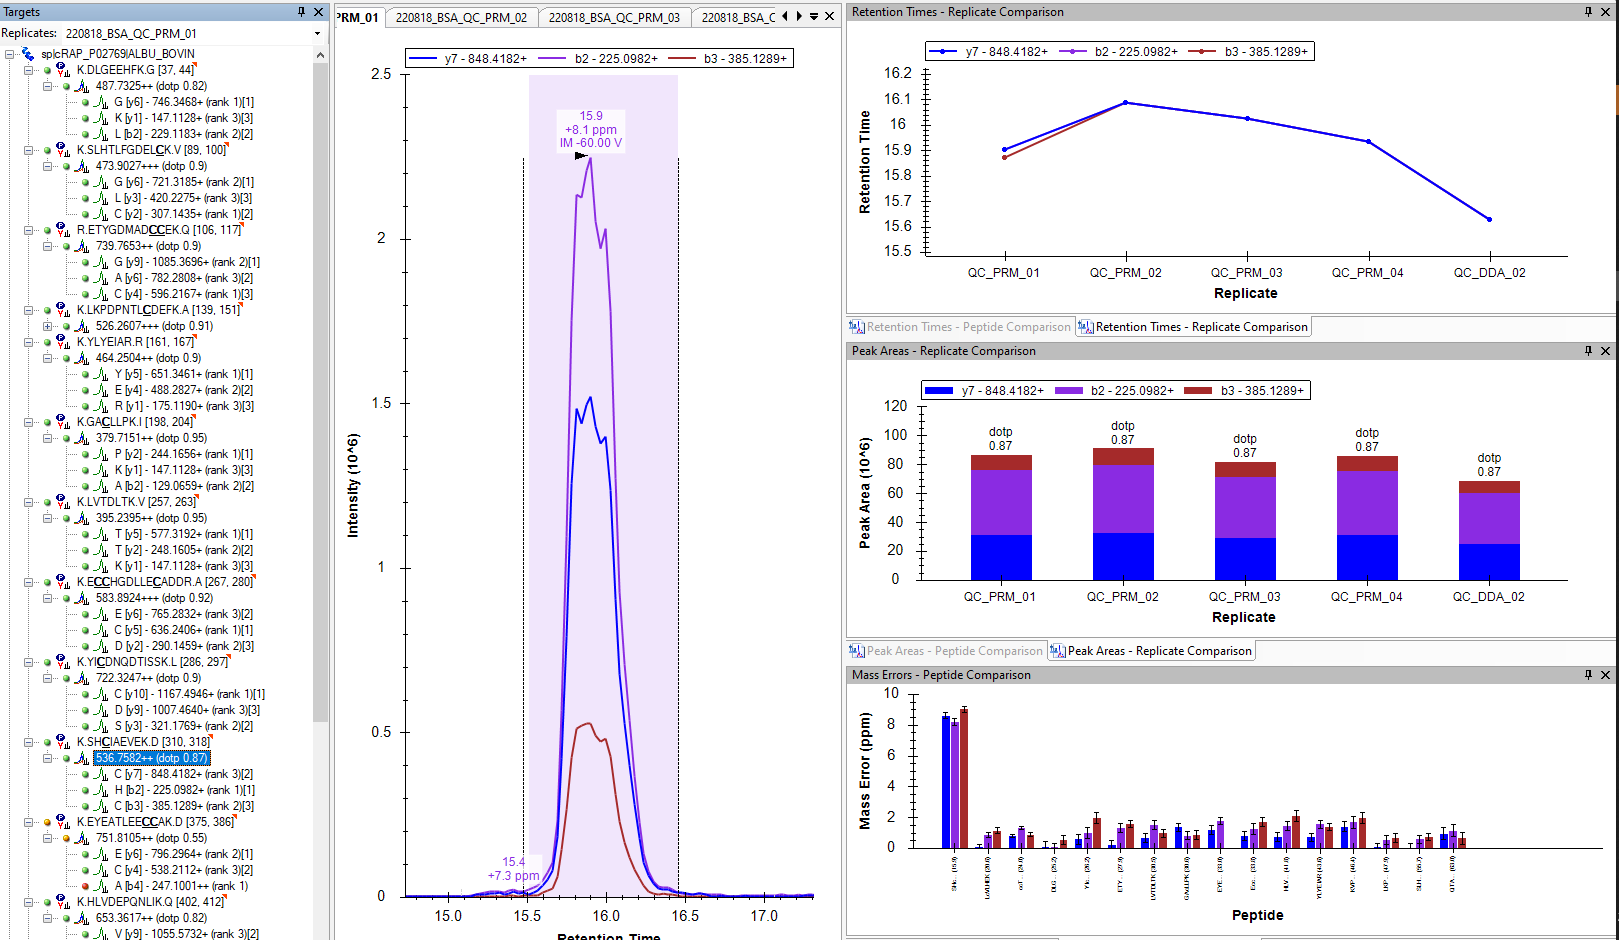 Screenshot 2022-08-19 105616.png