When you have "Triggered chromatogram acquisition" checked at "Settings > Transition Settings > Instrument", Skyline will try to detect where the gaps in the chromatogram are. This feature is probably working correctly in your document, but I think the problem is that the graph that you see when you have multiple peptides selected does not know anything about this feature.
If you were to select one peptide in the Targets tree, then the graph that you see would not have those long horizontal lines. When "Triggered chromatogram acquisition" is selected, the chromatogram line is supposed to have breaks in it, with blank space in the regions where no light MS2 spectra were acquired.
I will try to fix the multi-peptide graph display so that it works correctly with SureQuant data.
It is possible that there is something else going wrong. If you would like, you can send us your Skyline document.
In Skyline you can use the menu item:
File > Share
to create a .zip file containing your Skyline document and supporting files including extracted chromatograms.
If that .zip file is less than 50MB you can attach it to this support request. You can upload larger files here:
https://skyline.ms/files.url
-- Nick
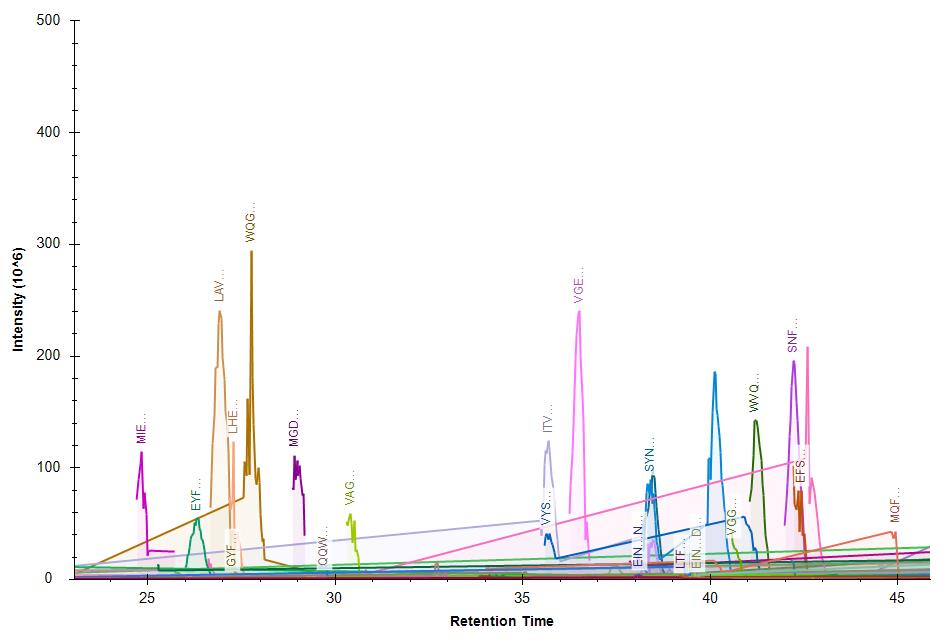 PeakIntegrationError.jpg