| MZXML Data is only partially importet | juergen gindlhuber | 2021-10-12 07:28 | |||||||||||||||||||||||||||||||||||||||||||
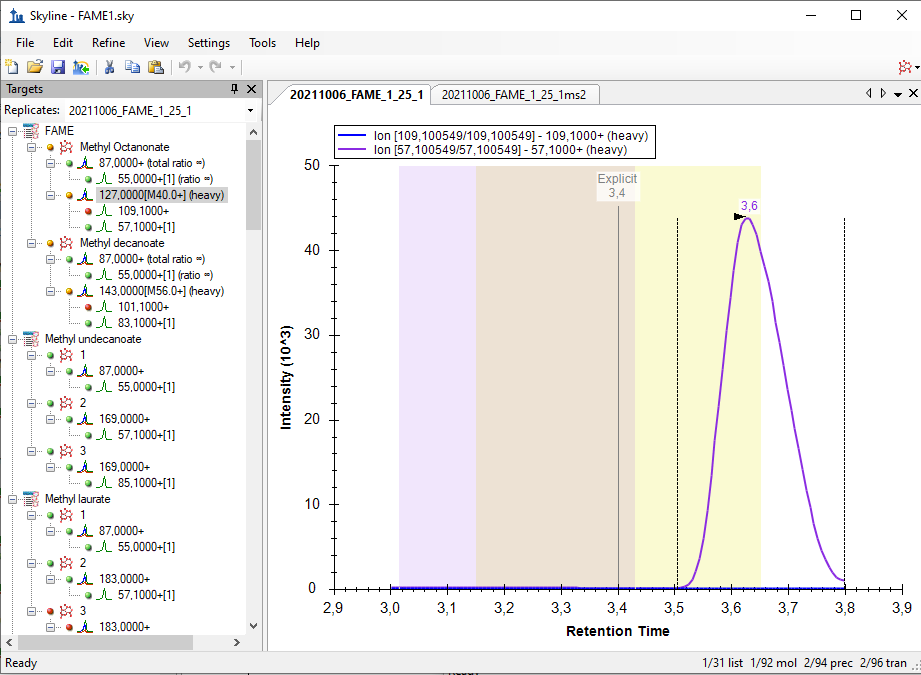
Hello Skyline Team, we encountered a strange issue, and did not find anything similar by using the serach function in the forum. We are using a Shimadzu GC-MS QP 2010 SE for targeted FAME analysis. Various methods of a naming scheme have been tried and can be sen in the Fame1ms1 image. If Into the same Transition settings the same file but only ms2 levels, the chromatogram looks how it's supposed to, but i loose the chromatograms for most of the molecules, as seen in immage Fame1ms2. If I only use a single molecule for analysis on ms 2 level everything looks like its working perfekt, as seen in image Fame2ms2, wich is a solution but due to the amount of samples and moluces not a solution we would prefere. Thank you for all your work on the Software |
|||||||||||||||||||||||||||||||||||||||||||||
| |||||||||||||||||||||||||||||||||||||||||||||
 Fame1ms1.bmp
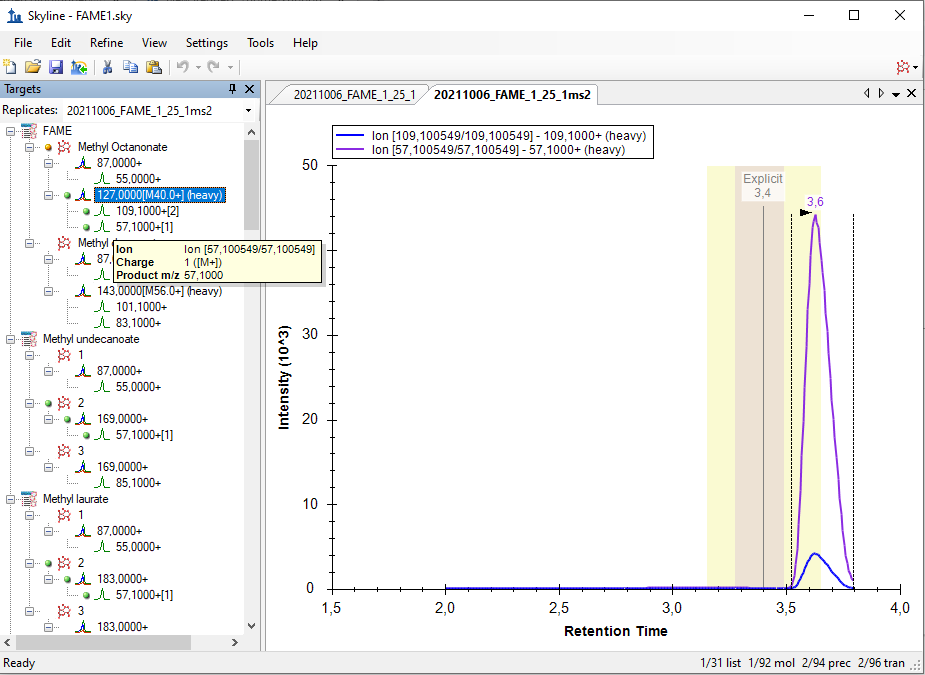 Fame1ms2.bmp
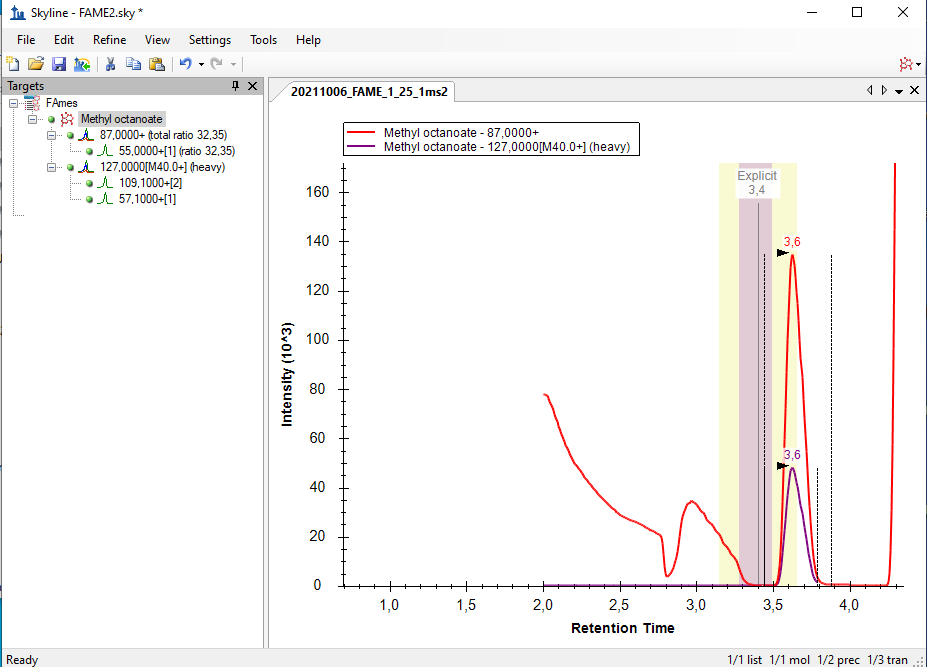 Fame2ms2.bmp
 Fame1ms1.png
 Scan980.png
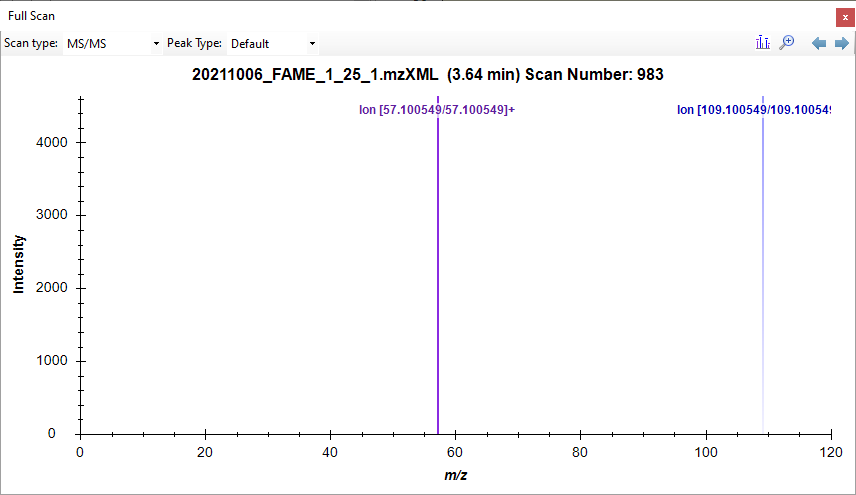 Scan983.png
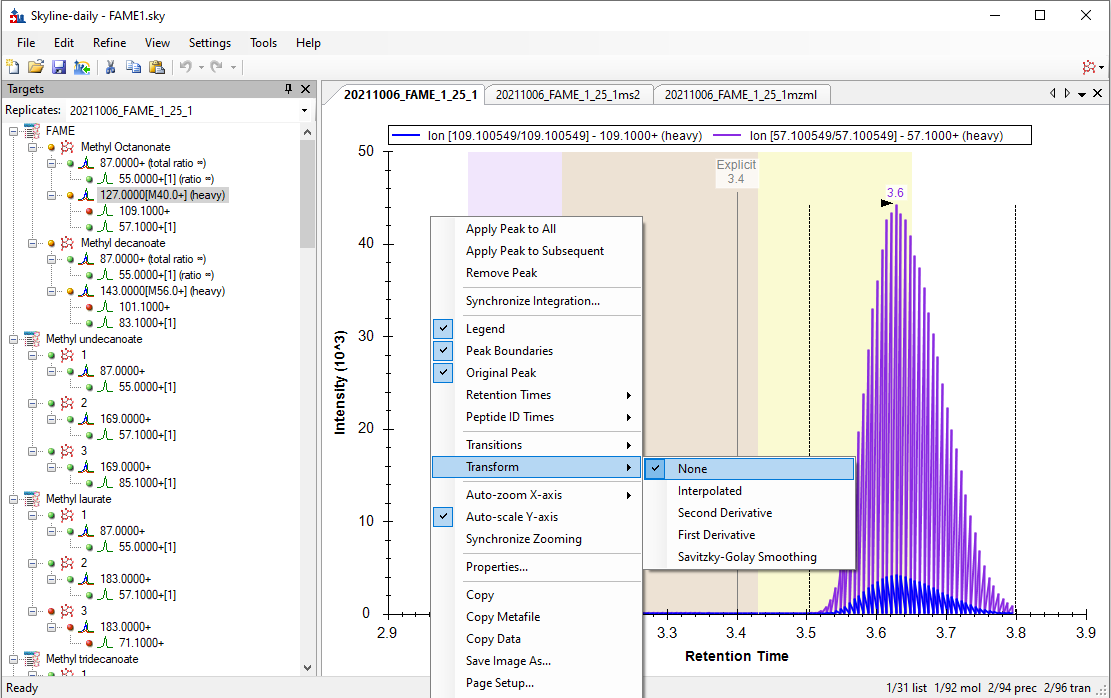 TransformNone.png
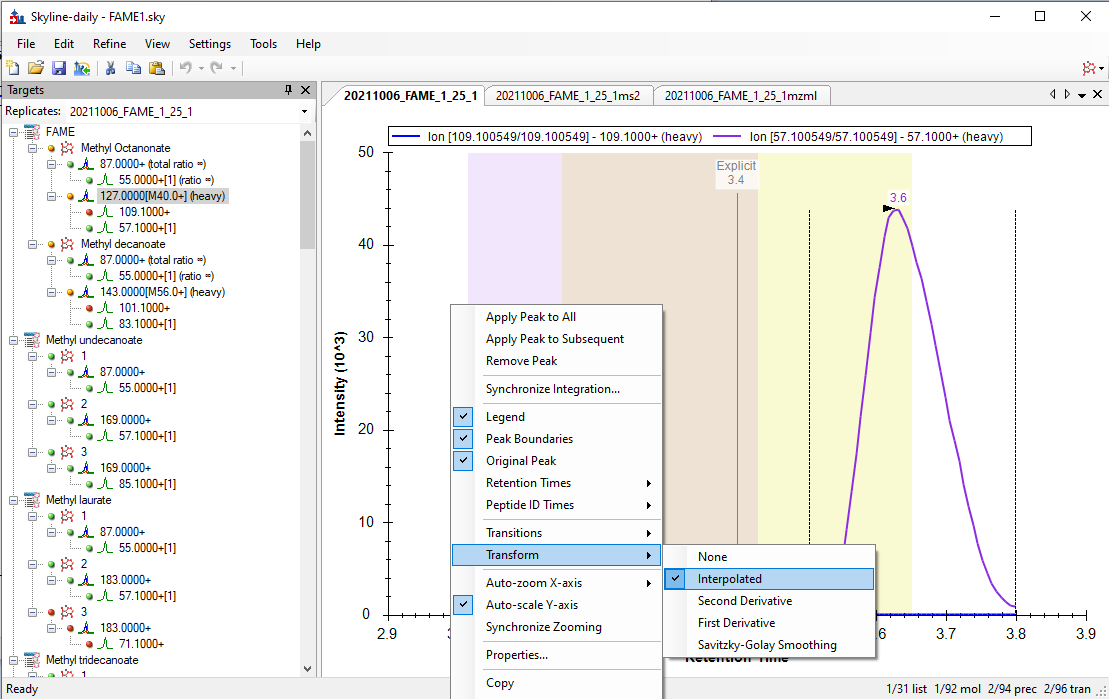 TransformInterpolated.png