I am working on rewriting the basic DIA tutorial (
https://skyline.ms/tutorial_dia.url) which is unfortunately from 2014 and badly in need of an update. We would now generally recommend using centroided spectra for DIA. So, that is what I am suggesting, but I also just ran into exactly the same issue as you are reporting with the precursor spectra, and I just found that it has to do with interference shifting the m/z centroid out of the expected range.
I have attached a PDF that shows the case for the charge 4 peptide precursor GWCLESSQCQDLTTESNLLECIR++++ in the DIA tutorial with profile spectra extracted as described in the current tutorial (resolving power 35,000 at 200 m/z) and centroided spectra extracted as we would currently recommend by default (mass error +/- 15 ppm).
Seeing this and thinking about it makes it feel almost obvious. We recommend using extraction from centroided MS/MS for DIA, and over large proteomewide DIA data sets, this choice can be clearly seen to improve both mProphet detections and quantitative results, but fragment ion XICs from DIA MS/MS are more selective (lower interference) than precursor ion XICs from MS1. This has been shown many times in the literature, beginning with the original SWATH paper, and more recently we are finding that having the entire fragment ion series to choose from, you can generally pick very low interference fragment ions.
It is a bit shocking to see interference represented as the disappearence of the ion peak altogether, but it is in fact an expected problem when two interfering peaks have slightly different but unresolved m/z values.
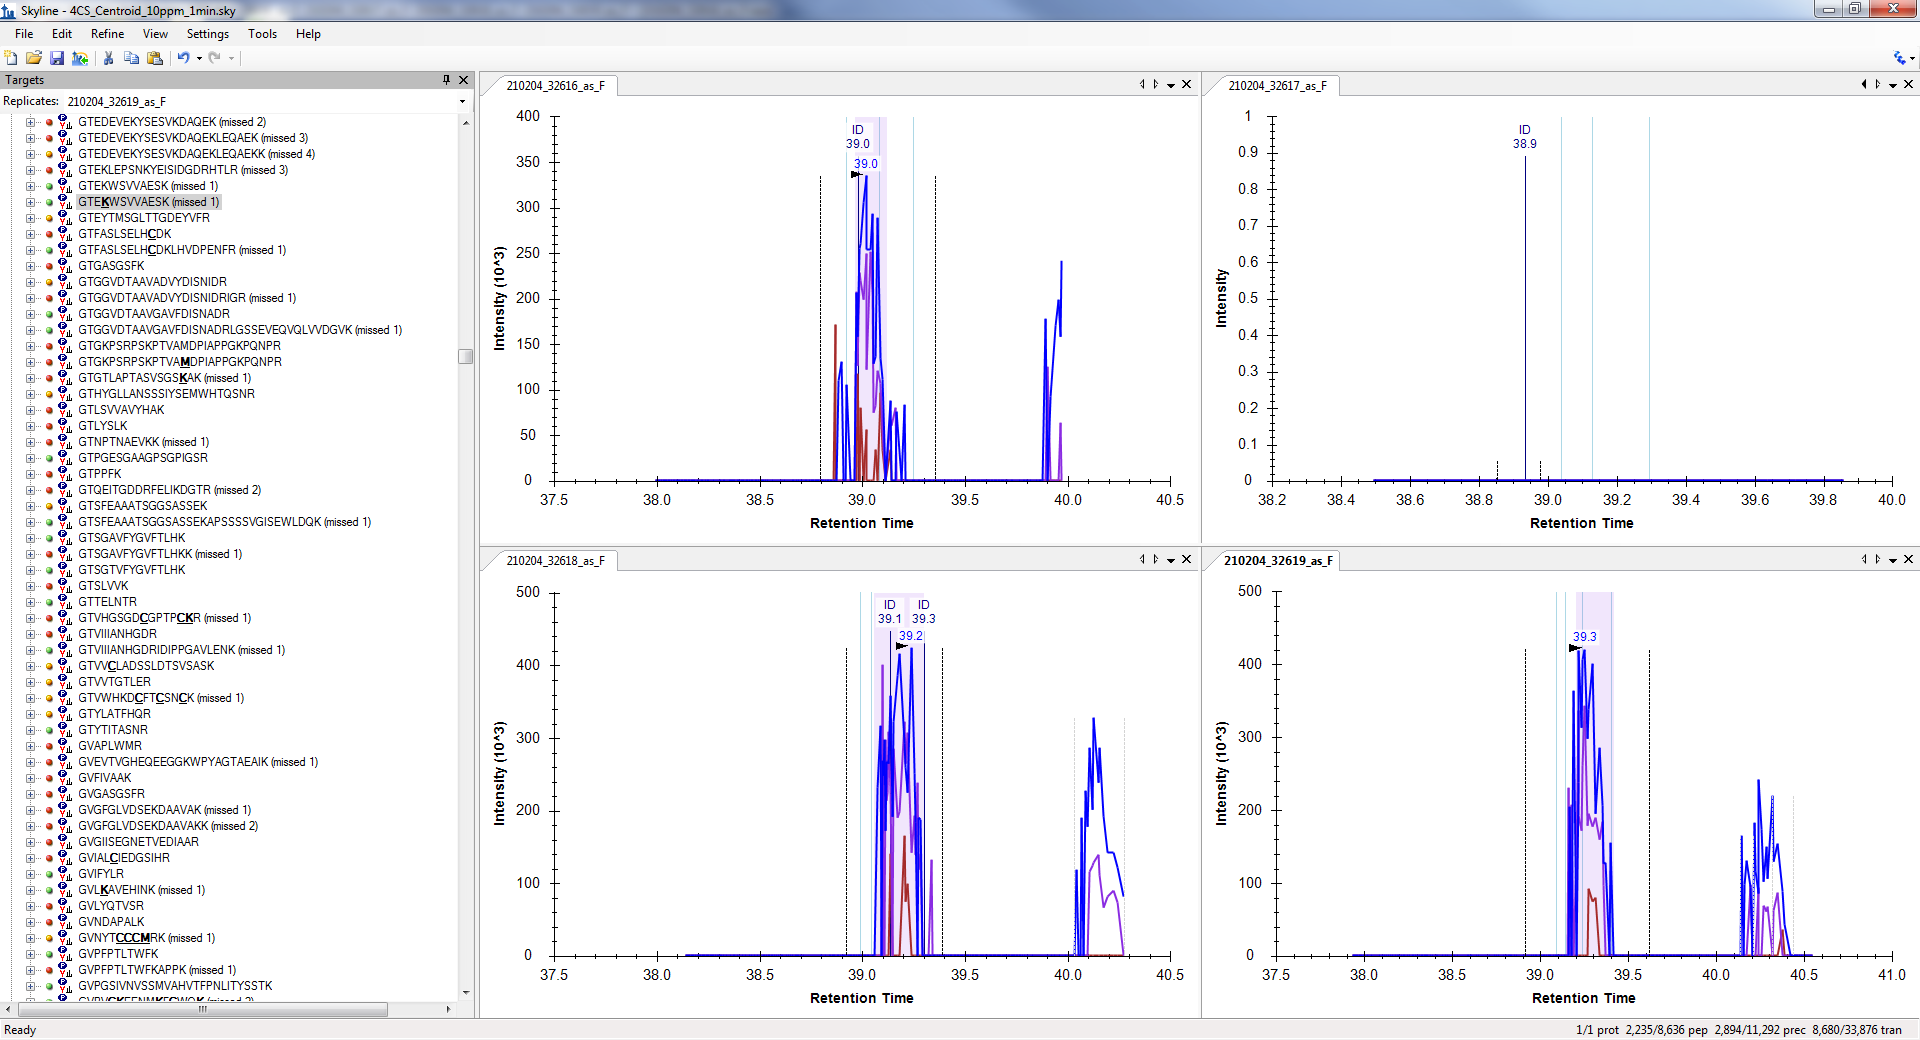
So, I would guess that disappearing precursor peak signal is likely a relatively common effect in XICs from centroided MS1 spectra when the mass error caused by the interference excedes the extraction mass error tolerance. You can even see this in the profile MS1 chromatogram plot where the peak mass error is listed as -28.4 ppm. Of course, it is going to disappear when you switch to extraction from centroided spectra with +/- 15 ppm tolerance. The profile chromatogram peak is not necessarily well related to the targeted precursor abundance, because of the interference.
I suspect you are probably seeing the same effect. And I admit that I had not yet realized this as a possible impact of MS1 spectra being less selective than MS/MS.
Thanks for posting to the Skyline support board.
--Brendan
 478.9123_Skyline_10ppm1min.png
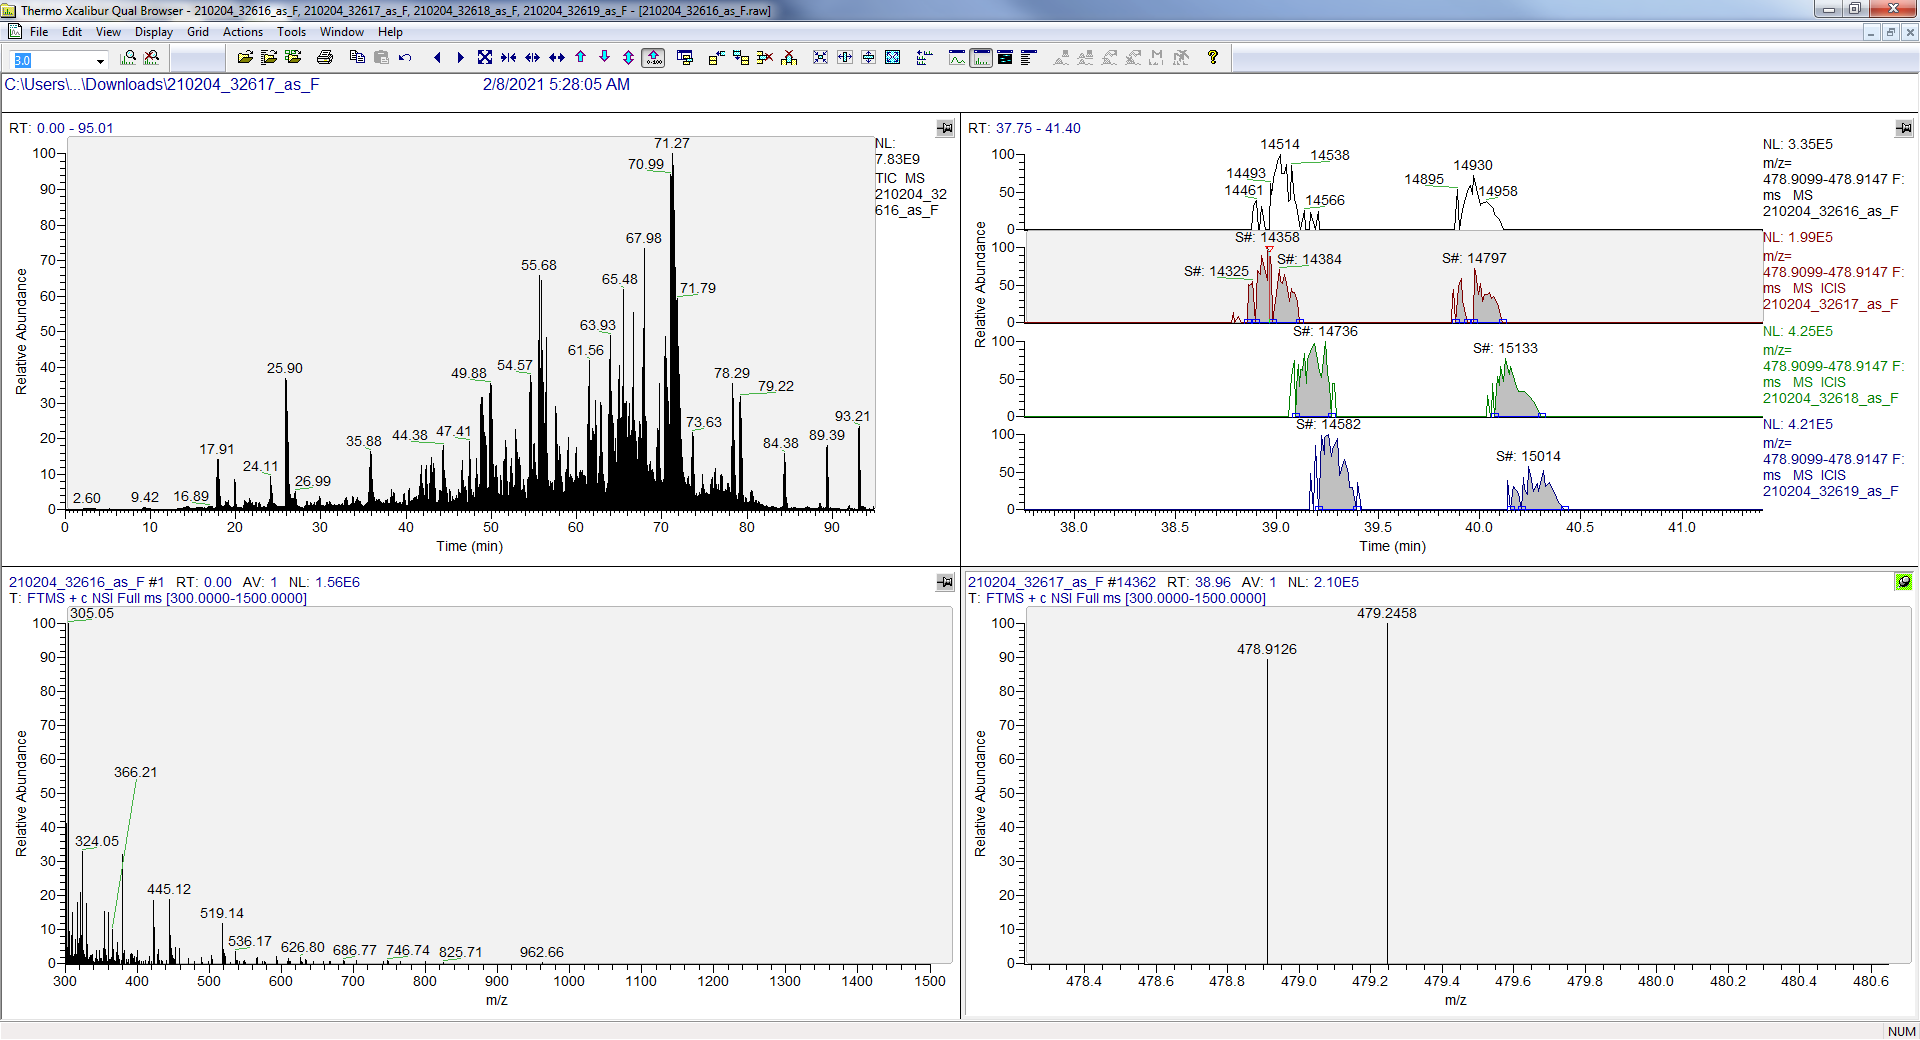 478.9123_XIC.png
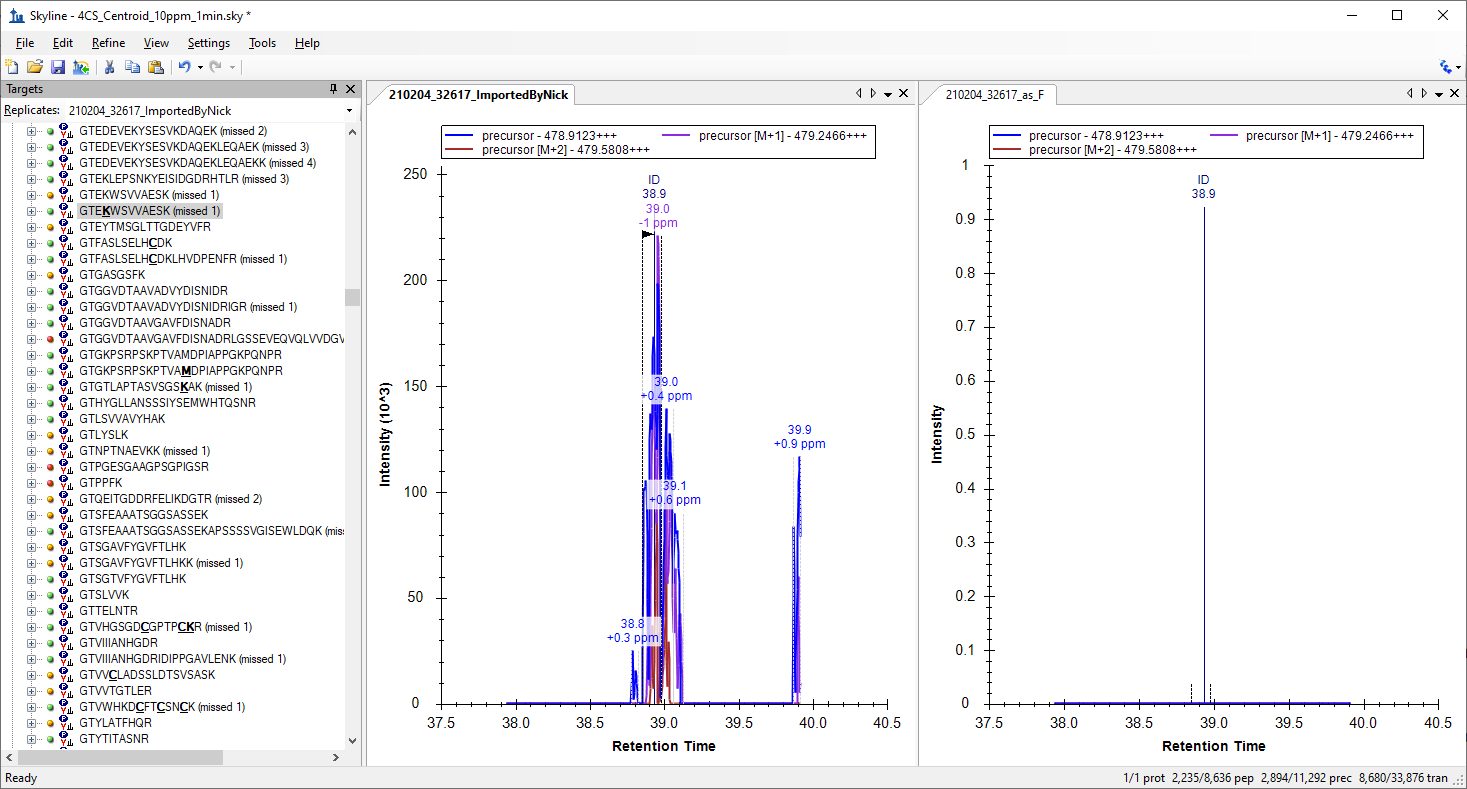 ReimportedByNick.png